The Effect of Neutral Nonadditive Gene Action on the Quantitative Index of
Population Divergence
Carlos Lo´pez-Fanjul,*
,1Almudena Ferna´ndez
†and Miguel A. Toro
†*Departamento de Gene´tica, Facultad de Ciencias Biolo´gicas, Universidad Complutense, 28040 Madrid, Spain and
†Departamento de Mejora Gene´tica Animal, SGIT-INIA, 28040 Madrid, Spain
Manuscript received July 17, 2002 Accepted for publication April 10, 2003
ABSTRACT
For neutral additive genes, the quantitative index of population divergence (QST) is equivalent to Wright’s
fixation index (FST). Thus, divergent or convergent selection is usually invoked, respectively, as a cause of
the observed increase (QST⬎FST) or decrease (QST⬍FST) ofQSTfrom its neutral expectation (QST⫽FST).
However, neutral nonadditive gene action can mimic the additive expectations under selection. We have studied theoretically the effect of consecutive population bottlenecks on the differenceFST⫺QSTfor two
neutral biallelic epistatic loci, covering all types of marginal gene action. With simple dominance,QST⬍
FSTfor only low to moderate frequencies of the recessive alleles; otherwise,QST⬎FST. Additional epistasis
extends the conditionQST⬍FSTto a broader range of frequencies. Irrespective of the type of nonadditive
action,QST⬍FSTgenerally implies an increase of both the within-line additive variance after bottlenecks
over its ancestral value (VA) and the between-line variance over its additive expectation (2FSTVA). Thus,
both the redistribution of the genetic variance after bottlenecks and theFST⫺ QSTvalue are governed
largely by the marginal properties of single loci. The results indicate that the use of theFST⫺QSTcriterion
to investigate the relative importance of drift and selection in population differentiation should be restricted to pure additive traits.
A
SSESSING the relative contributions of natural se- for a given set of populations, anFST estimate can beobtained from marker loci, assumed to be neutral, and lection and genetic drift to population
differentia-tion for quantitative traits is an important issue, in both it can be used as the null expectation that can be com-pared to the correspondingQSTestimate for a
quantita-evolutionary and conservation genetics (Wright1978;
Endler1986). In the absence of selection, inbreeding tive trait, assumed to be additive. Thus, divergent or con-vergent selection may be invoked, respectively, as a cause affects all genes to the same average degree, and the
of the observed increase (QST⬎FST) or decrease (QST⬍
effect of the breeding structure on population
diver-FST) ofQSTfrom its neutral expectation (QST⫽FST).
gence can be described by Wright’s among-population
Experimentally, this approach has been used in many fixation indexFST. In parallel, a dimensionless measure
studies (seeMerila¨andCrnokrak 2001 and McKay
of the quantitative genetic variance among populations
and Latta 2002 for reviews). In most instances, the (termedQSTbySpitze1993) can be defined asQST⫽Vb/
errors in the estimation ofFST andQSTwere large,
re-(Vb⫹ 2Vw), where Vb and Vw are, respectively, the
be-sulting in nonsignificant pairwise comparisons of these tween- and the additive within-population components
estimates. Nevertheless, a meta-analysis carried out by of the genetic variance for the trait considered. For
Merila¨and Crnokrak(2001) indicated that QST was
neutral genes, with additive action between and within
generally larger thanFST, and this result was interpreted
loci, it is expected that Vb ⫽ 2FSTVA and Vw ⫽ (1 ⫺
in the sense that a considerable part of the observed FST)VA, whereVAis the ancestral additive genetic variance
population divergence for quantitative traits should be (Wright1951). In this situation,QSTis the neutral
quan-attributed to differential selection pressures imposed by titative analog ofFST. This result holds quite generally,
local environmental conditions. regardless of the model of population structure (
Whit-Notwithstanding, the correspondence between QST
lock 1999). The computation of the expected
diver-andFSTdepends crucially on the assumption of pure
ad-gence of population means due to drift requires the
ditive gene action. This may not be an important restric-estimation of generally unknown parameters, such as
tion to the study of morphological traits, typically show-the rate of mutation, show-the time since divergence, and
ing substantial additive genetic variation and little or no the effective population size (Lande 1977). However,
inbreeding depression, but will markedly affect that of life-history traits, usually exhibiting larger levels of non-additive variance and, correspondingly, higher
inbreed-1Corresponding author:Departamento de Gene´tica, Facultad de
Cien-ing depression (CrnokrakandRoff1995; DeRoseand
cias Biolo´gicas, Universidad Complutense, 28040 Madrid, Spain.
E-mail: [email protected] Roff 1999). In the absence of selection, it has been
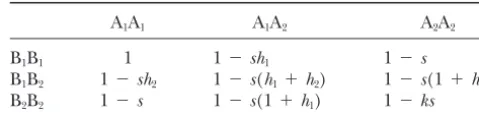
TABLE 1 shown theoretically that inbreeding can change the
magnitude of the contribution of dominant and/or epi- Genotypic values for the neutral two-locus epistatic system static loci to the values of Vband Vw, relative to their
additive expectations (Robertson 1952; Goodnight A1A1 A1A2 A2A2
1988;WillisandOrr1993;CheverudandRoutman
B1B1 1 1⫺sh1 1⫺s
1996;Lo´ pez-Fanjulet al.1999, 2000, 2002). In parallel,
B1B2 1⫺sh2 1⫺s(h1⫹h2) 1⫺s(1⫹h2)
increases of the additive variance with inbreeding have B
2B2 1⫺s 1⫺s(1⫹h1) 1⫺ks
been reported for viability in Drosophila melanogaster
s/2 (s⬎0) andhi(0ⱕhiⱕ1) are, respectively, the basic (Lo´ pez-Fanjul and Villaverde 1989; Garcı´a et al.
homozygous effect at each locus and the basic coefficient of 1994) andTribolium castaneum(Ferna´ndezet al.1995) dominance at the ith locus, and k (k ⬆ 2) is the epistatic and for morphological and behavioral traits in the factor.
housefly (reviewed byMeffert2000). Thus, nonaddi-tive gene action can potentially modify the expected
␣i ⫽s[hi⫹(1 ⫺2hi)qi⫹(k⫺ 2)qiq2j], (1) additive relationship betweenFSTandQST.
In this article, we have investigated theoretically the ␦
i ⫽s[(1⫺2hi)⫹(k⫺ 2)q2j]/2, (2) effect of successive population bottlenecks on the
differ-␥i⫽hi/[1⫹(k⫺ 2)q2j]. (3)
ence FST ⫺ QST for two-locus neutral epistatic systems,
covering all possible types of marginal gene action at Thus, epistasis (k⬆2) modifies the basic properties of the single-locus level (excluding overdominance). Our single loci, as ␣i,␦i, and ␥i become dependent on the approach follows that ofRobertson(1952), where the allelic frequencies at the other locus (qj); i.e., they are expected values of the derived within-line additive vari- contingent on the genetic background. For a given k ance and the between-line variance, after consecutive value, the basic (hi) and the marginal (␥i) degrees of bottlenecks of sizeN, are obtained from the expressions dominance become closer to each other asqjdecreases. giving the corresponding ancestral values in an infinite On the other hand,␥i approaches zero (complete re-population at equilibrium and the moments of the allele cessivity) askandqjincrease.
In an infinitely large panmictic population, expres-frequency distribution in populations of size N with
sions for the mean (ancestral meanM) and the additive binomial sampling. Explicit equations in terms of the
component of the genetic variance (ancestral additive genetic effects and allele frequencies derived byLo´
pez-varianceVA) can be obtained from Table 1, as
Fanjulet al.(2002) have been used, allowing the
speci-fication of the necessary conditions to observe a depar- M⫽ 1⫺ 2s兺h
iqi⫺s兺(1 ⫺2hi)q2i ⫹ (k⫺2)q21q22, (4)
ture ofQSTfrom the pertinentFSTvalue.
VA⫽兺␣2iHi, (5)
whereHiis the ancestral heterozygosity at theith locus THE MODEL (Hi⫽2piqi). These expressions are polynomial functions
ofpm
i (i⫽1, 2; m⫽1–4) and their expected values at We consider the model developed byLo´ pez-Fanjul
equilibrium, after t consecutive bottlenecks of N ran-et al.(2002), where the variation is due to segregation
domly sampled parents each (derived mean Mt* and at two neutral independent loci (i ⫽ 1, 2) at
Hardy-additive varianceVAt*), can readily be deduced by
substi-Weinberg equilibrium. At each locus there are two
al-tuting pm
i in Equations 4 and 5 by the corresponding leles, with frequenciespiandqi(⫽1⫺pi). Both loci have exactmth moment of the allelic frequency distribution equal homozygous effect (s/2), showing any degree of with binomial sampling, given by Crow and Kimura dominance in the absence of epistasis (hi⫽0,1⁄2, or 1 for (1970, p. 335). In parallel, the between-line variance
complete recessive, additive, or complete dominance V(Mt) aftertconsecutive bottlenecks can be derived by action, respectively). This basic gene action can be taking variances in Equation 4, the resulting expression viewed as that shown by single loci segregating against being also a function of the first four moments of the a fixed genetic background. Epistasis has been imposed allelic frequency distribution at each locus. As these on that basic system, and it is represented by a factork moments can also be written in terms of the inbreeding affecting the genotypic value of the double homozygote coefficient aftertgenerations (Ft), expressions forMt*, for the negative allele at each locus (k ⬍ 2, k ⬎ 2, VAt*, andV(Mt) also apply when bottleneck sizes are not or k⫽ 2 for diminishing, reinforcing, or no epistasis, constant from generation to generation. Those expres-respectively). A full specification of the genotypic values sions (given byLo´ pez-Fanjulet al.2002) are analytically is given in Table 1. At theith locus, the marginal average unmanageable, but numerical solutions can be calcu-effect of gene substitution (␣i), the marginal genotypic lated for any combination of allele frequencies, as well value of the heterozygote (␦i, expressed as deviation as the corresponding value of the quantitative index of from the midhomozygote value), and the marginal de- population divergenceQt⫽V(Mt)/(V(Mt)⫹2VAt* ) (see
V(Mt), and VAt* are kept for the two-locus system and tion 2). Equation 7 shows that VAt* always exceeds its
additive expectation, i.e., VAt* ⬎ (1 ⫺ Ft)VA.
Further-the subdivided population studied, butFST,QST,Vb, and
Vw are used, respectively, with reference to the whole more, as兺cov(␣2i,Hi)⬎0, the conditionVAt*⬎VAcan
be given asVA ⬍ 2(1⫺ Ft)VD, implyingqi ⬍ (1⫺ Ft)/ set of loci affecting a metric trait and the relevant
popu-lation structure. (2⫺Ft),i.e.,qi⬍1⁄2. These results also apply for
incom-plete recessives (0⬍hi⬍1⁄2).
It can be shown (Lo´ pez-Fanjulet al.2002) that the
change in mean after t bottlenecks is always negative In parallel, the between-line variance can be written as for basic recessive gene action (complete or incomplete,
V(Mt)⫽ 4⫺FtVA⫺F2tVD,
0 ⱕ hi ⬍ 1⁄2) and reinforcing epistasis (k ⬎ 2) or no
epistasis (k ⫽ 2). Nevertheless, diminishing epistasis where4⫽s2兺[E(q4i)⫺q4i]⬎0. Thus,V(Mt) equals only its additive expectation (2FtVA) for4 ⫽ 3FtVA ⫹ F2tVD.
(k⬍2) and/or basic dominance (incomplete or com-plete,1⁄
2⬍hiⱕ1) result in an unrealistic enhancement Moreover, Qt will be larger than Ft if 4 ⬍ 3FtVA ⫹
5F2
tVD and smaller otherwise, these conditions being
of the mean with inbreeding and, therefore, they are
not considered further. slightly more restrictive than those forV(Mt)⬆ 2FtVA,
unlessFt is large [e.g., V(Mt)⬎ 2FtVA for4 ⬎ 3FtVA ⫹
For pure additive action it is expected that Qt⫽ Ft,
asVAt*⫽(1⫺Ft)VAandV(Mt)⫽2FtVA(Wright1951). F2tVD].
Summarizing, for neutral loci and nonadditive gene For additive-by-additive epistasis, Qt ⬍ Ft for Ft ⬍ 1
(Whitlock1999) asVAt*⫽(1⫺Ft)VA⫹4Ft(1⫺Ft)VAA action (dominant and/or epistatic), Qt will generally depart fromFt, except in the particular case ofV(Mt)⫽ andV(Mt)⫽2FtVA ⫹4Ft2VAA, whereVAAis the
additive-by-additive variance component (Goodnight 1988). 2FtVAt*/(1⫺ Ft).
With dominance (with or without epistasis) equations giving VAt* and V(Mt) cannot be written in terms of
NUMERICAL EVALUATION summary statistics, as in the previous cases, but as
com-plex functions of the allele frequencies and effects at Three representative cases were studied, with additive (hi⫽1⁄2) or recessive (hi⫽0) basic gene action at both each locus and the pertinent epistatic factor (
Robert-son1952; Willis and Orr 1993;Lo´ pez-Fanjulet al. loci (s⫽ 0.1) and strong reinforcing epistasis (k⫽6) or with recessive nonepistatic action (hi⫽0,k⫽2). For 1999, 2000, 2002). However, for nonepistatic complete
recessive action (hi ⫽ 0,k ⫽ 2), some further insight each case, surfaces were represented (Figure 1), giv-ing the values of the followgiv-ing contrasts after one bottle-on the redistributibottle-on of the genetic variance induced
by bottlenecks and, consequently, on the relationship neck (N ⫽ 2,F1 ⫽ 0.25) for all possible combinations
of allele frequencies at both loci: (1) the ratio of derived betweenQt andFt, can be achieved as follows.
In general, from Equation 5, the expected additive to ancestral additive components of varianceVA1*/VA,
(2) the ratio of the between-line variance to its expected variance after bottlenecks can be given as
value for additive gene actionV(M1)/2F1VA, and (3) the
VAt*⫽ 兺cov(␣2i,Hi)⫹兺E(Hi)E(␣i2) differenceF
1 ⫺Q1 between the inbreeding coefficient
and the quantitative index of population divergence.
⫽ 兺cov(␣2
i,Hi)⫹(1⫺ Ft)兺Hi(V(␣i)⫹ ␣it*2) (6)
With different basic gene action at each locus and epista-(Lo´ pez-Fanjulet al.2002), whereE(Hi)⫽(1⫺Ft)Hi, sis, intermediate results were obtained (not shown). and␣it* andV(␣i) are, respectively, the derived marginal For complete recessive nonepistatic action, Q
1 ⬍ F1
average effect of gene substitution at theith locus after for only low to moderate frequencies of the recessive tbottlenecks and its variance, which can be deduced by allele at both loci (or for the recessive allele fixed in one taking expectations or variances, respectively, in Equa- locus and segregating at low frequency in the other); tion 1. Equation 6 shows that any excess ofVAt* over its otherwise,Q1⬎F1. The absolute value of the difference
ancestral value can be assigned to the spatial and tempo- F
1⫺Q1increased as the corresponding allele
frequen-ral changes in␣i(represented byV(␣i) and␣it*, respec- cies became more extreme. With additional epistasis, tively), which are both induced by drift, as well as to the conditionQ
1⬍F1holds for a much broader range
the covariance term, which depends on the ancestral of allele frequencies, andQ
1⬎F1for only high
frequen-properties of dominant loci [兺cov(␣2
i,Hi)⫽0 for pure cies of the recessive allele at both loci (or for the domi-additive or domi-additive-by-domi-additive gene action]. Of course, nant allele fixed in one locus and the recessive one dominance may be basic (0ⱕhi⬍1⁄2) or marginal (hi⫽ segregating at high frequency in the other). This
situa-1⁄
2,k⬎2). For nonepistatic complete recessives (hi⫽0, tion is similar to that obtained with basic additive action k⫽2),␣it*⫽ ␣i,V(␣i)⫽Fts2Hi/2, and兺cov(␣2i,Hi)⬎ and epistasis but, for low frequencies of both negative 0. Thus, alleles, the excess ofF
1overQ1was, comparatively, much
reduced. As shown by Equation 3, this can be ascribed VAt*⫽兺cov(␣2i,Hi)⫹ (1⫺Ft)(VA⫹2FtVD), (7)
to the marginal degrees of dominance (␥i) becoming closer to the basic ones (hi ⫽1⁄2) as the frequencies of
whereVDis the dominance component of the ancestral
Figure1.—Ratio of derived to ancestral additive components of varianceVA1*/VA(log scale), ratio of the between-line variance
to its additive expectationV(M1)/2F1VA(log scale), and differenceF1⫺Q1between the inbreeding coefficient and the quantitative
index of population divergence, after one bottleneck (N ⫽2,F1⫽1⁄4), for (1) nonepistatic complete recessive action at both
loci (hi ⫽0, k⫽2), (2) basic complete recessive action at both loci and reinforcing epistasis (hi⫽ 0, k⫽6), and (3) basic additive action at both loci and reinforcing epistasis (hi⫽1⁄2,k⫽6). Darker zones correspond to ratios smaller than one or to
negativeF1⫺Q1values.
preserved when the negative allele is fixed in one locus bottleneck increased. With basic recessive action, in-creasing values of the epistatic factor k did not affect and segregates at low frequency in the other as, in this
case, the marginal degree of dominance of this second much the absolute value of the contrast (not shown) as, in this case, the basic and marginal degrees of domi-locus approaches zero (i.e., the locus becomes
increas-ingly recessive). These results apply to populations sub- nance are the same. However, with epistasis and basic additive action, that absolute value was positively corre-jected to a single bottleneck of any size, albeit the
to zero for increasing k values. Of course, for basic only as a modulating factor (Lo´ pez-Fanjulet al.1999, additive action without epistasisF1⫽Q1. 2000, 2002).
As shown in Figure 1, Q1 ⬍ F1 holds approximately So far, this discussion has been limited to investigating
for the whole range of allele frequencies implying both the consequences of population bottlenecks on theFt⫺ V(M1)⬎ 2F1VA andVA1* ⬎VA, irrespective of the type Qt difference generated by two-locus nonadditive neu-of basic gene action, and the reverse was also true. These tral systems. An extension of these results to the whole conditions also hold after consecutive bottlenecks, but set of loci determining the additive variance of a quanti-the absolute value ofFt⫺Qtinitially increases with the tative trait will, in principle, require a complete specifi-number of bottlenecks until a maximum is reached for cation of their genotypic effects and allele frequencies, Ftclose to 0.5 and then subsequently decreases to zero as the contribution of loci with the same type of gene (not shown). These changes have also been described action to the totalFST⫺QSTvalue can even be of different byRobertson(1952) for nonepistatic recessives at low sign, depending on their respective allele frequencies. frequency. Summarizing, with epistasis,Qt ⬍ Ft for all Generalizations into multilocus systems can be made combinations of allele frequencies at both loci, excep- only if individual loci show the same type of gene action ting for high frequencies of the negative (recessive) and segregate with similar frequencies. Only in this situ-alleles. Without epistasis, however,Qt⬍Ftfor only low ation do our theoretical results provide a framework to moderate frequencies of those alleles. within which some experimental data can be inter-preted. The following discussion is restricted toD. mela-nogasterandT. castaneum, where detailed genetic infor-DISCUSSION
mation on relevant traits is available.
We have shown that theQtvalue generated by neutral At one extreme of the spectrum, we have traits such dominant and/or epistatic loci, aftertconsecutive popu- as abdominal bristle number or wing size and shape lation bottlenecks, will always be larger or smaller than characteristics of the wing. In natural populations of its additive expectationFt, with the trivial exception de- Drosophila, very little or no inbreeding depression has termined by those particular combinations of allele fre- been detected for those characters and their between-quencies fixing the boundary lines between the positive and within-line additive variances after bottlenecks very and negative regions of theFt⫺Qtsurface. Therefore, closely approached the expectations under the pure the use of theFt⫺Qtdifference as a criterion to
investi-additive model (Lo´ pez-Fanjul et al. 1989; Whitlock
gate the relative importance of genetic drift and natural
andFowler1999). In parallel, spontaneous mutations selection in population differentiation is restricted to
affecting bristle number, wing length, and wing width pure additive traits, as nonadditive action at neutral
occur at a low rate and have a relatively large average loci can mimic the expectations for additive loci under
homozygous effect (Garcı´a-Dorado et al.1999). Fur-divergent (Qt ⬎ Ft) or convergent selection (Qt ⬍ Ft).
thermore, those mutations with an effect smaller than Moreover, for nonneutral nonadditive loci, selection
one-half phenotypic standard deviation of the pertinent will also affect (positively or negatively) the Ft ⫺ Qt
trait were predominantly additive and quasi-neutral value and this additional effect could even change the
(Santiagoet al.1992;Lo´ pezandLo´ pez-Fanjul1993; expected sign of that difference under neutrality.
Merchanteet al. 1995). Thus, a large fraction of the For nonadditive gene action, previous theoretical
corresponding genetic variance in natural populations work concerned with the divergence betweenFtandQt
will be contributed by a small number of quasi-neutral was restricted to the neutral additive-by-additive model,
additive loci segregating at intermediate frequencies whereQt ⬍ Ft for Ft ⬍ 1 (Whitlock 1999). However,
(Robertson1967;GallegoandLo´ pez-Fanjul1983). the effect of dominance (with or without epistasis) can
At the other end of the spectrum, we consider viability qualitatively alter that result, as Qt may be smaller or
in natural populations of Drosophila and Tribolium. larger thanFt, depending on the relevant allele
frequen-After bottlenecks, viability showed strong inbreeding cies. With simple dominance, Qt ⬍ Ft for only low to
depression and its within-line additive variance signifi-moderate frequencies of the recessive alleles, but
addi-cantly increased above the ancestral value (Lo´
pez-Fan-tional epistasis extends that condition to higher values
julandVillaverde1989;Garcı´aet al.1994;
Ferna´n-of the frequencies Ferna´n-of the negative (recessive) alleles at
dezet al.1995). Therefore, much of the genetic variance one of the loci involved (but not at both). Irrespective
of the trait should be due to partially (or totally) reces-of the type reces-of gene action considered, we have also
sive deleterious alleles segregating at low frequencies. shown thatQt⬍Ftgenerally implies an increase of the
In Drosophila, most newly arisen mutations affecting within-line additive variance after bottlenecks (VAt* ⬎
viability had, on the average, a relatively large homozy-VA), as well as an excess of the between-line variance
gous disadvantage and their gene action was close to over its additive expectation (V(Mt) ⬎ 2FtVA). Thus,
recessive (Garcı´a-Doradoet al.1999;Garcı´a-Dorado
both the redistribution of the genetic variance after
andCaballero2000;Chavarrı´as et al. 2001). Using bottlenecks and the value ofFt⫺Qtare governed largely
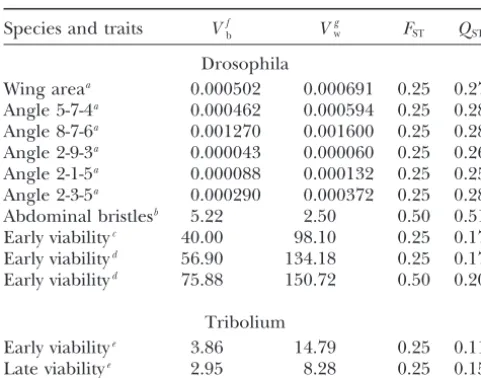
TABLE 2 known bout of random drift in sets of loci differing in their predominant type of gene action. In other words,
FSTandQSTestimates after experimental bottlenecks
the results in Table 2 can be taken as an experimental check of the validity of our theoretical predictions. Species and traits Vfb V
g
w FST QST
Incomplete information on the genetic properties of Drosophila the traits studied makes the interpretation of theF
ST⫺
Wing areaa 0.000502 0.000691 0.25 0.27
QSTdifference more problematic. Estimates ofFST(from
Angle 5-7-4a 0.000462 0.000594 0.25 0.28
molecular markers) andQST(for different quantitative
Angle 8-7-6a 0.001270 0.001600 0.25 0.28
traits) have been reported for sets of populations in a Angle 2-9-3a 0.000043 0.000060 0.25 0.26
variety of plant and animal species (reviewed byMerila¨
Angle 2-1-5a 0.000088 0.000132 0.25 0.25
andCrnokrak2001 andMcKayandLatta2002). For Angle 2-3-5a 0.000290 0.000372 0.25 0.28
Abdominal bristlesb 5.22 2.50 0.50 0.51 most traits
QSTwas larger thanFST, this result being
in-Early viabilityc 40.00 98.10 0.25 0.17
terpreted as a consequence of differential population Early viabilityd 56.90 134.18 0.25 0.17
adaptation to local conditions. The most common ex-Early viabilityd 75.88 150.72 0.50 0.20
perimental design included populations from different geographic origins, each of them subdivided into fami-Tribolium
lies (typically full-sib families) and a number of individu-Early viabilitye 3.86 14.79 0.25 0.11
als assayed per family, all of them maintained under Late viabilitye 2.95 8.28 0.25 0.15
the same environmental conditions. Here we are not Estimates of the between- (Vb) and the additive within- (Vw) concerned with the validity of inferring the population
line components of variance after one or three consecutive
structure from the marker’s information, but we con-bottlenecks (N⫽2) and the correspondingFSTandQSTvalues
sider only those potential biases resulting from the treat-for morphological traits and viability inDrosophila melanogaster
andTribolium castaneum. ment of quantitative data (detailed by Merila¨ and
aWhitlockandFowler(1999) and unpublished data.
Crnokrak 2001). Following standard ANOVA proce-bLo´ pez-Fanjulet al.(1989).
dures, the total variance for each trait was partitioned cLo´ pez-FanjulandVillaverde(1989).
into sources arising from variation between populations, dGarcı´aet al.(1994).
between families, within populations, and within fami-eFerna´ndezet al.(1995).
fAll estimates were corrected for common environmental lies. In general, the genetic architecture of the traits effects by subtracting the correspondingVbat generation 0. assayed was unknown and, therefore, the estimates of
gEstimates from mother-daughter regression analysis
(refer-the additive within-line variance obtained from full-sib ence in a) or realized heritability after one generation of
analysis could be biased upward, as they may include artificial selection (references inb–e).
fractions of the dominance and epistatic components of variance, as well as twice the environmental compo-nent of variance common to family members (including able to show that the inbreeding depression and the
increase in the additive variance of viability following maternal effects). Biases due to nonadditive gene action will be more likely for life-history traits, which generally bottlenecks can be ascribed mainly to a rise in the
fre-quency of lethals and partially recessive mutations of show higher levels of dominance variance than morpho-logical traits show. Furthermore, estimates of the be-large deleterious effects.
Table 2 shows the between- and the additive within- tween-population variance could also be inflated to an unknown amount, due to common environmental ef-line components of the genetic variance after one or
three consecutive bottlenecks (N ⫽ 2) and the corre- fects (maternal and nonmaternal) that have not been experimentally removed. Even in a pure neutral additive sponding FST andQSTvalues, for seven morphological
traits in Drosophila (wing area, five angles whose vertices situation, with biased estimates of the between- and within-line variances due to common environment only, are defined by the intersections of the veins of the wing,
and abdominal bristle number) and viability in Dro- Vb⫽2FST(1⫹a)VA,Vw⫽(1⫺FST)(1⫹b)VA, andQST⫽
(1⫹a)FST/[(1⫹a)FST⫹(1⫹b)(1⫺FST)]. Therefore,
sophila and Tribolium. As expected, FSTand QSTwere
very close for all morphological traits (average FST ⫺ the neutral expectation QST⫽FST will hold only when
the magnitude of both biases is the same (a⫽b), and QST⫽ ⫺0.018, range⫺0.03–0) and, for viability,FSTwas
considerably larger thanQSTin all cases (averageFST⫺ a⬎bora⬍bwill, respectively, mimic the expectation
under divergent (QST ⬎ FST) or convergent selection
QST⫽0.14, range 0.08–0.30). It must be stressed that,
in the experiments reviewed, all lines have been main- (QST ⬍ FST). In parallel, as shown by our theoretical
analysis, nonadditive action of neutral quantitative loci tained under the same environmental conditions and
have been subjected to a small number of bottlenecks could also distort the expected additive relationship between FSTand QST, even if the estimates of QST are
(typically one). Thus, the effect of selection can be
as-sumed to be small and the contrasting behavior of the free from environmental biases.
Summarizing, the sign of the differenceFST⫺QSTwill
FST⫺QSTvalue for morphological traits and viability can
Lo´ pez-Fanjul, C., andA. Villaverde, 1989 Inbreeding increases
genetic variance is mostly (or totally) generated by
segre-genetic variance for viability inDrosophila melanogaster.Evolution
gation at pure additive loci. Although these traits are 43:1800–1804.
Lo´ pez-Fanjul, C., J.Guerraand A.Garcı´a, 1989 Changes in the
dis-commonly assumed to be quasi-neutral, theFST⫺ QST
tribution of the genetic variance of a quantitative trait in small
criterion may be useful to establish the validity of this
populations ofDrosophila melanogaster. Genet. Sel. Evol.21:159–168.
hypothesis. Lo´ pez-Fanjul, C., A. Ferna´ndezandM. A. Toro, 1999 The role
of epistasis in the increase in the additive genetic variance after We thank Michael Whitlock and Kevin Fowler for kindly allowing
population bottlenecks. Genet. Res.73:45–59. us to use their unpublished estimates of variance components for
Lo´ pez-Fanjul, C., A. Ferna´ndezandM. A. Toro, 2000 Epistasis Drosophila wing traits. This study was supported by grant PB98-0814- and the conversion of non-additive to additive genetic variance C03-01 from the Ministerio de Educacio´n y Cultura and RZ01-028- at population bottlenecks. Theor. Popul. Biol.58:49–59. C2-1 from Instituto Nacional de Investigaciones Agrarias. Lo´ pez-Fanjul, C., A. Ferna´ndezandM. A. Toro, 2002 The effect
of epistasis on the excess of the additive and non-additive vari-ances after population bottlenecks. Evolution56:865–876.
McKay, J. K., and R. G. Latta, 2002 Adaptive population diver-gence: markers, QTL and traits. TREE17:285–291.
LITERATURE CITED
Meffert, L. M., 2000 The evolutionary potential of morphology and mating behavior. The role of epistasis in bottlenecked
popula-Chavarrı´as, D., C. Lo´ pez-Fanjul and A. Garcı´a-Dorado, 2001
tions, pp. 177–193 inEpistasis and the Evolutionary Process, edited The rate of mutation and the homozygous and heterozygous
by J. B.Wolf, E. D.Brodieand M. J.Wade. Oxford University mutational effects for competitive viability: a long-term
experi-Press, New York. ment withDrosophila melanogaster.Genetics158:681–693.
Merchante, M., A. Caballero andC. Lo´ pez-Fanjul, 1995
Re-Cheverud, J. M., andE. J. Routman, 1996 Epistasis as a source of
sponse to selection from new mutation and effective size of par-increased additive genetic variance at population bottlenecks.
tially inbred populations. II. Experiments withDrosophila
melano-Evolution50:1042–1051.
gaster.Genet. Res.66:227–240.
Crnokrak, P., andD. A. Roff, 1995 Dominance variance:
associa-Merila¨, J., andP. Crnokrak, 2001 Comparison of genetic differenti-tions with selection and fitness. Heredity75:530–540.
ation at marker loci and quantitative traits. J. Evol. Biol.14:892–903.
Crow, J. F., andM. Kimura, 1970 An Introduction to Population
Genet-Robertson, A., 1952 The effect of inbreeding on the variation due
ics Theory. Harper & Row, New York.
to recessive genes. Genetics37:189–207.
DeRose, M. A., andD. A. Roff, 1999 A comparison of inbreeding
Robertson, A., 1967 The nature of quantitative genetic variation, depression in life-history and morphological traits in animals.
pp. 265–280 inHeritage From Mendel, edited by A.Brink. University Evolution53:1288–1292.
of Wisconsin Press, Madison, WI.
Endler, J. A., 1986 Natural Selection in the Wild. Princeton University
Santiago, E., J. Albornoz, A. Domı´nguez, M. A. ToroandC. Lo´ pez -Press, Princeton, NJ.
Fanjul, 1992 The distribution of effects of spontaneous
muta-Ferna´ndez, A., M. A. ToroandC. Lo´ pez-Fanjul, 1995 The effect
tions on quantitative traits and fitness inDrosophila melanogaster.
of inbreeding on the redistribution of genetic variance of
fecun-Genetics132:771–781. dity and viability inTribolium castaneum.Heredity75:376–381.
Spitze, K., 1993 Population structure inDaphnia obtusa: quantitative
Gallego, A., andC. Lo´ pez-Fanjul, 1983 The number of loci
affect-genetic and allozymic variation. Genetics135:367–374. ing a quantitative trait inDrosophila melanogasterrevealed by
artifi-Wang, J., A. Caballero, P. D. KeightleyandW. G. Hill, 1998 cial selection. Genet. Res.42:137–149.
Bottleneck effect on genetic variance: theoretical investigation
Garcı´a, N., C. Lo´ pez-Fanjuland A. Garcı´a-Dorado, 1994 The
of the role of dominance. Genetics150:435–447. genetics of viability inDrosophila melanogaster: effects of
inbreed-Whitlock, M. C., 1999 Neutral additive genetic variance in a meta-ing and artificial selection. Evolution48:1277–1285.
population. Genet. Res.74:215–221.
Garcı´a-Dorado, A., andA. Caballero, 2000 On the average coef- Whitlock, M. C., andK. Fowler, 1999 The changes in genetic and ficient of dominance of deleterious spontaneous mutation. Ge- environmental variance with inbreeding in
Drosophila
melanogas-netics155:1991–2001. ter.Genetics152:345–353.
Garcı´a-Dorado, A., C. Lo´ pez-Fanjul and A. Caballero, 1999 Willis, J. H., andH. A. Orr, 1993 Increased heritable variation Properties of spontaneous mutations affecting quantitative traits. following population bottlenecks: the role of dominance. Evolu-Genet. Res.75:47–51. tion47:949–957.
Goodnight, C., 1988 Epistasis and the effect of founder events on Wright, S., 1951 The genetical structure of populations. Ann. Eu-the additive genetic variance. Evolution42:441–454. gen.15:323–354.
Lande, R., 1977 Statistical tests for natural selection on quantitative Wright, S., 1978 Evolution and the Genetics of Populations: Variability characters. Evolution31:442–444. Within and Among Natural Populations, Vol. 4. University of Chicago
Lo´ pez, M. A., andC. Lo´ pez-Fanjul, 1993 Spontaneous mutation Press, Chicago. for a quantitative trait inDrosophila melanogaster. II. Distribution