©
DOI: 10.1534/genetics.104.031393
Genetic Diversity and Population Structure of Teosinte
Kenji Fukunaga,*
,1Jason Hill,
†Yves Vigouroux,*
,2Yoshihiro Matsuoka,*
,3Jesus Sanchez G.,
‡Kejun Liu,
§,4Edward S. Buckler** and John Doebley*
,5*Laboratory of Genetics, University of Wisconsin, Madison, Wisconsin 53706,†Department of Plant Biology, University of Minnesota, St. Paul, Minnesota 55108,‡Centro Universitario de Ciencias Biologicas y Agropecuarias,
Universidad de Guadalajara, Zapopan, Jalisco, Mexico CP45110,§Statistics Department, North Carolina State University, Raleigh, North Carolina 27695 and**USDA-ARS,
Institute for Genomic Diversity, Cornell University, Ithaca, New York 14853 Manuscript received May 19, 2004
Accepted for publication January 3, 2005
ABSTRACT
The teosintes, the closest wild relatives of maize, are important resources for the study of maize genetics and evolution and for plant breeding. We genotyped 237 individual teosinte plants for 93 microsatellites. Phylogenetic relationships among species and subspecific taxa were largely consistent with prior analyses for other types of molecular markers. Plants of all species formed monophyletic clades, although relationships among species were not fully resolved. Phylogenetic analysis indicated that the Mexican annual teosintes divide into two clusters that largely correspond to the previously defined subspecies,Z.maysssp.parviglumisand ssp. mexicana, although there are a few samples that represent either evolutionary intermediates or hybrids between these two subspecies. The Mexican annual teosintes show genetic substructuring along geographic lines. Hybridization or introgression between some teosintes and maize occurs at a low level and appears most common withZ.maysssp.mexicana. Phylogeographic and phylogenetic analyses of the Mexican annual teosintes indicated that ssp.parviglumisdiversified in the eastern part of its distribution and spread from east to west and that ssp.mexicanadiversified in the Central Plateau of Mexico and spread along multiple paths to the north and east. We defined core sets of collections ofZ. maysssp.mexicanaand ssp. parviglumisthat attempt to capture the maximum number of microsatellite alleles for given sample sizes.
T
EOSINTE is a wild grass native to Mexico and Cen- analyses, a refined understanding of its phylogenetics and population structure can help guide further re-tral America (Figure 1) and the closest wild relativesearch in all of these areas. of cultivated maize (Zea mays ssp. mays L.). Teosinte
Together, teosinte and maize compose the genus Zea, represents an important resource for the study of maize
which has four species (Figure 1): (1) Z. luxurians genetics (EvansandKermicle2001), quantitative
ge-(Durieu and Ascherson) Bird, an annual teosinte from netics (LukensandDoebley1999), molecular
popula-Central America; (2)Z. diploperennisIltis, Doebley and tion genetics (Gaut et al. 2000), genome evolution
Guzman, a diploid perennial teosinte from Jalisco, Mex-(Sanz-Alferez et al. 2003), and crop evolution (
Doe-ico; (3) Z. perennis (Hitchc.) Reeves and
Mangels-bley1990a). Notably, teosinte has become one of the
dorf, a tetraploid perennial teosinte from Jalisco, Mex-best-characterized systems for plant molecular
popula-ico; and (4) Z. mays, a polytypic annual species that tion genetics, including studies utilizing DNA samples
includes four subspecies. The four subspecies are (1) recovered from archeological specimens (Jaenicke
-ssp. mays (maize); (2) ssp. mexicana (Schrader) Iltis,
Despre´s et al. 2003). The teosintes also represent an
a large-spikeleted teosinte adapted to the drier high important potential resource for maize breeding,
al-elevations (ⵑ1600–2700 m) of northern and central though they have not yet been extensively used in this
Mexico; (3) ssp. parviglumisIltis and Doebley, a small-capacity. Given the breadth of use of teosinte in genetic
spikeleted teosinte adapted to the moister middle eleva-tion (ⵑ400–1800 m) of southwestern Mexico; and (4) ssp. huehuetenangensis (Iltis and Doebley) Doebley, an
1Present address:The International Research Center for Japanese
annual teosinte found only in the province of Studies, 3-2 Oeyama-cho, Goryo, Nishikyo-ku, Kyoto 610-1192, Japan.
Huehuetenango in western Guatemala (Doebley
2Present address:Institut de Recherche pour le Developpement,
Mont-pellier 34730, France. 1990b). The four species ofZ. mays have been placed
3Present address: Fukui Prefectural University, Matsuoka-cho, Yos- into two sections: section Zea, which contains onlyZ. hida-gun, Fukui 910-1195, Japan. mays, and section Luxuriantes, which is composed of the
4Present address:National Institute of Statistical Sciences, 19 T. W.
other three species. Most of these teosinte species and Alexander Dr., Research Triangle Park, NC 27709-4006.
subspecies have narrow geographic distributions
con-5Corresponding author:Laboratory of Genetics, University of
Wiscon-sin, 445 Henry Mall, Madison, WI 53706. E-mail: jdoebley@wisc.edu sisting of only a few local populations; however, ssp.
Figure1.—Geographical distribution of the teosinte populations used in this study. Since many accessions come from geographi-cally very close locations, their symbols overlap on the map.
1). Wilkes (1967) dividedZ. mays ssp. mexicana into three mexicana and ssp. parviglumis are exceptions, being
races: Central Plateau, Chalco, and Nobogame. Because many
widely distributed in Mexico (Figure 1). Recently,Iltis
new populations have been discovered since Wilkes’ seminal
andBenz(2000) classifiedZ. luxuriansfrom Nicaragua work (Sanchezet al.1998), we dividedZ. maysssp.mexicana as a new species, Z. nicaraguensisIltis and Benz. Here, into five geographical groups: Central Plateau, Chalco, Du-we treat it as one geographical group ofZ. luxurians. rango, Nobogame, and Puebla. Further extending Wilkes’ analysis, we divided Z. mays ssp. parviglumis into two races,
To clarify the phylogeny and population structure of
Balsas and Jalisco, and into five geographical groups, eastern
the teosintes, we used a set of 93 microsatellite or simple
Balsas, Central Balsas, Jalisco, Oaxaca, and southern Guerrero
sequence repeat (SSR) loci and a sample of 237 individ- (Table 1, Figure 1). Two individual plants of the genus Tripsa-ual teosinte plants that cover the entire geographical cum (one individual each ofT. zopilotenseandT. peruvianum) distribution of the teosintes. We addressed four ques- were used as the outgroup in phylogenetic analyses. See sup-plementary materials at http://genetics.org/supplemental/
tions: (1) How are Zea taxa related to each other?, (2)
for the complete passport data for the plants, including
germ-How did the annual teosintes diversify in Mexico?, (3)
plasm bank accession numbers and geographical coordinates.
How is genetic diversity structured in the Mexican
an-SSR genotypes:Ninety-three SSRs that are evenly distributed
nual teosintes?, and (4) Has introgression among spe- throughout the genome were used to genotype all 237 Zea cies or subspecies played a role in teosinte evolution? plants and the two Tripsacum individuals. These SSRs were used in the previous analysis of maize and its wild progenitor
We also define core sets of teosinte accessions that best
(Matsuokaet al.2002b). The plants were genotyped at Celera
capture the diversity of the teosintes.
AgGen (Davis, CA) following procedures published elsewhere (Matsuoka et al. 2002b). See supplementary materials at http://www.genetics.org/supplemental/ for a list of the SSRs, MATERIALS AND METHODS
their repeat type, and their genomic locations.
Diversity analyses:Basic statistics, including the number of Plant materials:We sampled 237 teosinte plants from 172
alleles, observed heterozygosity, gene diversity (or expected accessions representing the entire geographical distribution
heterozygosity), and the number of taxon-specific (private) of teosinte from northern Mexico to western Nicaragua. For each
alleles, were calculated for species, subspecies, and races using accession, 1–5 individuals were assayed. The sample includes 93
Z. maysssp.mexicanaindividuals (69 accessions), 114Z. maysssp. PowerMarker (Liu2002). In these analyses, individual plants of possible hybrid origin as determined by population struc-parviglumis (82 accessions), 7Z. maysssp. huehuetenangensis(3
accessions), 13Z. luxurians(10 accessions), 6Z. diploperennis ture analysis (see below) were excluded.
PHYLIP package (Felsenstein 1993) with the log-trans- vidual from each OTU as a representative. Individual plants of possible hybrid origin as determined by population structure formed proportion-of-shared-alleles distance as implemented
in the computer program Microsat (http://hpgl.stanford.edu/ analysis (see below) were excluded. We calculated the log-trans-formed proportion-of-shared-alleles distance among these in-projects/microsat/). In FITCH, the J option was used to
ran-domize the input order of samples. We constructed three dividuals and used this distance matrix in all tests. We then calculated correlation coefficients between the genetic dis-types of trees: (1) a tree with all individual plants, (2) a tree
with individual plants pooled into operational taxonomic units tance matrix and dispersal and clinal matrices according to
Smouseet al.(1986). The significance of the correlations was (OTUs) on the basis of their geographic origin and position
in the individual tree, and (3) trees rooted withT. zopilotense estimated using matrix permutation tests with 10,000 repli-cates (Dietz1983;Smouseet al.1986).
andT. peruvianum. Data were pooled into 76 OTUs of two to
Population structure analysis:For the analysis of population four individual plants (or five plants in the case ofZ.
diploper-structure and detection of intermediate types (hybrids or an-ennis). Membership of the plants in the 76 OTUs was based
cestral forms), we used a model-based clustering method as on their geographic origin and position in Figure 2 (see
sup-implemented in the software program STRUCTURE (
Pritch-plemental materials at http://genetics.org/supPritch-plemental/).
ardet al.2000). In this analysis, a number of populations (K) Pooling was necessary to reduce the number of entries in the
is assumed to be present and to contribute to the genotypes FITCH analysis to a level at which bootstrap replicates could
of the sampled individuals. The genotype of each individual be analyzed. Data for the two Tripsacum species were pooled
is a function of the allele frequencies in theseKpopulations to create a single synthetic outgroup. This was done because
(clusters) and the proportion of its genotype drawn from each of the high frequency of null phenotypes (“alleles”) for the
of theKpopulations (qk). Loci are assumed to be independent,
SSRs in the single Tripsacum samples. Once pooled, the
syn-and eachKpopulation is assumed to follow Hardy-Weinberg thetic Tripsacum outgroup possessed visible alleles at 61 SSRs
equilibrium. and null phenotypes at the other 32 SSRs. In the trees rooted
A Monte Carlo Markov chain method was used to estimate with Tripsacum, we scored null phenotypes in two ways
be-allele frequencies in each of theKpopulations and the degree cause of the large number of null phenotypes in Tripsacum.
of admixture for each individual plant. In the analyses, we First, all null phenotypes at a locus were scored as the same
did not use any prior information about the geographic origin null allele “0” in both Zea and Tripsacum. Second, null
pheno-of the plants. We used STRUCTURE with 1,000,000 iterations types in teosintes were scored as the allele “0” but as a distinct
and a burn-in period of 30,000. We increased the parameter, null allele “00” in Tripsacum, on the basis of the assumption
ALPHAPROPSD, from 0.05 (the default value) to 0.50 to ex-that these alleles had independent origins. Given the high
plore a wide range of possible values of ALPHA, the degree frequency of nulls in Tripsacum (50% nulls in each individual
of admixture. At least three independent runs were assessed plant), it is highly probable that nulls in Tripsacum are
inde-for each fixed number of populations (K). pendent of nulls in Zea. To determine the degree of statistical
For the analysis of introgression between maize and teosinte, support for different branch points, we evaluated 1000 trees
we used a sample of 52 Mexican maize landraces (Matsuoka
constructed from bootstrap resamplings of the data.
et al.2002b). Separate analyses with maize were made forZ.
Analysis of phylogeography:We tested geographic (clinal)
luxurians, Z. diploperennis, andZ. mays ssp.huehuetenangensis. vs.dispersal models for the current distribution of populations
In each case, we assumed two clusters. We analyzed the ssp. ofZ. maysssp.mexicanaand ssp.parviglumis. In the geographic
parviglumisand ssp.mexicanaplants together with maize (ssp. model, migration occurs on a small scale and populations are
mays), assuming three clusters. We performed this analysis isolated by distance. In this case, genetic distance should be
with the three subspecies together since introgression between correlated with geographical distance between populations.
ssp. mexicana and ssp. parviglumis may also have occurred. In dispersal models, long distance migration is allowed, and
Plants possessing ⬍80% ancestry in their own cluster were two geographically close populations may have been derived
considered to be of possible hybrid origin. For the analysis of from distinct distant founder populations. In this case, genetic
population structure within ssp.mexicanaand ssp.parviglumis, distance will be less correlated with geographical distance than
we used STRUCTURE withK⫽1–6 on each subspecies sepa-with distance along the dispersal routes (dispersal distance).
rately. For all analyses with STRUCTURE, we used only a To test which scenario best fits the distribution of ssp.mexicana
subset of 70 SSRs that had⬍10% null phenotypes (null alleles and ssp.parviglumis, we compared the geographical (clinal) and
or missing data). multiple dispersal distance matrices to the genetic distance
be-Core set :To assist in the management of a large germplasm tween the populations. The Nobogame and Durango
popula-collection, core sets have been defined to represent a large tions, which are geographically very distant, were removed from
proportion of diversity encompassed in the entire collection the analysis to prevent these geographic outliers from having
(Brown1989). Recently, core sets in many crops and their undue weight on the analysis.
relatives have been established (Grenier2000a,b; Oritzet Various dispersal hypotheses were constructed using the
al.1998). To assist in the use of ssp.mexicanaand ssp.parviglumis Phylogeographer 1.0 (Buckler1999). We placed the nodes
germplasm, we defined core sets of accessions that capture the A–F on the map (Figure 4). These nodes correspond to
teo-maximum number of SSR alleles using the Core Set function sinte population centers as follows: A, eastern Balsas region;
in PowerMarker (Liu2002). The method is based on a simulated B, Central Plateau; C, Valley of Mexico; D, Balsas river
drain-annealing algorithm (Liu2003). One-hundred replicates with age; E, southern Guerrero; and F, Jalisco. Each of these centers
different initial subsets were performed. is ecologically relatively homogeneous with respect to altitude,
length of growing season, and annual rainfall, and teosinte populations within each center share morphological similarity
(Wilkes1967;Sanchezet al.1998). Populations within these RESULTS seven centers were connected to their respective nodes (A–F)
as shown in Figure 4. Different dispersal models were then con- Diversity statistics:Observed heterozygosity, gene di-structed by connecting nodes A–F in various ways. Dispersal versity (expected heterozygosity), number of alleles, and distance between two populations for a particular dispersal
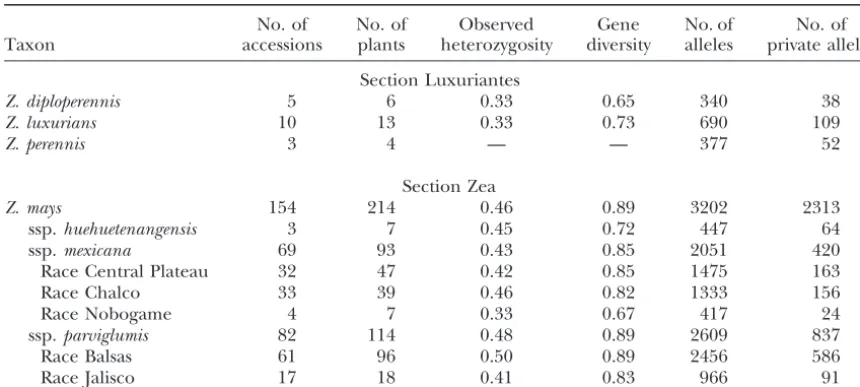
number of private alleles of each taxon are shown in
model is the sum of the distances along paths that connect
Table 1.Z. mayspossesses substantially higher values for
them. Figure 4 shows the dispersal models we tested.
TABLE 1
Diversity statistics for teosinte microsatellites
No. of No. of Observed Gene No. of No. of
Taxon accessions plants heterozygosity diversity alleles private alleles
Section Luxuriantes
Z. diploperennis 5 6 0.33 0.65 340 38
Z. luxurians 10 13 0.33 0.73 690 109
Z. perennis 3 4 — — 377 52
Section Zea
Z. mays 154 214 0.46 0.89 3202 2313
ssp.huehuetenangensis 3 7 0.45 0.72 447 64
ssp.mexicana 69 93 0.43 0.85 2051 420
Race Central Plateau 32 47 0.42 0.85 1475 163
Race Chalco 33 39 0.46 0.82 1333 156
Race Nobogame 4 7 0.33 0.67 417 24
ssp.parviglumis 82 114 0.48 0.89 2609 837
Race Balsas 61 96 0.50 0.89 2456 586
Race Jalisco 17 18 0.41 0.83 966 91
Gene diversity and observed heterozygosity were calculated as the average over plants for a taxon.
species (Z. luxuriansandZ. diploperennis). WithinZ. mays structure analysis and accordingly are marked with a large H in Figure 2. Four of the six individuals of the (sensu lato), ssp.huehuetenangensispossesses a lower gene
diversity value than either ssp.parviglumisor ssp.mexicana. eastern Balsas geographic group of ssp.parviglumiswere identified as putative hybrids, containing ⬎20% ssp. Subspecies parviglumispossesses slightly greater gene
di-versity than ssp.mexicana; however, it possesses twice as mexicanaancestry.
Within ssp. mexicana, there is clear geographic pat-many “private alleles” despite roughly equivalent
sam-ples of each. Among the races of ssp. parviglumisand terning of the individuals within Figure 2. Plants from Durango, Nobogame, the Valley of Mexico (Chalco), and ssp. mexicana, Nobogame is the least diverse. Overall,
the taxa with narrow geographic distributions (Z. luxuri- Puebla mostly cluster near other plants of the same geo-graphic origin. However, plants from the Central Plateau ans,Z. diploperennis, ssp.huehuetenangensis, and race
No-bogame) show the least diversity, and the broadly distrib- are dispersed throughout the ssp.mexicanaclade. Within ssp.parviglumis, plants from Jalisco, Oaxaca, and south-uted ssp.parviglumisis the most diverse taxon.
For all taxa, observed heterozygosity is substantially ern Guerrero mostly cluster near other plants of the same geographic origin. Plants from the Central Balsas lower than gene diversity (expected heterozygosity),
al-though under Hardy-Weinberg expectations these val- area are more dispersed with plants from the eastern portion of the Central Balsas region separated from ues should be the same. This discrepancy may arise for
several reasons: (1) failure of one allele to amplify dur- those of the western portion. As mentioned above, plants from the eastern Balsas region occur either near ing PCR reactions (so-called “allele drop-out”), (2)
pop-ulation structure, and (3) inbreeding during seed in- or within the ssp.mexicanaclade.
To further assess the phylogenetic affinities within crease in germplasm banks.
Phylogeny:A phylogenetic tree of all 237 individuals Zea, we constructed a Fitch-Margoliash tree (Figure 3) for pooled groups (OTUs) of two to four individual was constructed using the Fitch-Margoliash method
(Figure 2). In this tree, individuals that are putative plants (or five plants in the case of Z. diploperennis). Membership of the plants in the 76 OTUs was based hybrids between taxa as shown by population structure
analysis (see below) are marked with a large “H.” The on their geographic origin and position in Figure 2 (see supplemental materials at http://genetics.org/supple tree shows that the individual plants of any given species
form a monophyletic group, if one excludes one Z. mental/). In this tree, there is strong support from the bootstrap procedure for the monophyly ofZ. luxurians diploperennis plant of apparent hybrid origin. The two
perennial species (Z. diploperennisand Z. perennis) are (100%), ssp. huehuetenangensis (100%), and ssp. mexi-cana(98%). The two perennial species,Z. diploperennis sisters, andZ. luxuriansis sister to them. WithinZ. mays,
ssp.huehuetenangensisis monophyletic and sister to the andZ. perennis, are also well supported as a monophy-letic group (99.5%).Z. maysssp.parviglumisis paraphy-other two subspecies. Individuals of ssp. mexicanaand
ssp.parviglumisare largely but not completely separated. letic as the eastern Balsas group of this subspecies is basal to ssp.mexicana. Since the eastern Balsas group is All individuals that failed to cluster with their own
Figure 2.—Unrooted phylogeny of individual teosinte plants using the Fitch-Margoliash method and the log-transformed proportion of shared-allele distance among 93 microsatellite loci. The tree contains 237 individuals. A large H indicates plants identified as being of putative hybrid origin by population structure analysis.Z. mays ssp.parviglumis: (B) Central Balsas, (E) eastern Balsas, ( J) Jalisco, (O) Oaxaca, (S) South Guerrero.Z. maysssp.mexicana: (C) Central Plateau, (H) Chalco, (D) Durango, (N) Nobogame, (P) Puebla. (U)Z. maysssp.huehuetenangensis, (Xg)Z. luxurians(Guatemala), (Xn)Z. luxurians(Nicaragua), (R)Z. diploperennis, (Z)Z. perennis.
phylogeny after excluding this OTU, in which case ssp. proximity. Only one placement is inconsistent with ge-ography, namely the position of the southern Guerrero parviglumisis monophyletic, but has only 46% bootstrap
support as such. OTU (parsog01) within the Central Balsas clade. Many
of the basal branches are short within the ssp.parviglumis Figure 3 reveals strong geographic patterning of the
OTUs within ssp. parviglumis. Excluding eastern Balsas, clade and few branch points have strong bootstrap sup-port; however, the consistency of the clades with geogra-which is basal to ssp.mexicana, OTUs from the eastern
portion of the Central Balsas region (parcbl01–parcbl07) phy suggest that many of the observed relationships likely reflect the history of populations within this sub-are the basal-most samples within this subspecies. Nested
within these OTUs is a clade composed of southern species.
Geographic patterning of OTUs is also seen within Guerrero OTUs plus the Oaxaca OTU, suggesting that
the latter groups were derived from the populations ssp. mexicana(Figure 3). There is a basal split of this subspecies with OTUs from the Central Plateau geo-of the eastern Central Balsas. OTUs from the western
portion of the Central Balsas region (parcbl08– graphic region falling in both clades. One clade con-tains the Nobogame geographic group along with OTUs parcbl23) are derived from those of the eastern portion.
Durango geographic group clusters with OTU centp05 through areas B–F and shows migrations from the west along two paths.
from the core region of Central Plateau populations.
OTU centp01 of race Central Plateau, which grows at The correlation coefficient between geographic (clinal model) and genetic distance is 0.28 (P⬍0.001), the highest elevation (2300 m) for this race, is basal to
race Chalco, which grows at elevations ofⵑ2300 m and indicating a significant relationship between these dis-tance measures (Table 2). However, the correlation co-higher in the Valley of Mexico. The Puebla geographic
group, which lies to the east of the Valley of Mexico, is efficients between dispersal and genetic distance for the different dispersal models are all higher. Model 1 shows nested within the race Chalco of the Valley of Mexico
(see Figure 1). The position of OTU centp14 from Jali- the highest correlation of the models tested (0.49;P⬍ 0.001). The partial correlation between geographic and sco is exceptional in that it is within the Chalco group
from the Valley of Mexico and may represent a case genetic distance, while the dispersal distance for model 1 is held constant, is ⫺0.032 (P ⬎ 0.81); the partial of long-distance dispersal. Bootstrap support for most
clades within ssp.mexicanais generally weak, although correlation between model 1 dispersal and genetic dis-tance, while geographic distance is held constant, is 0.42 the Nobogame (98%) and Puebla (99%) clades are
strongly supported. (P⬍0.001). These results indicate that dispersal model 1 explains considerable variation that is not explained An interesting question for Zea systematics is the
placement of the root of phylogeny for the genus. We by the clinal model (or by most other dispersal models), while essentially all the variation explained by the clinal rooted the Zea OTU tree using Tripsacum (Figure 3).
When nulls in Zea and Tripsacum were treated as the model is also explained by the dispersal model. Population structure: Hybridization with maize: Teo-same allele (identical by descent), the root was placed
betweenZ. luxuriansand the perennial species such that sinte grows near maize in most locations and is capable of hybridizing with maize, allowing admixture between Z. luxurianswas basal toZ. mays; however, this rooting
was found in only 35% of the bootstrap samples. When maize and the teosintes to occur. To measure the degree of admixture, we performed population structure analy-nulls in Zea and Tripsacum were treated as distinct
alleles (nonidentical by descent), the root was placed sis using the software program STRUCTURE ( Pritch-ard et al. 2000). Z. luxurians, Z. diploperennis, and Z. between section Luxuriantes (the perennial species and
Z. luxurians) and section Zea (Z. mays). This rooting has maysssp.huehuetenangensiswere analyzed separately with maize, assuming two clusters in each analysis. The results stronger support (61%); however, it is not statistically
robust. indicate that all plants ofZ. luxuriansand ssp.
huehueten-angensishave a high membership in their own cluster Phylogeography of ssp.mexicanaand ssp.parviglumis:
We compared multiple dispersal models against a clinal (⬎99%) with maize contributing⬍1% to their ancestry. This result argues that there has been little or no gene model for the geographic distribution of the Mexican
annual teosintes (ssp.mexicanaand ssp.parviglumis) to flow from maize into these teosintes, although different plant samples may produce different results. In contrast, determine which model best explains the observed
pat-tern of extant variation (Figure 4). Models (1–10 in only five of six plants ofZ. diploperennisshowed a high membership (⬎99%) in their own cluster, and one Figure 4) were chosen to test different linkages between
the two subspecies as well as different linkages between plant ofZ. diploperennis(DPCUA01) showed only 77% membership in its own cluster plus 23% membership the four population centers for ssp.parviglumis. Model
1 connects ssp.parviglumisthrough the eastern Balsas in the maize cluster. The plant is likely a maize-diploper-ennis hybrid or an introgressant.
region to ssp. mexicana through a point between the
Central Plateau and Chalco regions. Models 5, 6, 7, and To test for admixture between maize, ssp.parviglumis, and ssp.mexicana, these three taxa were evaluated to-8 are variants of this connection. Models 5, 6, and 7
could be envisioned as showing an origin in the south gether in a single analysis that assumed three clusters. Z. maysssp.mexicanaand ssp.maysshowed average mem-(area E) and migration along two paths to the north.
Models 2, 3, and 4 are all variants of a connection be- bership in their expected clusters of 92% and 96%, respectively, indicating that these taxa maintain distinct tween ssp.parviglumisto ssp.mexicanathrough the
cen-tral Balsas area (D). Model 9 connects the subspecies gene pools despite growing sympatrically. Z. mays ssp. parviglumisshowed an ancestry in its own cluster of only through areas C–E and shows migrations out of the
south along two paths. Model 10 connects the subspecies 68%, the majority of its remaining ancestry (27%) being
Figure 4.—Dispersal models for 63 OTUs of Z. mays ssp. mexicana and ssp. parviglumis. Gray circles indicate nodes of the tree, which are la-beled A–F. Model 1 shows the highest correlation with genetic distance.
attributed to the maize cluster. This result suggests some region have a high membership in the spp.mexicana clus-ter: PREBL3b (28%), PREBL4a (64%), PREBL3a (38%), degree of admixture between spp.maysand ssp.
parvi-glumis; however, it may also be a function of the recent and PREBL4b (74%). Moreover, both of the remaining two plants had 19% ancestry in the ssp.mexicanacluster. divergence between these two taxa such that their gene
pools are not yet completely differentiated. These results suggest that the eastern Balsas ssp.parviglumis represent eithermexicana-parviglumis hybrids or perhaps Examination of the STUCTURE results for individual
plants identifies some putative hybrids. Seven ssp.mexi- an evolutionarily intermediate form between these two subspecies. Three other ssp.parviglumisplants have high canaplants have⬎20% membership in the maize
clus-ter: MXCEN3 (21%), MXCEN5b (33%), MXCHA9 (23%), membership in the ssp.mexicanacluster: PRJAL17 (34%), PRCBL03c (39%), and PRCBL45c (92%).
MXCHA13a (23%), MXCHA16a (55%), MXPUE3 (26%),
and MXPUE4 (28%). Three ssp.mexicanaplants have sub- When the populations were plotted on a map, the results of the structure analysis reveal some geographic stantial membership in the ssp. parviglumis cluster, all of
them from race Central Plateau: MXCEN4b (34%), trends (Figure 5). First, the ssp. mexicanapopulations that show admixture with maize are all from the eastern MXCEN22 (22%), and MXCEN23 (33%). One ssp.
mexi-canaplant (MXCEN19d) has 99% membership in ssp. portion of the ssp.mexicanarange (the eastern Central Plateau, Valley of Mexico, and Puebla). Second, the parviglumisand may represent a mislabeled individual.
TABLE 2 each core set is equivalent to that found in the entire sample (Tables 1 and 4). Each core set contains a
num-Correlations (r) between geographic or dispersal and
ber of accessions from different geographic groups that
genetic (SSR) distance matrices
are proportional to the number of accessions for the different geographic groups in the entire sample, as
Model r Modelx|modely r
revealed by nonsignificant goodness-of-fit tests (data not
Geographic 0.283 Geographic|model 1 ⫺0.032
shown).
1 0.493 Model 1|geographic 0.423
2 0.390 Model 2|geographic 0.287
3 0.365 Model 3|geographic 0.243 DISCUSSION
4 0.422 Model 4|geographic 0.327
5 0.431 Model 5|geographic 0.351 Diversity: Estimates of gene diversity were high for
6 0.454 Model 6|geographic 0.378 all taxa, reflecting the highly polymorphic nature of 7 0.427 Model 7|geographic 0.336 SSRs. The gene diversity values reported here for the
8 0.464 Model 8|geographic 0.384
teosintes exceed those that we have previously observed
9 0.429 Model 9|geographic 0.349
(Matsuokaet al.2002a). The reasons for this difference
10 0.435 Model 10|geographic 0.384
likely are that we used mostly dinucleotide repeat loci
Models 1–10 are shown in Figure 4. The geographic model in the present study, whereas in our previous study we is the matrix of geographic or linear distances between the
used mostly trinucleotide repeat loci (Matsuokaet al. populations. Modelx|modelyindicates the partial correlation
2002a), and the fact that dinucleotide loci have a higher
of modelxwith genetic distance when modelyis held constant.
mutation rate (Vigourouxet al.2002). If one considers relative diversity among taxa, then it is apparent that those taxa with very narrow geographic distributions parviglumis are from the western portion of the ssp.
mexicanarange. Third, four of the seven ssp.parviglumis exhibit lower gene diversity than taxa with broad geo-graphic distributions (Table 1, Figure 1). The lowest plants that show admixture with ssp.mexicanaare from
the eastern Balsas region, which is situated near the ssp. value (0.67) is found for race Nobogame, which occurs in a single valley in the state of Chihuahua.Z. diploper-mexicanapopulations of the Valley of Mexico, suggesting
an opportunity for hybridization. ennis, which exists in only a few local populations on the Sierra de Manatla´n of Jalisco, also has a very low Population substructure: Both Z. mays ssp. parviglumis
and ssp. mexicana are broadly distributed throughout value (0.69). Z. luxurians (0.73) and Z. mays ssp. hue-huetenangensis(0.72) exhibit the next highest values.Z. Mexico, raising the question of whether they behave as
a single Hardy-Weinberg population or exhibit some mays ssp. huehuetenangensis exists in multiple popula-tions, but all are within a single province of Guatemala. degree of geographic substructuring. To address this
question, we performed population structure analysis Similarly,Z. luxuriansis known mostly from a restricted region of southeastern Guatemala, although it has out-using the software program STRUCTURE (Pritchard
et al.2000). For ssp.parviglumis, the highest likelihood lier populations in Honduras and Nicaragua. The taxa that exhibit the highest gene diversity (races Balsas and was obtained forK⫽2 clusters of plants, dividing this
subspecies into a group of 32 plants that come largely Central Plateau) have very broad geographic distribu-tions. This overall pattern suggests that small population from the eastern part of its range (Balsas) and a group
of 18 plants that come largely from the western part size or bottlenecks associated with the founding of the narrowly distributed taxa have caused the observed re-( Jalisco) re-(Table 3; supplemental materials at http://
genetics.org/supplemental/). Twenty-eight plants were ductions in gene diversity.
A comparison of ssp.mexicanaand ssp.parviglumis indi-intermediate between these two groups. For ssp.
mexi-cana, the highest likelihood was obtained for K ⫽ 3 cates that the latter subspecies is more diverse with a slightly higher gene diversity and a far greater number of clusters of plants. One cluster includes the Nobogame
region and allied plants from the Central Plateau, an- private alleles. Examination of Figure 3 also shows that branch lengths appear shorter for ssp. parviglumis than other includes the Chalco-Puebla regions and their
al-lied plants from the Central Plateau, and the third con- for ssp. mexicana, especially for the internal branches within the clades. Since changes in allele frequency due tains other plants of the Central Plateau and the
Durango regions. Only two plants were intermediate to genetic drift contribute substantially to genetic dis-tance (branch length), the longer internal branches for among these three groups.
Core sets:We have analyzed a large number of acces- ssp.mexicanamight reflect smaller local population sizes and repeated founder events. Under these circum-sions (172). For some other bioassays, researchers may
need to reduce the number of samples utilized because stances, rare (private) alleles would be readily lost, ac-counting for the substantially smaller number of private of time-cost considerations. We have selected core sets
of accessions for ssp.mexicanaand ssp.parviglumisthat alleles observed in ssp. mexicana. Consistent with the idea that ssp.mexicanapopulations are smaller or experi-capture the maximum number of SSR alleles for sample
Figure5.—Results of the population structure analysis for ssp.mexicana(squares) and ssp.parviglumis(circles). The symbols for plants of apparent mixed ancestry based on the arbitrary criterion of possessing⬍80% membership in their own subspecies are enlarged. For the enlarged symbols, the symbol is color coded proportionally to its degree of ancestry from ssp.mexicana (red), ssp.parviglumis(green), and ssp.mays(yellow).
show that GST, a measure of population subdivision, is consistent with the placement of the root for Zea between 0.29 in race Central Plateau (ssp.mexicana) as compared the perennials andZ. luxurians such that Z. luxuriansis to 0.16 in race Balsas (ssp.parviglumis) (Doebleyet al. basal toZ. mays(BucklerandHoltsford1996).
How-1984). ever, this rooting is less well supported than the rooting
Phylogeny:Our analyses present the first comprehen- of Zea between sections Luxuriantes and Zea.
sive phylogeny for Zea using a large number of nuclear In our phylogeny, the two perennial species are sister markers. Despite this large number and comprehensive taxa (Figure 3), supporting the interpretation that Z. sampling, many of the branch points within the tree perennisis an autotetraploid derived from a Z. diploper-have little statistical support. Thus, we present only a ennis-like ancestor (Doebley et al. 1987; Kato and phylogenetic hypothesis that will require verification or Lopez 1990). Our phylogeny also indicates that ssp. revision in the future. Our most strongly supported root huehuetenangensisis basal to the Mexican annual teosintes within Zea suggests an initial division of the genus into (ssp.mexicanaand ssp.parviglumis), which is in agree-section Luxuriantes (Z. perennis,Z. diploperennis, andZ. ment with rDNA sequences (BucklerandHoltsford
luxurians) and section Zea (Z. mays sensu lato) (Figure 1996). The subspeciesmexicanais derived from within 3). This rooting results when null alleles in Zea and ssp.parviglumis, rendering the latter subspecies paraphy-Tripsacum are treated as nonidentical by descent. This letic (Figure 3).
assumption seem reasonable since the high frequency The paraphyly of ssp. parviglumis hinges upon the of nulls in Tripsacum (50% in each Tripsacum sample) status of the eastern Balsas populations, which appear suggests a high probability of multiple independent ori- intermediate between the two subspecies in Figure 2. gins of nulls. This rooting of Zea is consistent with a We consider two interpretations:
cpDNA phylogeny that has very strong statistical support
1. If the eastern Balsas populations are interpreted as (Doebleyet al.1984). If one treats the nulls in Zea and
TABLE 3
Population structure groups for the Mexican annual teosintes
Cluster Members
Z. maysssp. mexicana
Central Plateau MXCEN05a, MXCEN06, MXCEN07, MXCEN08, MXCEN09, MXCEN10, MXCEN11, MXCEN12, MXCEN13, MXCEN14c, MXCEN15b, MXCEN16, MXCEN17, MXCEN18c, MXCEN19, MXDUR01a, MXDUR02, MXDUR03, MXDUR04
Chalco MXCEN01, MXCEN02b, MXCEN28b, MXCHA01, MXCHA02, MXCHA03,
MXCHA04, MXCHA05, MXCHA06, MXCHA10, MXCHA11, MXCHA12b, MXCHA13, MXCHA14, MXCHA15, MXCHA16b, MXCHA17, MXCHA18, MXCHA19a, MXCHA20, MXCHA21, MXCHA22, MXCHA23, MXCHA24, MXCHA25, MXCHA28, MXCHA29b, MXCHA30, MXCHA32, MXCHA33, MXCHA34, MXCHA7, MXCHA9
Nobogame MXCEN04a, MXCEN20, MXCEN21, MXCEN25, MXCEN26, MXCEN27d, MXCEN29, MXNOB01a, MXNOB02, MXNOB03c, MXNOB04
Intermediate MXCEN04a, MXCEN29
Z. maysssp. parviglumis
Balsas PRCBL01, PRCBL02a, PRCBL03, PRCBL04a, PRCBL05, PRCBL07d, PRCBL09a, PRCBL11, PRCBL12, PRCBL19, PRCBL20, PRCBL23, PRCBL24, PRCBL25, PRCBL29, PRCBL34, PRCBL36, PRCBL48, PROAX01, PROAX02, PRSOG01, PRSOG02, PRSOG03, PRSOG04a, PRSOG05, PRSOG06, PRSOG07d, PRSOG08, PRSOG09, PRSOG10b, PRSOG11, PRSOG12
Jalisco PRCBL42, PRCBL44, PRCBL51, PRJAL01, PRJAL02, PRJAL03, PRJAL04, PRJAL05, PRJAL06a, PRJAL07, PRJAL08, PRJAL09, PRJAL10, PRJAL12, PRJAL14, PRJAL15b, PRJAL16, PRJAL17
Intermediate PRCBL06, PRCBL08, PRCBL10c, PRCBL13, PRCBL14, PRCBL15, PRCBL16b, PRCBL17, PRCBL26b, PRCBL27, PRCBL28, PRCBL30, PRCBL31, PRCBL32, PRCBL33, PRCBL35, PRCBL37, PRCBL38, PRCBL39, PRCBL40, PRCBL41, PRCBL43b, PRCBL45a, PRCBL46c, PRCBL47, PRCBL50, PRJAL11, PRSOG13
would be monophyletic. The population structure ture or introgression) for a sample (Pritchard et al. analysis is consistent with this interpretation since it 2000). This analysis fits a model that minimizes both identified four of six eastern Balsas plants as being Hardy-Weinberg and linkage disequilibrium within clus-admixed between ssp.parviglumisand ssp.mexicana, ters. We used this analysis to identify the degree of and the remaining two plants are both estimated to admixture between each of the teosinte taxa and maize. possess nearly 20% ssp. mexicana germplasm. Geo- We found no evidence for gene flow or admixture be-graphically, the eastern Balsas populations are in be- tweenZ. luxuriansor ssp.huehuetenangensisand maize. tween the Chalco populations of ssp. mexicanaand This result is consistent with prior field observations the central Balsas population of ssp.parviglumis, so that these taxa rarely hybridize with maize or that their an opportunity for hybridization exists. hybrids with maize are restricted to plants that invade 2. If the eastern Balsas populations are interpreted as maize fields (Wilkes 1977). We did identify one Z. the ancestral population out of which ssp.parviglumis diploperennis plant that appears to be admixed with and ssp.mexicanawere derived, then ssp.parviglumis maize. This observation is congruent with previous re-would be paraphyletic. In this case, the STRUCTURE ports from isozymes (Doebleyet al. 1984) and rDNA analysis erroneously identifies eastern Balsas plants (Buckler and Holtsford1996). It is also consistent asparviglumis-mexicanaadmixtures when in fact they with field observations thatZ. diploperennis grows near represent the basal (intermediate) population from maize fields and occasionally forms hybrids with maize which both ssp.mexicanaand other ssp. parviglumis (Benzet al.1990).
were derived. If this interpretation is correct, then Subspecies mexicanais the teosinte that grows most themexicana-parviglumisancestor grew at the middle commonly in maize fields and has been observed to elevations (ⵑ1700 m) and spread from there to both hybridize readily with maize (Wilkes 1977). In some lower elevations (most ssp.parviglumis) and higher fields, upwards of 10% of “teosinte” plants are actually elevations (ssp.mexicana). maize-teosinte hybrids (Wilkes 1967). Despite this
re-cord of hybridization, the STRUCTURE analysis indi-Introgression:We performed a model-based analysis
cates that maize and ssp. mexicana have very distinct of population structure that allows one to infer both
gene pools with an estimate of only 8% of the ssp. the number of populations (clusters) and the degree of
TABLE 4 by allele presence/absence. An interesting fact is that two of these three ssp. mexicanaplants with ssp.
parvi-Core set accessions of ssp.mexicanaand ssp.parviglumis
glumisadmixture occur at the low elevation (1520 and 1625 m) typical of ssp.parviglumis.
Z. maysssp.parviglumis Z. maysssp.mexicana
Of 117 ssp. parviglumisplants, 56 were identified by
Core set of 12 Core set of 25 Core set of 12 Core set of 25 the STRUCTURE analysis as being admixed with maize
(i.e., possessing 20% or more maize germplasm). Rather
PRCBL07 PRCBL07 MXCEN14 MXCEN05
PRCBL09 PRCBL09 MXCEN15 MXCEN06 than introgression, this result likely reflects the recent
PRCBL11 PRCBL14 MXCEN20 MXCEN10 origin of maize from ssp. parviglumis such that their PRCBL16 PRCBL16 MXCEN27 MXCEN14 gene pools have not yet fully differentiated. We suggest
PRCBL34 PRCBL17 MXCHA02 MXCEN15
recent origin rather than admixture since ssp.
parvi-PRCBL44 PRCBL18 MXCHA13 MXCEN16
glumis (1) is known as the most “pure, wild” teosinte,
PRCBL45 PRCBL32 MXCHA15 MXCEN20
(2) frequently grows in natural settings apart from maize
PRCBL46 PRCBL33 MXCHA18 MXCEN24
fields, and (3) does not commonly hybridize with maize
PRCBL48 PRCBL34 MXCHA27 MXCEN27
PRJAL16 PRCBL37 MXDUR04 MXCHA02 (Wilkes1977). An additional 7 ssp.parviglumisplants
PROAX02 PRCBL41 MXNOB04 MXCHA11 were identified as admixed with ssp.mexicana. Four of PRSOG09 PRCBL44 MXPUE1 MXCHA13 these are from the eastern Balsas region and may
repre-PRCBL45 MXCHA15
sent eitherparviglumis-mexicanaintrogressants or
evolu-PRCBL46 MXCHA17
tionary intermediates as discussed above. Another ssp.
PRCBL48 MXCHA18
parviglumisplant (PRCBL45c) was assessed as possessing
PRCBL50 MXCHA21
PRCBL51 MXCHA22 92% ssp.mexicana germplasm. This plant comes from
PREBL01 MXCHA23 a population located near race Central Plateau
popula-PRJAL01 MXCHA24 tions of ssp.mexicana. Two other plants from this
popula-PRJAL08 MXCHA27
tion also showed relatively high admixture with ssp.
mexi-PRJAL16 MXDUR04
cana(PRCBL45b at 14% and PRCBL45d at 19%). Given
PROAX02 MXNOB01
the geographic location of these plants near the Central
PRSOG04 MXNOB03
Plateau and these STRUCTURE results, it seems
possi-PRSOG09 MXNOB04
PRSOG10 MXPUE1 ble that this population possesses a mixture of
mexicana-parviglumis germplasm. Another ssp. parviglumis plant
GD⫽0.898 GD⫽0.895 GD⫽0.868 GD⫽0.856 (PRJAL17) with 34% ssp.mexicanaancestry was
identi-fied in Jalisco. This Jaliscan population is isolated from
GD, gene diversity.
ssp.mexicana, and all other Jalisco populations showed quite low percentages of ssp.mexicanagenome (⬍2%). mexicana plant (MXCHA16a) was identified as pos- The origin of this intermediate type could be due to sessing 55% maize ancestry and may be a maize-teosinte long-distance dispersal.
F1. Six others haveⵑ25% maize, suggesting that some Phylogeography: The phylogeographic analysis indi-of these may represent BC1’s. If these putative F1 and cates that dispersal model 1 fits the distribution of popu-BC1 plants are excluded, then ssp. mexicana has only lations of the Mexican annual teosintes better than a
ⵑ4% membership in the maize cluster. Genetic barriers clinal model does. This dispersal model shows a linkage to gene flow may be blocking the more complete ho- between ssp.mexicanaandparviglumisthrough the east-mogenization of the maize and ssp.mexicanagene pools ern Balsas region (the mountains of Ixcateopan; node where they grow sympatrically (Evans and Kermicle A in Figure 4). From the eastern Balsas, ssp.parviglumis
2001). diversifies in the central Balsas region (node D) and
Three ssp.mexicanaplants, all from the Central Pla- spreads from there along one path into southern Guer-teau, were identified as being admixed with ssp. parvi- rero (node E, Mazatla´n and El Salado) and Oaxaca, glumis. This observation is difficult to explain, given and along a second path into Jalisco (node F). The that these two subspecies do not grow sympatrically. We subspecies mexicana radiates out of a point between consider three possible explanations: (1) there is long- nodes B and C, spreading along one path to the Valley distance dispersal from ssp.parviglumisto ssp.mexicana of Mexico (node C, Chalco) and Puebla, and along a populations; (2) the STRUCTURE analysis may erron- second path into the Central Plateau through node B. eously attribute admixture with maize to admixture with This phylogeographic model and our phylogenies ssp.parviglumis; or (3) the gene pools of the two subspe- have several implications (Figures 2 and 3):
cies are too recently diverged to be fully differentiated.
1. Subspeciesparviglumisoriginated in the eastern Balsas The first explanation seems unlikely but cannot be
dis-region since populations of this dis-region are basal to counted. The latter two explanations seem more likely,
other ssp.parviglumispopulations (Figure 2). given that the gene pools of ssp. mexicana, ssp.
(ⵑ1500–1800 m) and then diversified into the lower wetter lower elevations in the river valleys of southern and western Mexico mostly below 1800 m (Wilkes1967; elevations.
IltisandDoebley 1980;Doebley1983). Z. maysssp. 3. The ssp.mexicanapopulations from the northwestern
mexicanaoften has red, hairy leaf sheaths, whileZ. mays part of the Central Plateau may represent the
found-ssp.parviglumispossesses mostly green and glabrous leaf ing populations of this subspecies as shown in Figures
sheaths.Z. maysssp.mexicanatypically has larger seed, 2 and 3. Interestingly, the STRUCTURE analysis
indi-larger male spikelets, and few tassel branches as com-cated that these populations showⵑ7% admixture
pared to ssp.parviglumis. As shown in Figures 2 and 3, with ssp. parviglumis as compared to 2% for other
the SSR data are consistent with this ecological division, ssp.mexicanapopulations. However, rather than
ad-although the ssp.parviglumispopulations of the eastern mixture, STRUCTURE may be detecting an ancestral
Balsas region are intermediate. What are the implica-similarity between the gene pools of the ssp.
parvi-tions of these intermediate populaparvi-tions from a taxo-glumisand the ssp.mexicanapopulations of the
north-nomic perspective? western Central Plateau.
4. Despite their proximity and status as the two
north-1. If they aremexicana-parviglumishybrids as discussed ern-most populations, Nobogame and Durango
actu-above, then the taxonomic division is secure and ally represent independent colonizations of
north-it is not surprising that subspecies form occasional ern Mexico that were derived from distinct ancestral
hybrid populations. populations in the Central Plateau.
2. If they are evolutionarily intermediate populations, 5. Other recent long-distance dispersal events, such as
as discussed above, then ssp. parviglumis would be the movement of a race Chalco type from the Valley
paraphyletic, but it is already a paraphyletic taxon of Mexico to Puebla, may have occurred. Birds or
since ssp.mayswas derived from within it. Moreover, humans might be the vectors for such events.
theparviglumis-mexicanadivision would still provide a useful taxonomic division of the Mexican annual Taxonomy:A taxonomy should provide a useful tool
teosintes into the upland and lowland forms. for field biologists while reflecting the phylogenetic
his-tory of the taxa as accurately as possible. The results Recently, Iltis and Benz (2000) described a new reported here generally fit the taxonomy of Zea devel- species of Zea from Nicaragua,Z. nicaraguensis. These oped by Iltis and Doebley (Doebley and Iltis 1980; authors noted that Z. nicaraguensis is similar to and
Iltisand Doebley 1980; Doebley 1990b). However, closely allied withZ. luxurians. Our data confirm their there are a few ambiguities worthy of discussion. observation that Z. nicaraguensis and Z. luxurians are
Doebley and Iltis (1980) divided the genus into closely related. Their evidence that it represents a new section Luxuriantes (Z. diploperennis,Z. perennis, andZ. species is based on differences in ecology and tassel and luxurians) and section Zea (Z. mays). Our best-supported plant morphology. Our data indicate that Z. nicara-phylogeny and a strongly supported cpDNA-based phy- guensisis not strongly differentiated from Z. luxurians logeny (Doebley et al. 1987) are consistent with this by SSR data. In Figure 2, our three samples ofZ. nicara-division, but the SSR phylogeny lacks robust statistical guensisare all nested withinZ. luxuriansand the branch support. If further data demonstrate that the root of length between these samples and samples ofZ. luxuri-Zea lies between the perennial and annual species, as ans are not particularly long. The status of Z. nicara-suggested by Buckler and Holtsford (1996), then guensisshould be investigated by determining its cross-section Luxuriantes would be paraphyletic. Although compatibility withZ. luxurians. If they are interfertile, paraphyletic, the section Luxuriantes/section Zea split then it would be best to treatZ. nicaraguensisas a subspe-would remain a reasonable division of Zea since mem- cies ofZ. luxurians.
bers of each section share a suite of morphological and Core sets of collections: We employed a method genetic features (Doebley 1990b). Other than its an- based on a simulated annealing algorithm (Liu2003) nual habit,Z. luxurianshas little, if anything, in common to choose core sets of 12 and 25 accessions for both ssp. with Z. mays. Paraphyletic taxa are commonly used in mexicanaand ssp.parviglumisto maximize SSR diversity. taxonomy, since requiring all taxa to be strictly mono- This algorithm improves upon previously proposed al-phyletic would lead to the creation of absurd taxa of no gorithms by avoiding local maxima during the search utility to field biologists. Zea already possesses one other for the global maximum (Liu2003). The core sets that paraphyletic taxa, ssp.parviglumis, since ssp.maysis nested we defined cover broad geographic distributions of the
within it. Mexican annual teosintes. For applications such as SNP
Iltis andDoebley(1980) divided the Mexican an- discovery or capturing the maximum amount of allelic nual teosintes into two subspecies on the basis of ecology diversity for quantitative genetic analyses, these core and inflorescence morphology. Z. mays ssp. mexicana sets or similar ones should prove useful when available grows in the cooler, drier central highlands mostly above resources do not allow the assay of a larger number of
non-random procedures. B. Using molecular markers. Theor. We thank Hugh Iltis who provided many of the seeds for this
Appl. Genet.101:197–202. study, Jerry Kermicle for comments on the manuscript, and Korise
Iltis, H. H., andB. F. Benz, 2000 Zea nicaraguensis(Poaceae), a
Rasmusson for help with manuscript preparation. This work was
sup-new teosinte from Pacific coastal Nicaragua. Novon10:382–390. ported by National Science Foundation grant DBI-0096033. Iltis, H. H., andJ. F. Doebley, 1980 Taxonomy ofZea(Gramineae). II. Subspecific categories in theZea mayscomplex and a generic synopsis. Am. J. Bot.67:994–997.
Jaenicke-Despre´s, V., E. S. Buckler, B. D. Smith, M. T. P. Gilbert,
A. Cooperet al., 2003 Early allelic selection in maize as revealed
LITERATURE CITED by ancient DNA. Science302:1206–1208.
Kato, T. A., and A. R. Lopez, 1990 Chromosome knobs of the
Benz, B. F., L. R. Sa´nchez-Vela´squezandF. J. Santana-Michel,
perennial teosintes. Maydica35:125–141. 1990 Ecology and ethnobotany ofZea diploperennis: preliminary
Liu, K., 2002 PowerMarker: a powerful software for marker data
investigations. Maydica35:85–98.
analysis. http://www.powermarker.net.
Brown, A. H. D., 1989 Core collections: a practical approach to
Liu, K., 2003 Software and methods for analysing molecular genetic
genetic resource management. Genome31:818–824.
marker data. Ph.D. Thesis, North Carolina State University,
Ra-Buckler, E. S., IV, 1999 Phylogeographer: A tool for developing and
leigh, NC.
testing phylogeographic hypotheses. http://www.maizegenetics.net/ Lukens, L. N., andJ. F. Doebley, 1999 Epistatic and environmental bioinformatics/phyloindex.htm. interactions for quantitative trait loci involved in maize evolution.
Buckler, E. S., IV, andT. P. Holtsford, 1996 Zea systematics: Genet. Res.74:291–302.
ribosomal ITS evidence. Mol. Biol. Evol.13:612–622. Matsuoka, Y., S. E. Mitchell, S. Kresovich, M. M. Goodmanand
Dietz, E. J., 1983 Permutation tests for association between two J. F. Doebley, 2002a Microsatellites inZea—variability, patterns
distance matrices. Syst. Zool.32:21–26. of mutations, and use for evolutionary studies. Theor. Appl.
Doebley, J. F., 1983 The maize and teosinte male inflorescence : a Genet.104:436–450.
numerical taxonomic study. Ann. Mo. Bot. Gard.70:32–70. Matsuoka, Y., Y.Vigouroux, M. M. Goodman, J.Sanchez, E. S.
Doebley, J. F., 1990a Molecular evidence and the evolution of Buckleret al., 2002b A single domestication for maize shown
maize. Econ. Bot.44(Suppl. 3): 6–27. by multilocus microsatellite genotyping. Proc. Natl. Acad. Sci.
Doebley, J. F., 1990b Molecular systematics of Zea(Gramineae). USA99:6080–6084.
Maydica35:143–150. Oritz, R., E. N. Ruiz-TapiaandA. Mujica-Sanchez, 1998 Sampling
Doebley, J. F., and H. H. Iltis, 1980 Taxonomy ofZea species strategy for a core collection of Peruvian quinoa germplasm.
(Gramineae). I. A subgeneric classification with key to taxa. Am. Theor. Appl. Genet.96:475–483.
Pritchard, J. K., M. StephensandP. Donnelly, 2000 Inference
J. Bot.67:982–993.
of population structure using multilocus genotype data. Genetics
Doebley, J. F., M. M. GoodmanandC. W. Stuber, 1984
Isoenzy-155:945–959. matic variation inZea(Gramineae). Syst. Bot.9:203–218.
Sanchez, J., T. A. Kato, M. Aguilar, J. M. Hernandez, A. Lopezet
Doebley, J. F., W. RenfroeandA. Blanton, 1987 Restriction site
al., 1998 Distribucio´n y caracterizacion del teocintle. Instituto variation in the Zea chloroplast genome. Genetics117:139–147.
Nacional de Investigaciones Forestales, Agricolas y Pecuarias,
Jali-Evans, M. S., andJ. L. Kermicle, 2001 Teosinte crossing barrier1, a
sco, Me´xico. locus governing hybridization of teosinte with maize. Theor.
Sanz-Alferez, S., P. SanMiguel, Y. K. Jin, P. S. SpringerandJ. L.
Appl. Genet.103:259–265.
Bennetzen, 2003 Structure and evolution of the Cinful
retro-Felsenstein, J., 1993 PHYLIP (Phylogeny Inference Package),
Ver-transposon family of maize. Genome46:745–752. sion 3.5c. Department of Genetics, University of Washington,
Smouse, P. E., J. C. LongandR. R. Sokal, 1986 Multiple regression
Seattle.
and correlation extensions of the Mantel test of matrix
correspon-Gaut, B. S., M.Le Thierry d’Ennequin, A. S. Peek and M. C.
dence. Syst. Zool.35:627–632.
Sawkins, 2000 Maize as a model for the evolution of plant
Vigouroux, Y., J. S. Jaqueth, Y. Matsuoka, O. S. Smith, W. D.
nuclear genomes. Proc. Natl. Acad. Sci. USA97:7008–7015.
Beaviset al., 2002 Rate and pattern of mutation at microsatellite
Grenier, C., P. J. Bramel-Cox, M. Noirot, K. E. Prasada RaoandP.
loci in maize. Mol. Biol. Evol.19:1251–1260.
Hamon, 2000a Assessment of genetic diversity in three subsets Wilkes, H. G., 1967 Teosinte: The Closest Relative of Maize. Bussey
constituted from the ICRISAT sorghum collection using random Institute, Harvard University, Cambridge, MA.
vs. non-random procedures. A. Using morpho-agronomical and Wilkes, H. G., 1977 Hybridization of maize and teosinte in Mexico passport data. Theor. Appl. Genet.101:190–196. and Guatemala and the improvement of maize. Econ. Bot.31:
Grenier, C., M.Deu, S.Kresovich, P. J.Bramel-Coxand P.Hamon, 254–293.
2000b Assessment of genetic diversity in three subsets