Hazy Color Image Enhancement Using
Improved Contrast & Color Analysis
Priyanka P. Bhadane 1, N.A.Dawande 2, S.G.Bari 3
P.G. Student, Department of E&TC Engineering, Dr. D. Y. Patil School of Engineering Academy, Ambi, Pune,
Maharashtra, India1
Associate Professor, Department of E&TC Engineering, Dr. D. Y. Patil School of Engineering Academy, Ambi, Pune,
Maharashtra, India2
Assistant Professor, Department of E&TC Engineering, Dr. D. Y. Patil School of Engineering Academy, Ambi, Pune,
Maharashtra, India3
ABSTRACT: Image Enhancement is used to improve the contrast of the image having lowest level luminance. Image
enhancement process removes the distortion from the image and improves the quality of the image. In DCP method assess the thickness of the dimness form single input image and restore a great fog free picture. Estimate the automatic atmospheric light. Histogram Equalization (HE) is the enhancement process. Histogram equalization is used to strengthen the contrast of the color image. For improving the contrast of the color image Morphological image processing is a group of non-linear operations related to the shape or morphology of main features in an image, such as boundaries, skeletons, etc. Restored image has better contrast and hazy free scene objects under various weather conditions.
KEYWORDS: contrast enhancement, color analysis, morphological operation, haze free image, histogram
equalization.
I. INTRODUCTION
II. RELATEDWORK
An algorithm for local visibility enhancement termed Dark Channel Prior was proposed in [10]. Dark channel prior method estimates transmission map and air-light recuperate original one from foggy image. To rough calculation the transmission map, it uses the small intensity pixel of image in 3 color planes in patch size of different variations. In this project, blocks describe a novel visibility restoration approach in order to restore hazy images captured during inclement weather conditions such as haze, fog, sandstorms, and so on.
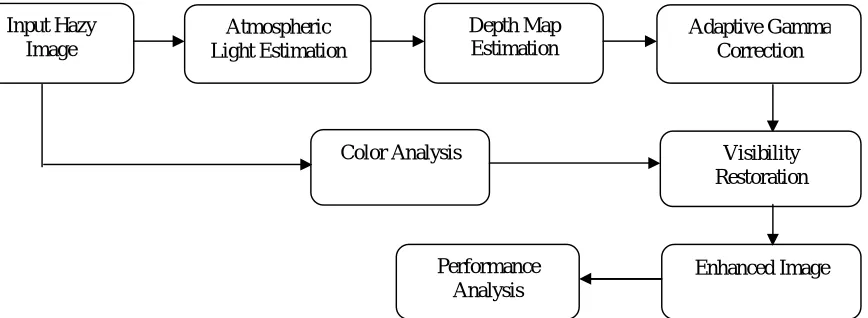
Fig 1. Block diagram of enhance vision of hazy images using improve depth estimation and color analysis
The project overview is shown in Fig.1. Where the block diagram of this project approach involves three important modules: a Depth Estimation (DE) module, a Color Analysis (CA) module, and a Visibility Restoration (VR) module. Initially, the DE module designs an effective refined transmission procedure which takes advantage of the morphological filter to preserve edge information and thereby keep away from the generation of block artifacts in the restored image. This is followed by a transmission enhancement method which modifies the intensity of the transmission map to achieve most favourable haze removal results. After these two procedures are successfully accomplished by the DE module, effective depth information can be obtained. Next, in order to repair actual color, the color characteristics and color information of the input hazy image are respectively analysed by CA module. Finally, the VR module recovers a high-quality haze-free image using the depth and color-correlated information to adequately hide the atmospheric particles present in various real-world weather conditions.
To assess the performance of method, I first used a methodology to quantitatively evaluate the restoration then analyse the sensitivity of the method to the fog input parameters. Finally, I analyse the performance of the method by looking at the comparing my method with current state-of-the art methods.
III.PROPOSEDMETHODOLOGY
Image enhancement techniques useful in improving the visibility of any part or feature of the image smothering the information in other portions or features. The transformation of digital data for improving the image qualities with the aid of computer. The processing helps in increasing clarity, sharpness and details of features of curiosity towards image enhancement.
Recently, single image haze removal has made significance advance These approaches are based on either virile assumptions or strong priors, by which haze thickness is carried out by using only a single image. Therefore, a novel haze removal approach by which to keep away from the generation of serious artifacts by the conjunctive utilization of the proposed dark channel prior module with Edge-Preserving Contrast Enhancement Using Adaptive Intensity Transformation and the present, color analysis (CA) module, and the proposed visibility restoration (VR) module. This technique can effectively cover the color distortion, artifacts & insufficient depth information problems. The
proposed technique can more effectively eliminate haze from single images captured in real-world conditions than other state-of-the-art techniques [10]–[11].
This paper deals with the defogging of images by using visibility restoration models and image restoration based algorithms. In this study, I worked on color image(.jpg) Then resize the images (0 - 255) to have same width and height First of all, in the case of the color image is convert into 8-bit Grey image with Red, Green and Blue format. Estimate atmospheric light using dark channel prior on RGB component. Apply edge preserving method for preserving the edges of an image. To estimate depth of the scene from three RGB planes using dark channel prior on RGB component.
Next step is done by using histogram equalization. Histogram Equalization is used to enhance the contrast of the color image. It is one of the simplest and less complicated methods for enhancing the quality of the color image. Decomposes this red, blue and green plan into low, middle, and high intensity layers by examining the log-average luminance of the corresponding layer. Histogram process distributes the pixels of the image on the dynamic range of the intensity in between 0.4 to 0.7 for enhancing the contrast of the image. It is the process that remaps the pixels of the image.
The adaptive intensity transfer functions are determined by combining the knee transfer function and the gamma adjustment function. Apply adaptive intensity transfer functions to separately each red plan, green plan, and blue plan of low, middle, and high intensity layer. Finally all the intensity enhanced layers are fused with an appropriate smoothing, to estimate transmission map using dark channel prior on RGB component and The proposed algorithm can effectively enhance the overall quality and visibility of local details better than existing state-of-the-art methods Experimental results exhibition that the proposed algorithm can magnify the low-contrast satellite images. Dehazy image used to calculate the performance analysis with mean, variance standard deviation and entropy. Histogram results are shown with accuracy, sensitivity and specificity Graph.
IV.ALGORITHM
Step 1: Load images read an images: fabric.jpg and detect.jpg.
Step 2: Resize images [256 256]) to make the image comparison easier, resize the images to have the same width & height.
Step 3: Convert RBG to Grey image
Step 4: Enhance grayscale images using DCP and histogram equalization is applied to enhance the contrast . Step 5: Executes on button press in Atmosphere estimation.
Step 6: Executes on button press in Depth Estimation of 3 plane. 1] RED PLANE
a) Normalization low intensity, middle intensity, high intensity NI =((Pim-min1).*1)./(max1-min1);
b) Knee transfer Function
Set the tuning parameter for knee points determination bl = 0.4;
bh = 0.7;
wl = 1;wh =1;wm = 3;
c) Gamma Adjustment Function for three intensity layers gamma = 1 / 1.4 ;
d) Combining Knee transfer and gamma adjustment function e) Enhancement of three intensity layers
f) Fusion of Enhanced Intensity layers g) PostProcessing with Erosion operation
2] BLUE PLANE
b) Knee transfer Function
Set the tuning parameter for knee points determination bl = 0.4;
bh = 0.7;
wl = 1;wh =1;wm = 3;
c) Gamma Adjustment Function for three intensity layers gamma = 1 / 1.4 ;
d) Combining Knee transfer and gamma adjustment function e) Enhancement of three intensity layers
f) Fusion of Enhanced Intensity layers g) PostProcessing with Erosion operation
3] GREEN PLANE
a) Normalization low intensity, middle intensity, high intensity NI = ((Pim-min1).*1)./(max1-min1);
b) Knee transfer Function
Set the tuning parameter for knee points determination bl = 0.4;
bh = 0.7;
wl = 1;wh =1;wm = 3;
c) Gamma Adjustment Function for three intensity layers gamma = 1 / 1.4 ;
d) Combining Knee transfer and gamma adjustment function e) Enhancement of three intensity layers
f) Fusion of Enhanced Intensity layers g) PostProcessing with Erosion operation
Step 7: Executes on button press in Visible Restoration. Step 8: Executes on button press in Parameters.
Step 9: Parameters Evaluation (total number of test samples 11 ) Tp = 6; Fn = 1; …..after classification
Fp = 0; Tn = 4;
Tp --> Abnormality correctly classified as abnormal Fn --> Abnormality incorrectly classified as normal Fp --> Normal incorrectly classified as abnormal Tn --> Normal correctly classified as normal
VI.EXPERIMENTALRESULT
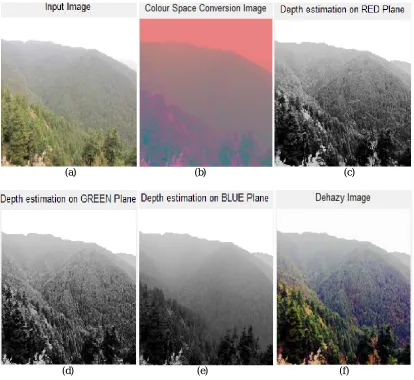
Figures shows the results of restored images from hazy images via each of the DCP-based methods and the invented method measured through visual evaluation of two images titled “Forest,” “Buildings, “Hilly Area,” “City”. During foggy conditions, input captured images usually exhibit significant color cast effects and inconsistent distributions of the RGB color channels due to the irregular absorption of specific sections of the light spectrum by atmospheric particles of haze. Because of this, the transmission map usually suffers from insufficient estimation of haze thickness, as well as color cast problems in the restore images. So I observed the building, city, and tree background region of the input hazy image containing the whiteness covered by atmospheric particles, then after perform the DCP-based method, I can completely remove the white particles and effectively recover the visibility of a degraded image, as displayed above all figure 2-3 f) of Dehazy output images. This is due to improving the depth estimation, its use of a Lapacian-based gamma correction technique, by using adaptive intensity transfer function , which can be observed in the all Figures 2-3 (c)(d)(e) In addition, estimation of haze depth for each red , green, blue plan by using adaptive intensity transfer function.
(a) (b) (c)
(d) (e) (f)
(a) Input haze image. The remaining five images are the restoration results with corresponding spatial varying intensity distribution function generated from my algorithm b) color space conversion image c) depth estimation on Red plane d) depth estimation on Green plane e) depth estimation on Blue plane f) Output dehazy image
(a) (b) (c)
(d) (e) (f)
Fig.3. “Building” Image
VII. COMPARISONSTUDYOFIMAGES
Below Fig.4.[A][B] Allows the comparison of my results with four state of the art visibility restoration algorithms: Kopf&al. [6] which uses 3D information on the scene, Fattal [1] which is based on a chroma criterion, Tan [12] and He&al. [5] which are based on a geometric criterion. Notice that the results obtained with my algorithm seems visually close to the results obtained by Kopf&al. and He&al., with less saturated colors compared with Tan.
[A]
(a) (b) (c)
(d) (e) (f) [B]
(d) (e) (f)
Fig. 4. Comparison Study of Images [A] “Hilly Area” images and [B] “City” Area images.
(a) Original Hazy Image And The remaining five images are the restoration Dehazy images Results Obtained By (b) Kopf&Al., (c) Fattal, (d) Tan, (e) He&Al.And (f) Our Algorithm.
VIII. PERFORMANCEANALYSIS
The basic characteristics of an image are used in this research work. A new equation of color haze image classification formulated using these characteristics.
A] Mean (ɡ): The mean of an image is the average pixel intensity of the image.
M=Height of image; N=Width of image; a[x, y] =Image pixel intensity at coordinate[x, y] B] Standard Deviation (STD): The standard deviation of an image is calculated as below
M=Height of image; N=Width of image; a[x, y] =Image pixel intensity at coordinate[x, y]
ɡ = Mean of the image C] Variance
Variance is the expectation of the squared deviation of a random variable from its mean, and it informally measures how far a set of (random) numbers are spread out from their mean.
D] Entropy
I use entropy as the Shannon entropy which contains the maximum information. It is use to measure the quality of image. Images which have maximum entropy have the better quality of the image.
IX.STATICCHARACTERISTICS
True positive= correctly identify the haze thickness False positive= incorrectly identify the haze thickness True negative= correctly rejected
False negative= incorrectly rejected
Set the parameters as,
Tp = 6; Fn = 1; Fp = 0; Tn = 4;
(a) (b) (c)
Fig.5. (a) Blue Histogram representation of Accuracy (b) Red Histogram representation of specificity of output image (c) Green Histogram representation of sensitivity of output image
The degree of exactness (closeness) of a measurement compared to the expected (desired) value. Show the Fig. 5 a)Blue Histogram representation of Accuracy. Software complexity analysis may provide an assessment tool that can be used during program development and testing. Designers and programmers could use the measure to find deficiencies in program construction. Show the Fig.5.(b) Red Histogram representation of specificity of output image.
The sensitivity denotes the smallest change in the measured variable to which the instrument responds. It is defined as the ratio of the changes in the output of an instrument to a change in the value of the quantity to be measured. Sensitivity is also called the true positive rate. Its measure the proportion of positive that are correctly identify the percentage of haze in the images . Fig.5(c) Green Histogram representation of sensitivity of output image
The formulae use for the calculate of accuracy, specificity, sensitivity as, a]Accuracy = ((Tp+Tn)./(Tp+Tn+Fp+Fn)).*100;
b] Specificity= (Tn./(Tn+Fp)).*100 c] Sensitivity = (Tp./(Tp+Fn)).*100;
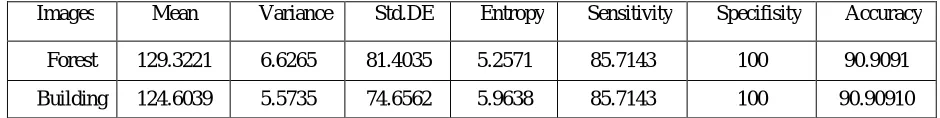
Following Table 1 shows the measured basic and statics characteristic values of an output dehazy images recovered from the input hazy images. Results values indicates the enhanced quality of images than the hazy images .
Images Mean Variance Std.DE Entropy Sensitivity Specifisity Accuracy
Forest 129.3221 6.6265 81.4035 5.2571 85.7143 100 90.9091
X. CONCLUSION
This project provides solution on visibility restoration of single hazy images base on existing methods issues, like Difficulties to acquire scene depth information, Low performance in restoration of image characteristic, It decrease image quality after restoration due to blocking artifacts, It doesn’t provide optimal transmission which causes halo effect and color distortion problems. To avoid these problems, a design is proposed to enhance The visibility restoration of single hazy images using color analysis and depth estimation with enhanced refined transmission technique. single image technique is used for this dehazing process because of its flexibility and low cost, this method avoids halo effect and not enough transmission estimation problems.
REFERENCES
[1]H. Xu, J. Guo, Q. Liu, and L. Ye, “Fast image dehazing using improved dark channel prior,” in Proc. IEEE Int. Conf. Inf. Sci. Technol.,no.6 , pp. 663–667. Mar. 2012
[2] F. Gasparini and R. Schettini, “Color correction for digital photographs,” in Proc. IEEE Int. Conf. Image Anal. Process., no.8, pp. 645–651, Sep. 2003
[3] S. C. Huang, F. C. Cheng, and Y. S. Chiu, “Efficient contrast enhancement using adaptive gamma correction with weighting distribution,” IEEE Trans. Image Process., vol. 22, no. 3, pp. 1032–1041, Mar. 2013.
[4] S. C. Huang and W. C. Chen, “A new hardware-efficient algorithm and reconfigurable architecture for image contrast,” IEEE Trans. Image Process., vol. 23, no. 10, pp. 4426–4437, Oct. 2014.
[5] N. Banic and S. Loncaric, “Light random sprays Retinex: Exploiting the noisy illumination estimation,” IEEE Signal Process. Lett., vol. 20, no. 12, pp. 1240–1243, Dec. 2013.
[6] N. Hautière, J.-P. Tarel, D. Aubert, and E. Dumont, “Blind contrast enhancement assessment by gradient rationing at visible edges,” Image Anal. Stereol., vol. 27, no. 2, pp. 87–95, 2008.
[7] F. C. Cheng and S. C. Huang, “Efficient histogram modification using bilateral Bezier curve for the contrast enhancement,” J. Display Technol., vol. 9, no. 1, pp. 44–50, Jan. 2013.
![Fig. 4. Comparison Study of Images [A] “Hilly Area” images and [B] “City” Area images](https://thumb-us.123doks.com/thumbv2/123dok_us/1628564.1202873/9.595.105.503.181.331/comparison-study-images-hilly-area-images-city-images.webp)