Article
1
Porosity Characterization and Its Effect on Thermal
2
Properties of APS Sprayed Alumina Coatings
3
Wolfgang Tillmann1, Omar Khalil 2,* and Mohamed Abdulagader2
4
1 Institute of materials science; [email protected]
5
2 Institute of materials science; [email protected]
6
* Correspondence: [email protected]; Tel.: (+49-231-755-6113)
7
Abstract: In the present work, three different atmospheric plasma sprayed (APS) alumina coatings
8
were fabricated using three fused and crushed alumina powders of different particle size fine,
9
medium and coarse. The influence of the particle size on thermal properties and micro-structural
10
features of the produced coating were investigated by thermal insulation test and detailed image
11
analysis technique, respectively. The analyzed micro-structural features include the total porosity,
12
pore size (fine, medium, and large) and cracks. All types of cracks were considered in calculations
13
as voids and were evaluated according to their sizes as pores. All spray parameters except the
14
particle size were fixed throughout the spraying process. The results revealed that the fine starting
15
powder has produced the densest coating with the lowest total porosity and that the total porosity
16
increases with an increasing particle size. This was expected as powders of smaller particle size will
17
reach a higher in-flight temperature and velocity than powders of bigger particle sizes as long as
18
the same spray parameters are applied. However, a detailed image analysis investigation on the
19
three produced coatings showed that the fraction of fine pores and cracks versus the total porosity
20
is substantially higher in coatings produced by using fine starting powders than those produced
21
using medium and coarse powders. In this work, a connection between the thermal insulation and
22
the porosity fraction, which includes fine pores and cracks, was revealed.
23
Keywords: atmospheric plasma spray (APS) process; particle size; thermal insulation; thermal
24
barrier coating (TBC); thermal diffusivity; coating microstructure; coating porosity.
25
26
1. Introduction
27
Thermal spraying method is a coating process that adds additional thermal and mechanical
28
properties to base substrate materials. In this process, a thick coating is applied to bulk materials
29
substrates which enable them to operate beyond their capabilities in an uncoated state. Ceramics, in
30
general, are particularly suitable for thermal spray processes, with plasma spraying being the most
31
appropriate process due to high temperatures that the plasma jet provides [1]. Atmospheric plasma
32
sprayed (APS) alumina ceramic coatings are very good electrical and thermal insulators. They also
33
improve the resistance of steel against corrosion, wear and erosion. For these reasons, ceramic
34
coatings have been widely investigated [2,3,4,5]. These coatings are being used by the automotive
35
and aerospace industries, where internal components normally operate in severe environments
36
including extreme temperatures [6].During the spraying process, molten alumina particles are heated
37
and accelerated by the plasma jet towards a prepared substrate surface. If these accelerated particles
38
are melted, they impact on the substrate, flattened and form so-called splats. Splats are the main
39
structural unit in APS coatings [1]. The successive deposition overruns define the final thickness and
40
compose the layered structure of the whole coating. In addition to the fully melted particles, APS
41
coatings consist of partially melted particles as well as un-melted particles. The described deposition
42
mechanism leads to a coating with micro structural defects such as pores, delaminations, and
micro-43
cracks. Also, oxide films around the molten particles (droplets), together with un-melted particles,
44
form inclusions in the coating. Fine pores arising from entrapped gas below the molten droplets are
45
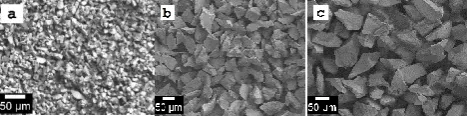
of spherical shape and homogeneously distributed. The coarse pores, however, are formed due to
46
incomplete filling caused by both semi-molten and un-melted particles and they are non-
47
homogeneously distributed [7]. Oxides, foreign inclusions, as well as un-molten particles are
48
considered to be detrimental to the coating properties; at the same time, the micro-structural features
49
including pores, delaminations, and cracks generated during spraying process improve the thermal
50
insulation of the coating and increase its strain tolerance as well. Hence, the degree of the particle’s
51
melting state whilst in-flight affects largely the level of cohesion, porosity, and the ultimate coating’s
52
properties [1,8].
53
Thermal stresses and rapid solidification of in-flight particles are disadvantages related to the APS
54
ceramic coatings. Thermal stresses motivate micro-cracks to initiate and then propagate within the
55
coating, which limits the coating thickness. In a wet environment, micro-structural defects such as
56
pores and cracks may cause local corrosion in the substrate [6], however, the presence of such defects
57
with defined levels enhances the thermal insulation of the coating as well as increases its thermal
58
shock resistance [1]. Un-molten particles exist in the coating when large particles do not have enough
59
time to be fully melted. Only the outer surface of such particles is melted as they impact on the
60
substrate while the inside of the particles is still un-melted [9]. APS alumina coatings have a lamellar
61
microstructure, and defects such as pores and cracks exist generally within/between the lamellae to
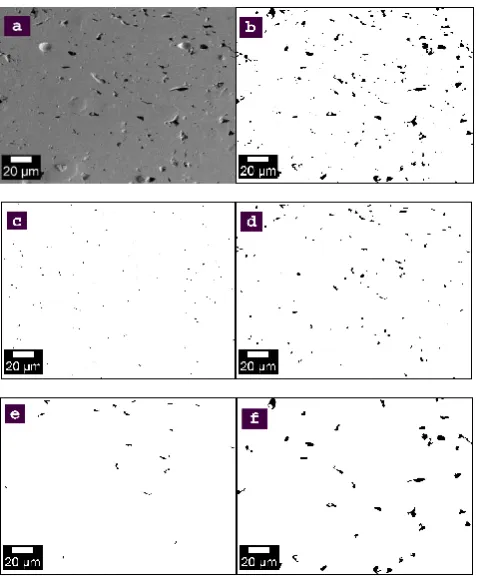
62
form an interconnected network. These bi-modular features dramatically influence the mechanical
63
behavior and electrical/thermal insulation of the coating [10,11]. Besides other process parameters,
64
such as the spray power and spray distance, the starting powder particle size has a high influence on
65
the particle’s in-flight temperature and velocity. The in-flight particle conditions in turn, determine
66
the particle melting state, impact behavior, and the ultimately produced microstructure of the coating
67
and its properties. [12]. Many researchers have referred to the fact that total porosity plays only a
68
secondary role while the size, shape, and spatial distribution of the pores play the primary role in
69
determining the properties of a coating [13,14].
70
The present work is based on the study of APS alumina-coating micro-structures using three
71
feedstock powders of different particle sizes that are bonded to steel substrates. The influence of the
72
particle size on the in-flight particle temperature and velocity as well as the coating’s microstructural
73
features and the properties of the coating were investigated. The microstructural features of APS
74
alumina coatings including its total porosity, pore area, and crack network were analyzed
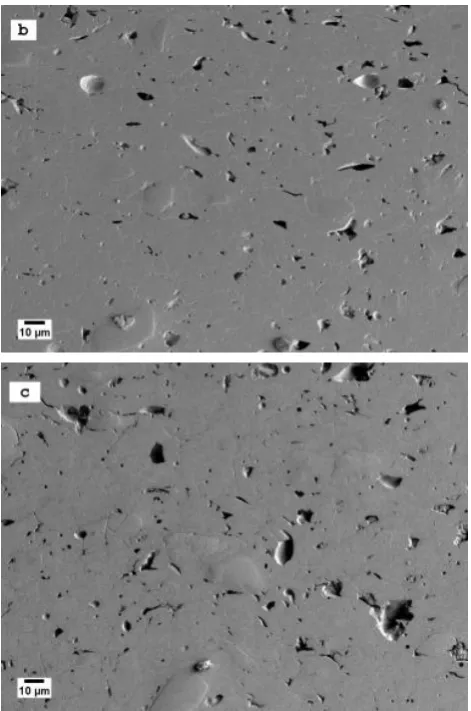
75
quantitatively by means of an image processing tool. The work focuses on the accurate measurement
76
of porosity fractions based on a clear criterion that distinguishes each porosity component. Moreover,
77
coating properties such as the micro-hardness and thermal insulation were evaluated and related to
78
the quantified microstructural features.
79
2. Materials and Methods
80
2.1 Samples preparation and deposition process:
81
Three sets of steel substrates with nominal dimensions with a diameter of 40 mm and a thickness
82
of 5 mm were grit blasted using alumina (EFK-14) on one side. This procedure was followed by an
83
ultrasonic cleaning for the APS deposition. Three commercial alumina powders (fused and crushed )
84
of different particle sizes; fine powder, Amperit 740.000 (5-22 µm), medium powder, Amdry 6062
(25-85
45 µm), and coarse powder, Amperit 740.002 (45-90 µm), H.C.Stark, Germany, were deposited on the
86
steel substrates. The median size (Vol. 50%) of these powders were 14.00 µm, 35.88 µm, and 77.7 µm,
87
respectively.
88
89
Figure 1. SEM images showing the morphology of the:
(a)fine, (b)medium, and (c)coarse alumina powders.
91
92
SEM images of the utilized powders and their particle size distribution are shown in Figure 1. An
93
Orlikon Metco F4-MB gun, with a nozzle with a 6mm internal diameter and a single powder feeder was
94
used for this study. All spray parameters were kept constant for the three powders in order to
95
investigate the influence of the starting powder’s particle size on the microstructural features of the
96
coatings. The APS process parameters are given in Table 1.
97
Table 1. APS process parameters for alumina powders
98
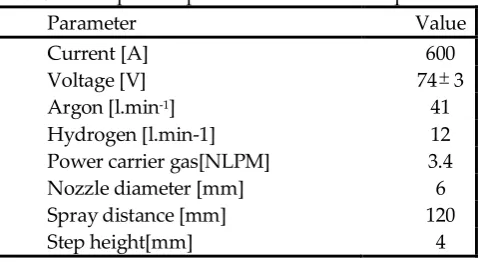
Parameter Value Current [A] 600 Voltage [V] 743 Argon [l.min-1] 41
Hydrogen [l.min-1] 12 Power carrier gas[NLPM] 3.4 Nozzle diameter [mm] 6 Spray distance [mm] 120 Step height[mm] 4
2.2 Porosity Analysis
99
In order to quantitatively evaluate the porosity of the produced depositions; cross-sectional
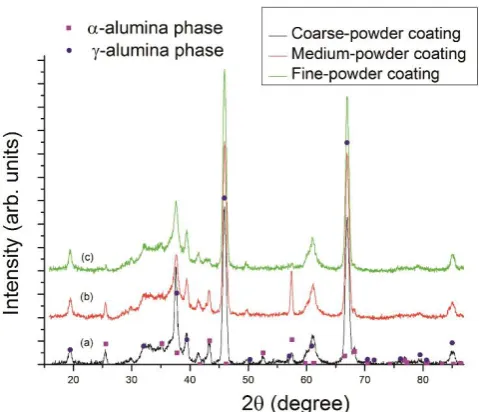
100
metallographic samples were prepared for the investigations. A series of SEM images with different
101
magnification factors for each cross-section were taken by a Field Emission Scanning Electron
102
Microscope (Joel, JSM-7001F FESEM). For the porosity measurements, ten images along the
cross-103
section were taken randomly, central to the thickness, for each cross-section. The images were
104
magnified with a magnification factor of 1000x, which enables the detection of 0.1 µm-sized features.
105
The image brightness was reduced while the contrast was increased to facilitate the image analysis
106
software to accurately detect any porosity. Additionally, a very low accelerating voltage (1.0 kV) and a
107
low probe current (8-10 µA) were used so that the contrast between the pores and coating’s matrix was
108
enhanced. Additionally, back-scattering electrons feature were used to enhance the quality of the
109
obtained SEM images. An image analysis was performed using the Image J1.49r software (provided by
110
the National Institutes of Health, USA) on SEM images at 1000x. Image filtering was applied to remove
111
noises followed by image segmentation by thresholding, which produced binary images; the
zero-112
threshold level (black) was assigned to the pores and one level (white) to the alumina solid state.
113
Subsequently, the pores were measured and categorized according to three area ranges: Fine (0-1 ),
114
medium (1-10 ), and large (>10 ). Moreover, the medium pore size range (1-10 ) for the three
115
coatings was further classified in terms of the circularity (cir.<0.5). Circularity is a measuring unit of
116
pore spheroids. The more a pore becomes spherical, the circularity approaches unity and when pores
117
become more elongated or narrow, circularity decreases. Circularity is defined by:
118
119
4π(A/p2), (1)
120
121
where “A” is the pore area and “p” is the pore perimeter. Various shapes of pores and cracks of
122
different sizes in a cross-sectional SEM image for one coating are identified in Figure 2. The process of
123
pore classification is shown in Figure 3.
125
Figure 2. Cross-sectional SEM image showing the shapes and relative sizes of pores and cracks.
126
127
128
129
Figure 3. Pore classification process: a) SEM gray image, b) total porosity (binary image), c) fine-pore,
130
d)medium-pore, e) medium-pore with circularity <0.5, f)large-pore class.
131
2.3 Characterization
132
A thermal spray sensor (AccuraSpray G3, Tecnar Co., Canada) was used to measure the
133
temperature and velocity of in-flight particles prior the process of samples deposition. The system was
134
positioned so that measurements are taken exactly at the spray distance listed in Table 1.
135
One sample of each coating was used in the insulation test where the coating surface was subjected to
136
an increasing heat source (oven) up to 900°C with a rate of 15°C per minute, and a holding time of 60
137
minutes. The temperature on both sides of the three coatings was simultaneously measured by means
138
of two thermocouples. Microhardness measurements were carried out at room temperature on polished
139
cross-sections that represent the three as-sprayed coatings, using a Vickers microindenter (Leco M-400,
140
Germany). The indentations were performed with a load of 2.94 N for a dwell time of 15s. The standard
141
spacing was used between the indentations (at least three times the diagonal) to ensure that no further
142
stresses were produced by the interaction between the consecutive indentations.
144
3. Results and discussion
145
3.1 Image processing analysis
146
SEM images of as-sprayed coatings were used to analyze the porosity of the produced coatings for
147
the three powders. The porosity level variation in the three coatings is shown in Figure 4. It can be
148
observed that fine pores with an almost spherical shape are uniformly distributed along the coating
149
of the fine-powder. As the particle size increases with medium and coarse powders, more pores of
150
larger sizes are visible and the porosity distribution becomes non-uniform. The image analysis
151
performed on SEM images of coating’s cross sections showed that the average total porosity of fine-,
152
medium-, and coarse-powder coatings are 0.93%, 2.47%, and 5.55% of coating area, respectively. In
153
general, the total porosity levels for all coatings increases when increasing the feedstock powder
154
particle size. This increase is mainly due to the simultaneous increase of both the number and size of
155
large pores, whereas fine and medium pores decrease.
156
As all spray parameters were kept constant for the three powders, fine-powder particles were
157
exposed to a higher in-flight temperature and velocity (2620 °C, 415 m/s in average) than medium-
158
and coarse-powder particles (2530 °C, 365 m/s and 2390 °C, 330 m/s in average, respectively). Also,
159
thickness measurements of the three coatings revealed that coarse-powder produce thicker coatings
160
than medium- and fine-powders (avg. thicknesses were 668µm, 475µm and 180µm, respectively).
161
The porosity of the three coatings was evaluated quantitatively and classified into three area ranges.
162
Subsequently, the average porosity of each pore range was calculated. The porosity evaluation was
163
based on ten measurements of ten different SEM images for each coating sample. Given the average
164
pore range porosity and average total porosity for each sample, the percentage of each pore range
165
versus the total porosity was calculated. Additionally, the medium pore range (1-10µm) for each
166
sample was also classified according to the pore’s circularity.
167
169
170
Figure 4. Cross-sectional SEM micrographs of as-sprayed alumina coatings indicating the coating
171
porosity and cracks deposited with: a) fine-powder, b) medium-powder, and c) coarse-powder.
172
For the medium pore range, the shape of the pores is crucial with regard to the thermal insulation
173
property as pores with a low circularity (circularity < 0.5) highly contribute to the thermal
174
insulation property in comparison to pores with a high circularity (circularity > 0.5). These
175
measurements are visualized in Figure 5. It can be seen that fine-powder coating possesses a higher
176
percentage of fine pores and medium pore ranges (34.4%, 62.3%, respectively) than
medium-177
powder and coarse-powder coatings (15%, 45%, and 6%, 27%, respectively). While more than 60%
178
of the medium pore range for fine-powder coatings exhibit a circularity of <0.5, medium-powder
179
and coarse-powder coatings exhibit less than half (48.2% and 48%, respectively) of medium pore
180
range with the same circularity.
181
In contrast, coarse-powder coatings possess a higher percentage of large pore ranges (67%) than
182
medium-powder and fine-powder coatings (40% and 3.3%, respectively).
184
Figure 5. Relative pore range contribution out of total porosity.
185
3.2 Microhardness
186
Microhardness tests showed the effect of the coating porosity on microhardness values of the three
187
coatings. Table 2 lists the average microhardness values of the three coatings along with the
188
deviations of these measurements. In comparison to medium- and coarse-powder coatings,
fine-189
powder coatings have the highest microhardness value due to their denser microstructure and lower
190
total porosity. It is noticeable that the deviation value associated with the average microhardness
191
value for the coarse-powder coating is higher than that of the medium- and fine-powder coatings.
192
This can be attributed to the non-uniform distribution of large- and medium-range pores along the
193
coating. In contrast, fine-powder coatings possess the lowest microhardness value due to the relative
194
low pore-size distribution and the very low fraction of large-range pores (3.3%).
195
Table 2. Average microhardness measurements and associated deviations.
196
Coating of Avg. microhardness
(HV03)
Deviation
Fine-powder 944 16.2
Medium-powder 881 32.3
Coarse-powder 829 71.4
3.3 Phase Analysis
197
To justify the different ranges of the pore size distribution in the coatings, the phase composition of
198
the three coatings was investigated and the measurements are given in Figure 6. The three as-sprayed
199
coatings consist of a mixture of α-Al2O3 and γ-Al2O3. However, the main phase was the γ-phase,
200
with the α phase only occurring as a secondary phase. The α-phase is associated with un-molten
201
sprayed powder particles or with molten particles cooled at a low rate. Generally, a high cooling rate
202
leads to a high composition of a γ-phase. The broad, flat area on the curve representing the
fine-203
powder coating (Figure 6-c) indicates that larger amounts of particles were fully molten and their
204
phase changed into a γ phase when compared to medium- and coarse-powders. This implies that a
205
higher fraction of fine-powder particles were fully melted when impacting on the substrate than those
206
in medium- and coarse-powders, which is represented by the γ-phase. Un-molten and partially
207
melted particles of coarse- and medium-powders within the coatings were the source of large pores
208
formations. Therefore, the α-phase, which represents these particles in coarse- and medium-powder
209
coatings (Figure 6-a&b) has a higher level in the composition than that of fine-powder coatings
210
(Figure 6-c).
212
Figure 6. XRD patterns of APS coatings deposited with: a) coarse-powder, b) medium-powder, and
213
c) fine-powder particle sizes.
214
3.4 Thermal insulation
215
The thermal insulation of the three coatings is shown in Figure 7. It can be seen that the
fine-216
powder coating possesses a comparable thermal insulation value when compared to the medium-
217
and coarse-powder coatings although its total porosity is much lower (0.93%) than the total
218
porosities of medium- and coarse-powder coatings, (2.47% and 5.55%, respectively). As the porosity
219
of fine-powder coatings consists mainly from pores and cracks of the fine- and medium-range
220
(96.7%), it can be concluded that these ranges of pore sizes and shapes contribute largely to the
221
thermal insulation property and play the primary role in determining thermal insulation value of
222
coatings. The high thermal insulation exhibited by fine-powder coatings can be related to the
223
greater number of interfaces between the pores and the matrix of the coating [14]. Also, the relative
224
high thermal insulation of fine-powder coatings can be related to the higher fine pore density
225
(number of fine pores per unit area), as it can be noticed in SEM images in Figure 4.
226
Additionally, large pores and medium pores of circularity of >0.5 turn to be of low significance and
227
play only a secondary role in determining the thermal insulation property of coatings, although their
228
presence in medium- and coarse-powder coatings increases greatly the overall porosity.
229
230
Figure 7. Comparison of thermal insulation of as-sprayed coatings produced by fine, medium, and
231
coarse particle size.
4 Conclusions
233
In this study, it was shown that the particle size of the feedstock starting powder has a fundamental
234
effect on the porosity level as well as pore-size distribution, pore shape, and distribution of the
235
overall porosity which highly influence the ultimate thermal coating properties such as the thermal
236
insulation and strain tolerance. According to the obtained results, the following conclusions can be
237
drawn:
238
1. Coatings produced by fine-powders (i.e. fine particle size) exhibit more uniform pore distribution
239
than coatings produced using medium- and coarse-powders. The pore size ranges from few tenth
240
nanometers to approximately 10um. More than 94% of this range contributes highly to the coating’s
241
thermal insulation property due to the uniform distribution, pore size, and pore shape.
242
2. As the starting powder’s particle size increases, the percentage of fine and medium pore ranges
243
(0-1 & 1-10um) versus the total porosity decreases, while the percentage of large pore ranges
244
(>10um) versus the total porosity increases. The increment in large pores greatly increases the total
245
porosity with a low contribution to the coating’s thermal insulation.
246
3. APS coatings fabricated by fine-powders have higher micro hardness values than coatings
247
fabricated by medium- and coarse-powders due to their denser coatings. At the same time,
fine-248
powder coatings exhibit thermal insulation value comparable to thermal insulations of coatings
249
produced by medium- and coarse-powders despite of higher total porosity and coating thichness
250
owned by both medium- and coarse-powder coatings. This is due to the higher contribution of the
251
“effective porosity” in fine-powder coatings represented by fine pores and cracks and to their
252
homogeneous distribution within the coatings.
253
Author Contributions: supervision, Mohamed Abdulgader; project administration, Wolfgang Tillmann;
254
Conflicts of Interest: The authors declare no conflict of interest.
255
References
256
1. J.R. Davis, Handbook of Thermal Spray Technology, ASM International Materials Park, Las-Vegas, USA,
257
2009.
258
2. Pavitra, B., Padture P. and V. Alexandre: Improved interfacial mechanical properties of Al2O3 – 13 wt.%
259
TiO2 plasma-sprayed coatings derived from nanocrystalline powders, ActaMaterialia, Vol. 51 (2003), pp.
260
2959-2970.
261
3. Singh, V., Sil, A., and R. Jayaganthan: A study on sliding and erosive wear behavior of atmospheric plasma
262
sprayed conventional and nanostructured alumina coatings, Materials and design, Vol. 32, No. 2 (2011),
263
pp. 584-591.
264
4. Tingaud,O., Bertrand, P., and G. Bertrand: Microstructure and tribological behavior of Suspension plasma
265
sprayed Al2O3 and Al2O3–YSZ composite coatings, Surface & coating technology, Vol. 205, No. 4 (2010),
266
pp. 1004- 1008.
267
5. Li, C., Yang, G., and A. Ohmori: Relationship between particle erosion and lamellar microstructure for
268
plasma-sprayed alumina coatings, Wear, Vol. 260, No. 2 (2006), pp. 1166-1172.
269
6. Morks, M., Cole, I., Corrigan, C., and A. Kobayashi: Electrochemical characterization of plasma sprayed
270
alumina coatings, Journal of surface engineered materials and advanced technology, Vol.1, No.3 (2011)
271
7. Girolamo, G., Brentari, A., Blasi, C., and E. Serra: Microstructure and mechanical properties of plasma
272
sprayed alumina-based coatings, Ceramic international, 40 (2014).
273
8. Schlichting, K., Padture, N., and P. Klemens: Thermal conductivity of dense and porous yttria stabilized
274
zirconia, Journal of materials science, vol. 36, No. 12 (2001), pp. 3003–3010.
275
9. Hurevich, V., Smurov, I., and L. Pawlowski: Theoretical study of the powder behavior of porous particles
276
in a flame during plasma spraying, Surface coatings technology, (2002), pp. 151–152, 370–376.
277
10. Pawlowski L. et al: The relationship between structure and dielectric properties in plasma sprayed alumina
278
11. Beauvais, S. et al: Influence of defect orientation on electrical insulating properties of plasma-sprayed
280
alumina coatings, Journal of electroceramics, Vol. 15, (2005), pp. 65-74.
281
12. Friis, M., Persson, C., and J. Wigren: Influence of particle in-flight characteristics on the microstructure of
282
atmospheric plasma sprayed yttria stabilized ZrO2, Surface coating technology, Vol141, No. 2-3 (2001), p.
283
115-127
284
13. Sevostianov,I., and M. Kachanov: Plasma sprayed Ceramic Coatings; Anisotropic elastic and conductive
285
properties in relation to the microstructure; cross-property correlations, Materials science engineering, Vol
286
297, No.1-2 (2001), pp. 235-243
287
14. Ravichandran, K., An, K., Dutton, R., and S. Semiatin: Thermal conductivity of plasma-sprayed monolithic
288
and multilayer coatings of alumina and yttria-stabilized zirconia, Ceramic society, Vol 82, No.3 (1999),