Article
1
The multilevel structure of sulfonated
2
syndiotactic-polystyrene model polyelectrolyte
3
membranes resolved by extended Q-range contrast
4
variation SANS.
5
Maria-Maddalena Schiavone 1, Hiroki Iwase 2, Shin-ichi Takata 3, and Aurel Radulescu 1,*
6
1 Jülich Centre for Neutron Science (JCNS) at Heinz Maier-Leibnitz Zentrum (MLZ), Forschungszentrum
7
Jülich GmbH, 85747 Garching, Germany
8
2 Neutron Science and Technology Center, Comprehensive Research Organization for Science and Society
9
(CROSS), 162-1 Shirakata, Tokai, Ibaraki 319-1106, Japan
10
3 Materials and Life Science Division, Japan Proton Accelerator Research Complex (JPARC), Tokai, Ibaraki
11
319-1195, Japan
12
* Correspondence: [email protected]; Tel.: +49-89-289-10712 (A.R.)
13
14
Abstract: Membranes based on sulfonated synditoactic polystyrene (s-sPS) were thoroughly
15
characterized by contrast variation SANS over a wide Q-range in dry and hydrated states.
16
Following special sulfonation and treatment procedures s-sPS may become an attractive material
17
for fuel cells and energy storage applications. The film samples were prepared by solid-state
18
sulfonation that allowed a uniform sulfonation of only the amorphous phase while preserving the
19
crystallinity of the membrane. The samples were loaded with different guest molecules in either
20
the amorphous (fullerenes) or the crystalline (toluene) regions, in order to vary the neutron contrast
21
or to reproduce the conditions enabling an increased resistance of the membranes to chemical
22
decomposition. The use of uni-axially deformed film samples and contrast variation with different
23
H2O/D2O mixtures allowed for the identification and characterization of different structural levels
24
with sizes between nm and m, which form and evolve in the membrane morphology in dry and
25
hydrated states and produce scattering features on different detection sectors and at different
26
detection distances after the sample, depending on their size and orientation.
27
Keywords: proton exchange membranes; semi-crystalline polymers; small-angle neutron scattering
28
1. Introduction
29
Owing their high conversion efficiency, high power density, low weight and volume, fast
30
startup time, low operating temperature (below 100°C) and clean exhaust, the polymer electrolyte
31
membrane (PEM) fuel cells (PEMFC) are considered an attractive energy conversion technology for
32
transportation applications, as demonstrated by the prototyped fuel cell vehicles and announced
33
near future production plans by almost all major car manufacturers [1,2]. With potential to become
34
an alternative to the currently used fossil fuel technologies in light-duty transportation and to reduce
35
thus the dependence on conventional fuels and the CO2 emissions, PEMFCs show not only
36
economical, but also environmental benefits.
37
In a simplistic picture of the working principle of a PEMFC, the PEM separates the anode from
38
the cathode and conducts at very high rates the protons emerging from the catalyst facilitated
39
hydrogen oxidation in the anode chamber [3]. However, the transport phenomenon in the PEM is a
40
complex process because, on one hand, besides protons that are the only ones to be transferred
41
through the membrane, other species are produced at the anode too, and, on the other hand, the
42
leaking of fuel (hydrogen) and oxidant (air) from the anode chamber to the counterpart must be
43
prevented [4]. Moreover, a very efficient PEMFC requires the membrane to function in hydrated
44
state, which usually lowers the mechanical strength. Therefore, great efforts have been spent in the
45
last years to develop and characterize materials that are approaching the properties of an ideal
46
“separator” [5] and to understand and optimize the water management in different components of
47
the PEMFC [6-8]. PEM materials should be characterized by a nanoscale phase separation into
48
hydrophilic domains and hydrophobic regions, a combination that enables a high conductivity and
49
provides a good chemical and mechanical stability, thus membrane durability. Perfluorosulfonated
50
ionomers (PFSI) present high performances and stability in PEMFC operational conditions. Among
51
them, the Nafion (Du PontTM) is the most well known material and was established as benchmark for
52
such applications [9]. However, despite their excellent properties, the PSFI materials present several
53
drawbacks such as the high cost, lack of safety during manufacturing and use, requirement of
54
supporting equipment and temperature related limitations [10]. Thus the PSFI membranes seem not
55
to be still the ideal choice for the commercialization of PEMFC technology. Alternative low-cost
56
materials that should present similar conductive and chemo-mechanical properties as the PFSI
57
membranes are continuously searched for. Different crystalline-amorphous polymer architectures
58
and the interrelation of their properties with the microphase separation structures, such as
59
crystalline domains, the formation of conducting regions, and the distribution of ionic groups and
60
water in the conducting regions were extensively studied in last years [11-15]. Given the recent
61
developments, which enable a controlled sulfonation of only the amorphous phase, preserving thus
62
the crystallinity of the material [16], and an improved resistance to oxidation decomposition when
63
fullerenes are added [17], the sulfonated syndiotactic polystyrene (s-sPS) in its -form may become a
64
good candidate for some PEMFC applications, as it presents a high proton conductivity, comparable
65
to Nafion [18], high chemical and thermo-mechanical stability and a low cost [19]. The preparation of
66
s-sPS membrane should start from the -form (clathrate with guest molecules), which enables a
67
homogeneous sulfonation of the amorphous regions only and can be subsequently transformed into
68
the thermodynamically stable -form by chemical/annealing treatment [18, 20]. On the other hand,
69
sPS based membranes may also found application in the energy storage field, for increasing the
70
safety of high temperature operating Li-ion batteries, for example [21].
71
The nano-morphology of PEM materials, and together with this the elucidation of water
72
domains and conductive paths at microscopic level, are a highly debated topic. Even in the case of
73
Nafion several microstructural models are still under consideration [22]. In a previous work [23] we
74
reported a detailed microstructural characterization of highly sulfonated membranes (above 50%
75
sulfonation degree) based on an s-sPS -clathrate co-crystalline form [24, 25]). The microstructural
76
characterization was carried out by small-angle neutron scattering (SANS) during the complex
77
preparation procedure of the membranes, from the production of the sPS film samples in -form
78
followed by clathration with toluene guest molecules (to yield the -form [26]), sulfonation and
79
in-situ hydration under controlled relative humidity (RH) by using a humidity chamber (Anton
80
Paar). The use of uniaxially deformed sPS films enabled the assignment of the scattering signals
81
observed on different sectors of the SANS detector to specific morphologies that formed and
82
evolved in the sample during the clathration, sulfonation and hydration/dehydration processes.
83
Besides the structural characterization of the crystalline lamellar stacks and the water cluster
84
morphologies evolving in the amorphous regions with increasing the RH, information on the
85
mechanical strength and stability of the membranes due to preservation of crystallinity could be
86
assumed from the interpretation of the SANS data and confirmed at a later time in subsequent
87
experiments by wide-angle X-ray diffraction (WAXD).
88
In this paper we report a structural investigation by contrast variation SANS on uniaxially
89
deformed s-sPS films containing the crystalline -form that were prepared with different degrees of
90
sulfonation. The films were loaded with fullerenes, in order to reproduce the conditions proposed
91
for such materials to reach the optimal chemical stability in PEMFC environment. The SANS
92
experiments were carried out over a wide wave-vector transfer Q-range, between 0.001 and 2 Å-1,
93
which enabled the observation of scattering features from morphologies and structures formed at
94
very different length scales in the membranes, such as the 010 crystalline peak of the crystalline
lattice characteristic of the lamellae in the crystalline domains, the ionomeric peak representing the
96
structural correlation length for the ionic hydrophilic domains in the amorphous regions, the
97
inter-lamellar peak representing the correlation length between the crystalline lamellae, the form
98
factor of the water domains and the large scale fractal of the membranes. Thus, a very extended
99
length scale, from a few Å to nm, could be explored in this investigation. Due to the uni-axially
100
deformation of the films, some of the scattering details from these morphologies appear distributed
101
on specific detector sectors, like the features characteristic of crystalline domains: the 010 crystalline
102
peaks appear on equatorial sectors while the inter-lamellar peaks in the meridian sectors direction.
103
Other morphologies yield scattering that is isotropically distributed over the detection area, like the
104
features from the amorphous regions, thus the ionomer peak and the water domains form factor. A
105
schematic view of the experimental geometry approach used in this study and of the novelty we
106
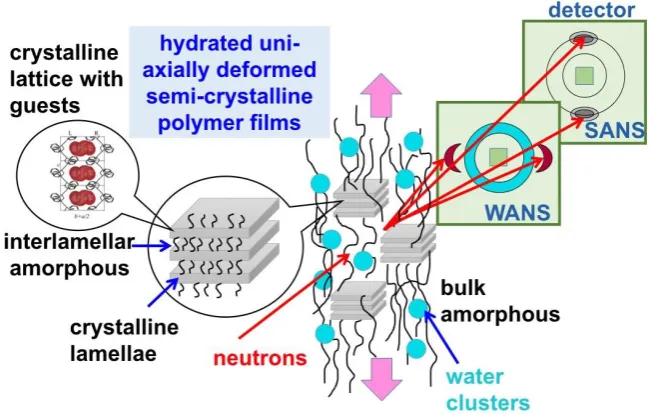
have implemented compared to our previous approach [23] is shown in Figure 1.
107
108
109
Figure 1. Schematic view of the experimental approach used in this study: the uni-axially polymer
110
film deformation is indicated by the pink arrows while the morphologies occurring at different
111
length scales, which are shown in the left side of the scheme, yield on the two-dimensional SANS
112
detector scattering features that appear at different scattering angles, either in the wide-angle
113
(WANS) or small-angle (SANS) regime, as isotropic or localized details.
114
115
In order to minimize the SANS incoherent background, deuterated sPS films have been used in
116
the study. Contrast variation method was involved to vary the scattering length density (SLD) of
117
different film components in a controlled way, i.e. by using either deuterated or protonated species
118
for the guest molecules in the crystalline regions, or different H2O/D2O mixtures for the hydration of
119
the membranes. Thus, the formation and evolution of all these morphologies during hydration
120
process could be fully understood following the model interpretation of the scattering curves, which
121
were averaged over the meridian and equatorial sectors for each contrast condition.
122
2. Materials and Methods
123
2.1. Materials
124
The preparation and subsequent treatment – clathration, sulfonation, guest-exchange in the
125
crystalline region – of uni-axially deformed deuterated syndiotactic polystyrene films were done
126
following a procedure that is extensively described in [23]. Films with variable degree of sulfonation
127
were produced via so-called solid-state sulfonation procedure that allowed a uniform sulfonation of
128
the phenyl rings of the amorphous phase and preserved the crystalline -form [16]. The thickness of
the films was about 100 m. To vary the neutron scattering contrast, either deuterated or protonated
130
toluene were loaded as guest in the clathrate form, either before or after sulfonation, by dipping the
131
films for 1 day in solvent, followed by drying at 40 °C under vacuum for a couple of hours.
132
Fullerenes C60 or C70 were uploaded in some of the s-sPS membranes by dipping the samples for
133
more than three weeks in saturated solution of fullerenes and protonated toluene. Two selected
134
films of different composition were subjected during the SANS experiments to in-situ controlled
135
hydration under vapors of different H2O/D2O mixtures, by using a humidity chamber [23]. All
136
reagents were purchased from Sigma-Aldrich and used as received. The D2O was obtained from
137
Cambridge Isotope Laboratories (purity D 99.8%).
138
139
2.2. Methods
140
141
The degree of sulfonation was checked at the neutron prompt-gamma activation analysis
142
(PGAA) instrument of Technical University München (TUM) installed at the Heinz Maier-Leibnitz
143
Zentrum (MLZ), Garching, Germany. Description of the experimental method and data
144
interpretation can be found in [23].
145
Qualitative and quantitative analysis of the sulfonation, the loading with fullerenes and the
146
crystallinity of the s-sPS films was checked by FTIR using a PerkinElmer (Spectrum Two)
147
spectrometer equipped with a TGS detector. The scanned wavenumber range was 4000 - 400 cm-1.
148
WAXD analysis of sulfonated films with and without fullerenes added was done prior to the
149
SANS experiments in the range of 2 between 5° and 35° by means of an X-ray powder
150
diffractometer Brucker 2nd Gen-D2 Phaser (Cu-source) of Jülich Centre for Neutron Science (JCNS) at
151
MLZ.
152
UV-Vis analysis of the same films was carried out with a Cary 100 SCAN UV-Vis Varian
153
spectrometer of JCNS at MLZ with the films placed in a specific holder with quartz windows. The
154
spectra were collected in the range 200-800 nm at a resolution of 100 nm/min.
155
Preliminary SANS measurements were carried out at the KWS-2 high intensity / extended-Q
156
range pinhole SANS diffractometer of JCNS at MLZ [27]. A Q-range between 0.02 and 0.7 Å-1 was
157
covered in this preparatory experiments by using two sample-to-detector distances, LD=1.5 m and 4
158
m and a neutron wavelength =4.5 Å. The film samples were placed in beam by means of
159
sandwich-type cells with Quarz windows.
160
161
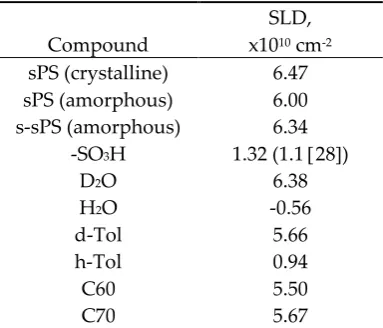
Table 1. The calculated SLD for different components of the s-sPS films.
162
Compound
SLD, x1010 cm-2 sPS (crystalline) 6.47
sPS (amorphous) 6.00
s-sPS (amorphous) 6.34 -SO3H 1.32 (1.1 28)
D2O 6.38
H2O -0.56
d-Tol 5.66
h-Tol 0.94
C60 5.50
C70 5.67
163
Extended Q-range SANS experiments have been performed at the time-of-flight (TOF) SANS
164
diffractometer TAIKAN, at the Material and Life Science Experimental Facility (MLF) of the Japan
165
Proton Accelerator Research Facility (J-PARC), Tokai, Japan [29]. A Q-range between 0.008 and 2 Å-1
166
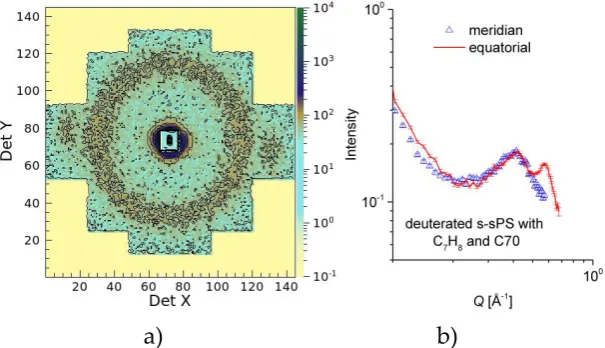
was covered by using a broad neutron wavelength range = 0.7 to 7.8 Å and the simultaneous use of
only the small-angle and middle-angle detector banks (due to restrictions imposed by the sample
168
environment). Involving the additional use of the wide-angle and back-scattering detector banks,
169
which are available at this instrument too, a Qmax=20 Å-1 could be otherwise reached in a single
170
measurement for a sample geometry that would allow detection of the scattered neutrons in a wide
171
angular range. At TAIKAN the film samples were exposed to in-situ controlled hydration within the
172
range RH = 50% to 80% by the mean of an Anton-Paar humidity chamber [23]. Contrast variation
173
SANS measurements were carried out by exposing the sample to mixed H2O/D2O vapors for
174
different ratios of the two components at RH = 80%.
175
At both SANS instruments the raw data was treated by standard corrections and reduction
176
procedure [27, 29] and then calibrated in absolute units by using a Plexiglas (at KWS-2) or a
177
glassy-carbon (at TAIKAN) secondary standard. The corrected and calibrated 2D data were
178
integrated into one-dimensional intensity over equatorial or meridian sectors of a 20° width. The
179
SLD for different compounds in the s-sPS film morphology are listed in Table 1, as it was calculated
180
or taken from literature.
181
182
2.3. Data analysis
183
184
Supposing we have N identical particles of volume Vp, which are located at random positions
185
and random orientations in the sample, then NVp=Vsample, where is the volume fraction of the
186
scattering particles in the sample. The contribution to the small-angle scattering intensity from these
187
particles that are decorated with a constant contrast factor is
188
I(Q) = ϕ Δρ2 V
p P(Q) S(Q) + Bckgd (1)
189
where P(Q) represents the particle form factor, which relates to the intra-particle correlations,
190
and S(Q) the structure factor, which denotes the inter-particle correlation effects. The contrast
191
=p-env is the difference between the SLD of the scattering particles p and their environment env,
192
where the environment can be a solvent, a film, or a metallic matrix. Usually, the factor (2 Vp) is
193
called the “forward scattering” I0 from the ensemble of scattering particles. The term Bckgd
194
represents a constant background, which arises mostly from the incoherent scattering contribution
195
and can be observed as a constant level at high Q.
196
In the current study we used the combination of the form factor and the structure factor to
197
describe the scattering from the water domains in the amorphous phase of the s-sPS films and the
198
lamellar stacks in the crystalline regions. For the water clusters the spherical form factor
199
Psph(Q) = [3
sin(QR)−QR cos (QR)
(QR)2 ] 2
(2)
200
was combined with the hard-sphere structure factor [29]
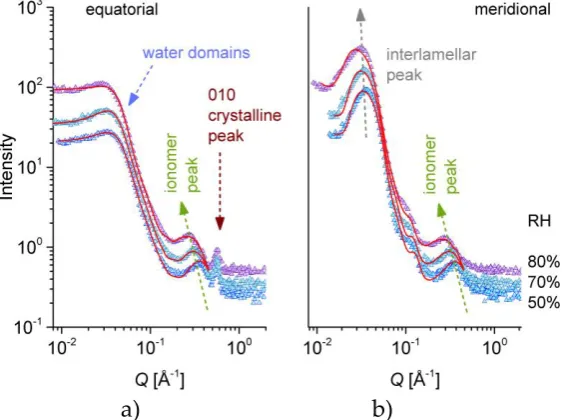
201
S(Q, RHS) = [1 + 24 ηHS G(RHSQ)/(RHSQ)]−1 (3)
202
where R is the radius of the spherical cluster, RHS the “hard sphere” radius of the interaction
203
potential and HS the volume fraction of hard spheres. The function G(RHSQ) has a complicated
204
analytical dependence on HS [30]. The lamellar stacks consisting of oriented crystalline lamellae that
205
alternate with amorphous inter-lamellar regions was described by the two-dimensional
206
crystalline-amorphous form factor [31], where crystalline lamellae have amorphous layers attached
207
on both faces:
208
Plam(Q) = (ΔρcrPcr(Q) + ΔρamPam(Q))2
D(QRl/2)
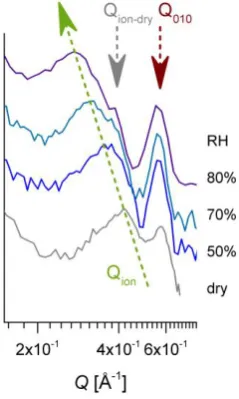
(QRl/2) (πRl
2)2 (4)
209
in combination with the paracrystalline structure factor
210
Spara(Q) =
sinh (Q2σD2/4) cosh(Q2σ
D
2/4)−cos (QL
D) (5)
where LD is the inter-lamellar distance (periodicity), D its dispersion and Rl the lateral size of
212
the lamellae. Because we are dealing here with a ternary system consisting of the crystalline
213
lamellae, the inter-lamellar amorphous region and the surrounding bulk amorphous region, the
214
contrast factor from Eq. 1 was included in the form factor definition in Eq. 4, with the aim to express
215
the difference in SLD between these three components. The Dawson function D(u) exhibits the
216
following asymptotic behavior: for u, 2D(u)1/u2 and for u0, D(u)/u1. The partial form
217
factor of the crystalline lamellae Pcr(Q) is given by
218
Pcr(Q) = [ sin (Qd
2) (Qd2) ]
2
(6)
219
with d – the lamellar thickness, while the partial form factor of the inter-lamellar amorphous
220
layers Pam(Q) has a complicated analytical definition [31] that depends on both the lamellar thickness
221
d and the thickness of the inter-lamellar layer Lb. Hence, LD=d+Lb. The SLD for three distinct regions
222
of the modeled morphology were explicitly considered in the fitting procedure: lam – the SLD of the
223
crystalline sPS, inter-lam – the SLD of the sulfonated inter-lamellar amorphous region, and bulk – the
224
SLD of the sulfonated bulk amorphous region. Thus, the contrast factors in Eq. 4 are cr = lam - bulk
225
and am = inter-lam - bulk. These three regions are affected in a different way by hydration. The bulk
226
and inter-lamellar amorphous regions are hydrated, so they swell upon water uploading, as
227
reported before [23]. Therefore their SLD is changed according to
228
𝜌𝑏𝑢𝑙𝑘, 𝑖𝑛𝑡𝑒𝑟−𝑙𝑎𝑚= (𝜙𝑝𝑜𝑙𝜌𝑠−𝑠𝑃𝑆+ 𝜙𝑤𝑎𝑡𝑒𝑟𝜌𝑤𝑎𝑡𝑒𝑟) (7)
229
with s-sPS and water – the SLD for the sulfonated polymer and the H2O, D2O or H2O/D2O
230
mixtures, as defined in Table 1, and pol and water – the volume fractions of polymer and hydrated
231
water in the swollen amorphous regions. Disregarding the free volume in the amorphous polymer,
232
which typically is very small [32], we can roughly assume that water = 1 – pol in these regions.
233
The global water fraction in the amorphous phase can be determined from the interpretation of
234
the “forward scattering” from the water domains. However, there is an unknown partition of water
235
between the bulk and inter-lamellar amorphous regions. Moreover, due to the loading with guest
236
molecules, either protonated toluene or fullerenes, the SLD of the lamellar region is lower than that
237
of the crystalline sPS (Table 1). Therefore, in the fitting procedure of the experimental data from the
238
lamellar stacks (Eq. 1, 4-6), the SLD parameters lam and inter-lam were considered free parameters.
239
The bulk in this procedure was considered that of the amorphous sPS (Table 1). This is a reasonable
240
assumption if we consider that the sulfonated segments of the sPS chains in the bulk region are
241
contained in the water domains, thus not affecting the SLD of the amorphous segments in the
242
vicinity of the lamellar stacks. The obtained value for inter-lam was further used for rationalization on
243
the polymer volume fraction and water content in the inter-lamellar amorphous regions (Eq. 7). On
244
the other hand, the crystalline lamellae are not hydrated therefore the lam delivered by the fitting
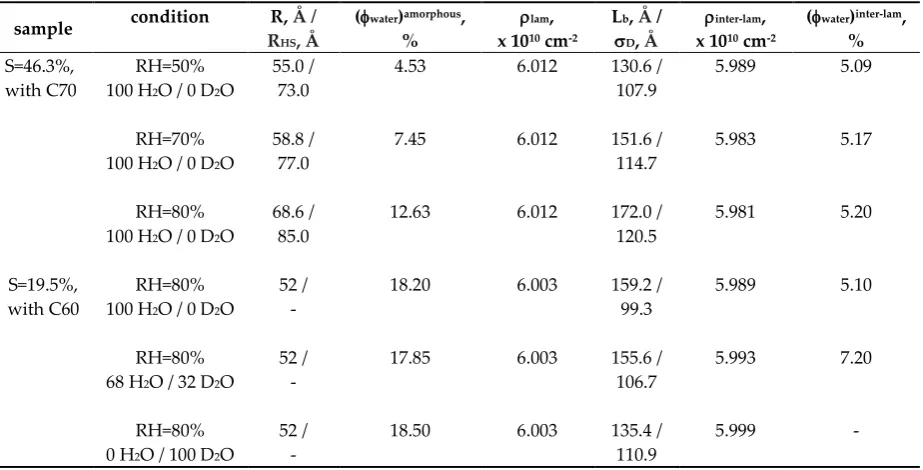
245
procedure was used for the estimation of the amount of guest molecule included in the crystalline
246
region, in a similar way as shown in Eq. 7, with the guest molecule instead of water. According to
247
[25], the amount of guest molecules included in the crystalline region may vary up to about 9% in
248
case of -clathrate form. Therefore, the SLD of the crystalline region in our films may decrease from
249
the value reported in Table 1 for the crystalline sPS up to lam=5.9x1010 cm-2, taking into account the
250
contribution of the protonated toluene to the overall SLD of the crystalline region.
251
3. Results and Discussion
252
3.1. Composition and crystallinity characterization.
253
254
From the quantitative point of view, PGAA delivered the S/C ratio of 0.065 and 0.155 for the
255
two uni-axially deformed sPS films studied in this work. Following the method reported in [33],
256
which was used also in our previous study [23], sulfonation degrees of S=19.5 % and 46.3 % (molar
fraction of sulfonated monomer units) were determined for the samples which were later subjects of
258
doping with C60 and C70 fullerenes, respectively.
259
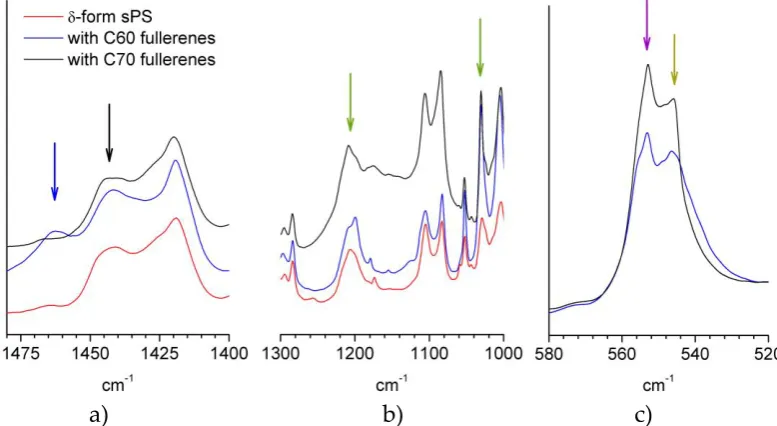
The FTIR spectra of these films doped with C60 (blue curves) or C70 (black curves) fullerenes
260
are shown in Figure 2 in parallel to that from a -form sPS film (red curve). The regions of fullerenes
261
(Figure 2a) and of symmetric and asymmetric stretching of SO3- group (Figure 2b) were selected
262
from the whole FTIR spectra collected from these samples. The bands corresponding to the sulfonic
263
group were observed at around 1240 and 1040 cm-1, which is in good agreement with early reports
264
on sulfonated copolymers [34, 35]. Due to the multitude of characteristic bands of sPS, only some of
265
the characteristic bands to C60 and C70 may be observed in the region 1440-1470 cm-1. Experimental
266
FTIR characterization of fullerenes in bulk or functionalized polymers can be found in [36] for C60 or
267
[37] for C70, while theoretical calculations were done in [38]. From the evaluation of the bands that
268
are characteristic to crystalline and amorphous sPS, a satisfactory estimation of the amount of
269
polymer in the ordered TTGG sequences in the co-crystalline film samples can be obtained following
270
the procedure described in [39]. Thus, a rough idea about the crystallinity of the sample can be
271
obtained. Information about the FTIR spectra from deuterated sPS either in film or solution/gel
272
samples is very scarce in literature. Therefore, for this exercise we considered the bands in the range
273
500-600 cm-1, a range that was never discussed before in the case of the deuterated sPS system and,
274
which, according to our investigations on crystallization from solution (results to be published
275
soon), contains information about either the helical or amorphous polymer chain conformation.
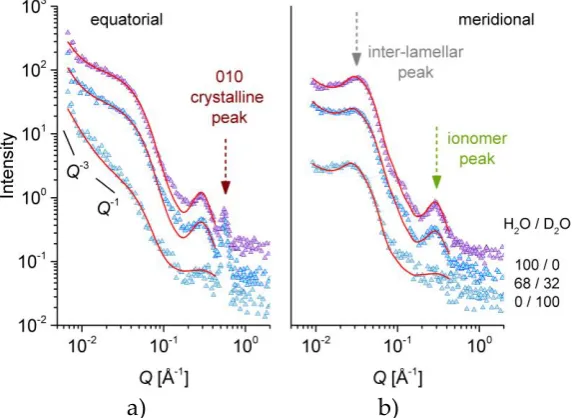
276
Figure 2c shows two peaks for each sample, which can be assigned to the sPS in crystalline (556 cm-1)
277
or amorphous (545 cm-1) phases. From the interpretation of the areas of the peaks, the fraction of
278
conformationally ordered polymer is about 35% and 22% for the films with higher sulfonation
279
degree (loaded with C70) and lower sulfonation degree (loaded with C60), respectively.
280
281
282
a)
b)
c)
283
Figure 2. FTIR spectra from different sPS films: -form (red line), sulfonated and loaded with C60
284
fullerenes (blue line); sulfonated and loaded with C70 fullerenes (black line). The regions with
285
fullerenes bands (C60 – blue arrow; C70 – black arrow) and sulfonic ionic group group bands (green
286
arrows) are shown in the panels a) and b), respectively. Panel c) shows the bands characteristic of
287
sPS: the arrows indicate the peaks that were considered to correspond to chain conformations in
288
crystalline (purple) and amorphous (dark yellow) phases.
289
290
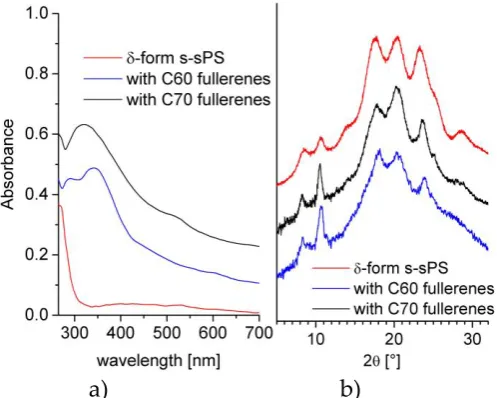
In Figure 3a, UV-Vis absorption spectra of the three samples are shown in parallel. Unlike the
291
case of the -form s-sPS film, two spectral features are observed for the samples containing
292
fullerenes: at around 330 nm (peak) and 400 nm (shoulder like) for the film doped with C60, and
293
around 320 and 500 nm for the sample with C70, as a prominent and a weak peak, respectively.
These observations are also in good agreement with reported results in [36, 40, 41]. The PGAA, FTIR
295
and UV-Vis results confirmed the successful sulfonation and loading of the sPS membranes with
296
either C60 or C70 fullerenes.
297
WAXD spectra from the s-sPS films containing fullerenes are presented in the Figure 3b in
298
parallel with the pattern from the s-sPS film with only protonated toluene loaded in the crystalline
299
regions (clathrates). The pair of peaks at around 8° and 10° in 2 is indicative for the formation of the
300
crystalline -form of the clathrates [24, 42]. The presence of these peaks in the patterns collected on
301
the samples loaded with fullerenes indicates that the sPS crystalline habit is preserved in these
302
samples too. Their slight enhancement when C60 or C70 fullerenes were added may relate to
303
anchoring of the fullerenes to the sPS chains, as it was discussed in [42]. Because the detailed
304
analysis of WAXD spectra and of fullerenes behavior in s-sPS films is beyond the goal of this work,
305
we limit ourselves here to a qualitative conclusion. Based on the characterization methods applied
306
prior to SANS on our samples, we can confirm the presence of the crystalline -form in all films and
307
the loading of samples with fullerenes, and we may only suppose that in some of the cavities
308
between the sPS helices in the crystalline region the protonated toluene initial guest was replaced by
309
the fullerenes.
310
311
312
a)
b)
313
Figure 3. UV-Vis (a) and WAXS (b) spectra from different sPS films. The lines indicate sulfonated
314
film with crystalline -form (red line), sulfonated (with crystalline -form) and loaded with C60
315
fullerenes (blue line); sulfonated (with crystalline -form) and loaded with C70 fullerenes (black
316
line).
317
318
3.2. SANS on dry films
319
320
The main objective of this work is the microstructural characterization of the s-sPS membranes
321
under hydration and the understanding of the formation and evolution of morphologies at nano-
322
and meso-scale. In our previous study [23] we discussed the indirect observation on the preservation
323
of crystallinity in such systems during the chemical treatment and hydration procedures. A direct
324
observation of this effect together with a detailed microstructural characterization of the membranes
325
over a wide length scale can be achieved by using the contrast variation SANS over a wide Q-range.
326
This enables the collection of the scattering features from the crystalline ordering in the range of
327
nanometers up to the micrometer size large-scale domains in one experiment. For this purpose, the
328
novel approach that involves careful SANS measurements at high angle was checked first at the
329
KWS-2 SANS instrument in combination with the contrast variation method on two -clathrate sPS
films with toluene as guest in the cavities between the polymer helices: one film was investigated as
331
produced, while the other one after subsequent sulfonation and loading with C70 fullerenes.
332
In Figure 4 the scattering patterns from the uni-axially deformed sPS film containing clathrate
333
co-crystalline -form with either protonated toluene or deuterated toluene are shown in
334
two-dimensional (Figures 4a and b) and one-dimensional (Figure 4c) presentations, respectively,
335
following the averaging over the meridian and equatorial sectors. In Figure 4a two strong maxima
336
can be observed in equatorial sectors at high angles while two local maxima can be distinguished at
337
low scattering angles in meridian direction, above and below the beam-stop, which is visible in the
338
middle of the detector. These are the 010 reflections appearing on the equator and the inter-lamellar
339
reflections on the meridian, respectively, as depicted in the sketch presented in Figure 1. In Figure 4b
340
these features are either barely observable (the 010 reflections) or vanished (the inter-lamellar
341
reflections). These features are also depicted by the one-dimensional patterns in Figure 4c. The 010
342
reflections are yielded by the correlation between polymer sheets that sandwich in between the
343
guest molecules. The SLD of deuterated crystalline sPS is =6.47x1010 cm-2, while that of the toluene
344
is =0.94x1010 cm-2 and =5.66x1010 cm-2 for the protonated and deuterated species, respectively.
345
Thus, protonated toluene molecules hosted between deuterated sPS helices is providing a high
346
neutron contrast, which evidences at best the correlation between 010 planes (see Figure 1, the
347
crystalline lattice details). In case of using deuterated toluene guests, the neutron contrast is much
348
lower and the peaks on the equator become less obvious in the scattering pattern.
349
On the other hand, the inter-lamellar correlation peaks appear due to the difference in SLD
350
between the amorphous and crystalline regions of the sPS co-crystals with guest molecules. The SLD
351
of the amorphous sPS is =6x1010 cm-2. Loading the crystalline regions with protonated toluene will
352
provide those regions with a lower SLD than the inter-lamellar amorphous regions, which will
353
evidence the inter-lamellar correlations. Contrariwise, by using deuterated toluene the difference in
354
SLD between the crystalline lamellae and inter-lamellar amorphous regions will become much
355
smaller than in the case of using protonated toluene, which will have as consequence the vanishing
356
of the inter-lamellar peaks on the meridian direction in the scattering patterns. Detailed SANS
357
studies on the exchange of small guest molecules in sPS co-crystals are reported in [26, 43].
358
359
360
361
a)
b)
c)
362
Figure 4. Two-dimensional SANS patterns from a deuterated sPS film clathrated with protonated
363
toluene (a) or deuterated toluene (b), respectively, and the one-dimensional scattering profiles from
364
the same samples averaged over the equatorial (line) or meridian (symbol) directions, respectively
365
(c). The panels a) and b) show data collected at LD=2m while the experimental curves in panel c) were
366
obtained by merging data collected at LD=2m and 4m.
367
368
This contrast variation SANS investigation has proven that the status of the crystalline lattice
369
can be monitored during the s-sPS sample treatment by observing the scattering features yielded at
370
high angles. In Figure 5 we show the high Q scattering patterns from a dry s-sPS film. The film is
characterized by a high sulfonation degree (S=46.3%) and a crystallinity of roughly 35%, and was
372
clathrated with protonated toluene and subsequently loaded with C70 fullerenes. The data are
373
presented two-dimensionally (Figure 5a) and averaged over the equatorial and meridian sectors
374
(Figure 5b). The 010 reflections are well visible in the equatorial sectors, while the ionomer peak,
375
which for the dry membrane is indicative of the mean distance between the sulfonic ionic clusters
376
[44], shows an isotropic distribution. The inter-lamellar reflections appear at much lower Q values in
377
the case of the sulfonated samples, and are thus not visible in this experimental configuration. This is
378
due to the swelling of the inter-lamellar amorphous regions, as already reported in [23]. A
379
correlation distance of ion=2/Qion=14.95 Å was obtained from the evaluation of the ionomer peak
380
position in Q. This distance is smaller than the one determined for dry Nafion [45]. Taking into
381
account the fact that the neutron SLD of fullerenes is very different from that of protonated toluene,
382
but close to that of deuterated toluene [46], we may conclude that the replacement of the initial
383
protonated toluene guest in the deuterated sPS crystalline region by the subsequently loaded
384
fullerenes took place to a very small extent only, since the scattering features characteristic of the
385
crystalline lattice were not affected apparently. Otherwise, the 010 reflections should have been
386
reduced drastically, as in the case of using deuterated toluene as guest in the sPS co-crystals. Thus,
387
the scattering features from the crystalline regions in the s-sPS films can be still observed after the
388
loading of samples with fullerenes.
389
390
391
a)
b)
392
Figure 5. Two-dimensional SANS pattern from a dry s-sPS film containing the co-crystalline -phase
393
with protonated toluene and loaded with C70 fullerenes (a) and one-dimensional scattering profiles
394
from the same sample averaged over the equatorial (line) or meridian (symbol) directions,
395
respectively (b). All data were collected at LD=2m.
396
397
3.3. SANS on hydrated films – variation of hydration level.
398
399
With this information at hand, two s-sPS samples with different degree of sulfonation and
400
crystallinity, which were loaded with either C60 or C70, were investigated at the TOF SANS
401
diffractometer TAIKAN during hydration at different RH levels and with different mixtures of
402
H2O/D2O.
403
Figure 6 presents a selection of one-dimensional scattering data from the same s-sPS sample
404
that was discussed in Figure 5, and which was hydrated with H2O at different RH levels. The data
405
were averaged over the meridian and the equatorial sectors. The scattering patterns present three
406
distinct peak-like features, which are observable for all hydration levels. These features are
407
indicative of structural levels occurring at different length scales in the complex morphology of the
408
polymer films. In the high Q range, the 010 crystalline peak appears in the equatorial sectors at
around Q010=0.6 Å-1, as in the case of the sPS clathrates (Figure 4c) and the dry s-sPS sample (Figure
410
5b). This peak, which denotes a mean repeating distance between the sPS sheets of about 10-11 Å,
411
does not change its position and intensity with the increase of the RH. This observation led to the
412
conclusion that the hydration does not affect the crystalline structure. Again, the neutron contrast is
413
provided by the protonated toluene guest molecules, which occupy the cavities between the
414
deuterated s-PS helices to a larger extent.
415
The ionomer peak is present in data on both the meridian and equatorial sectors, as it represents
416
a scattering feature characteristic of the hydration occurring in amorphous regions and is thus
417
isotropically distributed on the detection area. The peak position Qion depends on the level of the
418
film hydration [47, 48], thus it moves towards lower values of Q with increasing the RH. A detailed
419
presentation of the high Q scattering range from dry and hydrated films is given in Figure 7. In our
420
sample, the correlation between the hydrated ionic clusters increases from about ion=14.95 Å for dry
421
film to about ion=23.7 Å for hydrated film at RH=80%. A close inspection of the ionomer peak profile
422
reveals a shoulder like feature on the high Q side of the peaks, which becomes clearer with
423
increasing the humidity, due to the shift of the peak position to lower Qs. The Q-position of this
424
shoulder seems to remain constant regardless the RH and corresponds to the Q-position of the
425
ionomer peak characteristic of dry membrane. Apparently, a part of the ionic clusters giving rise the
426
occurrence of the ionomer peak in dry conditions are still not hydrated even for higher RH values.
427
428
429
a)
b)
430
Figure 6. One-dimensional SANS patterns from the high sulfonated s-sPS film containing the
431
co-crystalline -phase with protonated toluene and loaded with C70 fullerenes hydrated at different
432
RH levels. Experimental data (symbols) averaged over the equatorial (a) or meridian (b) directions
433
are shown separately, with the lines corresponding to the model interpretation of the scattering
434
profiles, as discussed in text. The main structural features and their behavior with the variation of
435
RH are indicated.
436
437
In the low Q region the inter-lamellar peak characteristic of the oriented lamellar stacks (Figure
438
1) can be observed in the meridian scattering patterns. The peak position Qlam moves only slightly to
439
lower Q values in increasing the RH, and denotes an inter-lamellar correlation of about 170-200 Å.
440
On the other hand, the equatorial scattering patterns exhibit at low Q a kind of plateau and a
441
shoulder-like feature at around Q=0.05 Å-1, which resemble characteristics of weakly correlated
442
spherical morphologies. We suppose that they represent loosely correlated large hydrated regions
443
that include the ionic clusters. The scattering from these water domains should appear isotropically
444
on the detector. However, in the meridian sectors the scattering from the lamellar stacks is
445
superimposing over it.
The scattering from these sulfonated s-sPS films characterized by a high sulfonation degree and
447
a relatively high crystallinity, which are loaded with C70 fullerenes, resembles that from the
448
fullerene free s-sPS films discussed in [23]. We may conclude that the partition of fullerenes between
449
the amorphous and crystalline regions of these s-sPS films has a negligible effect on the scattering
450
properties of the samples. As qualitatively concluded before, the C70 fullerenes seem to be located
451
mostly in the amorphous regions rather than in the co-crystalline phase.
452
453
454
Figure 7. The high-Q range of the SANS patterns on equatorial direction reported in Figure 6. The
455
pattern from the membrane in dry state was added. The green arrow indicates the variation in the
456
position of the ionomer peak in increasing the hydration, the dark red arrow marks the 010 reflection
457
while the gray arrow points to the ionomer peak position characteristic of the membrane in dry state
458
459
On the other hand, the scattering from fullerenes dissolved in solution or amorphous polymer
460
environment, like the deuterated polystyrene in the present case, is very weak [49], therefore we can
461
consider it negligible compared to the contribution from other morphologies that are formed and
462
evolve in our samples during sulfonation and hydration processes. The experimental results in
463
Figure 6 were interpreted via structural models: the data on equatorial sectors were described by Eq.
464
1-3 while the meridian patterns were described by a superposition of scattering from spherical
465
domains and lamellar stacks (Eq. 4-6). The water domains were characterized by spherical form
466
factor combined with the hard-sphere structure factor, an approach that is usually involved in
467
interpretation of scattering data from spherical polymeric micelles [50, 51], but is applied also in the
468
characterization of ionic aggregates in PEMs by scattering methods [52, 53]. Thus, four free
469
parameters are used for describing the scattering from water domains in the Q range between 0.008
470
and 0.2 Å-1 according to Eq. 1-3, namely the “forward scattering” (I0)sph from the ensemble of the
471
spherical water domains, the radius R of these domains, the hard sphere volume fraction HS and the
472
hard-sphere radius RHS. Additionally, we added a Gaussian term for the description of the ionomer
473
peak at high Q and the constant background (Eq. 1). The three parameters of the Gaussian function
474
describing the ionomer peak – amplitude, width and position – were left free during the fitting
475
procedure, while the background was kept fixed, as given by the flat behavior of the scattering
476
curves in the high Q range. The ionomer peak description was included in the model because of its
477
presence in the meridian pattern too, which will help for an accurate modeling of these data in a
478
subsequent step. The 010 peak was excluded from the fitting procedure. Despite the multitude of
479
parameters, we consider that the fitting procedure offers reliable results, because the two structures
480
that are modeled appear at very different length scales, therefore without influencing one another to
481
a significant extent. On the other hand, if only the form factor is used for modeling the water
482
domains, the experimental data cannot be properly described. The weak correlation effects between
the water domains seem to be a consequence of the high sulfonation degree of this sample, when
484
water clusters are densely formed in the amorphous region. A detailed discussion about formation,
485
growth and percolation of water clusters as a function of hydration level and functionalization of
486
PEMs can by found in [9, 54].
487
Of a direct interest for the characterization of our system is the “forward scattering” from the
488
ensemble of the spherical water domains and the size of these domains. We should note that a large
489
polydispersity in size (R20%) of the water domains had to be considered in the fitting procedure in
490
order to obtain a good fit in the Q region 0.1-0.2 Å-1. Knowing the size and the SLD of the scattering
491
objects – the water domains, and the SLD of their environment – the sulfonated segments of s-sPS
492
(Table 1), we could extract information about the volume fraction sph occupied by the scattering
493
objects in the sample (Eq. 1), in a similar way as reported in [55]. The volume fraction occupied by
494
water in the whole amorphous region, (water)amorphous, is reported in Table 2. From the water volume
495
fraction in the sample volume estimated from the interpretation of the (I0)sph, the reported value for
496
each RH is obtained by taking into account the crystallinity of the film, which was estimated at 35%,
497
and the fact that only the amorphous regions are hydrated.
498
499
Table 2. The structural and scattering parameters of the hydrated and lamellar morphologies
500
delivered by the model interpretation of the experimental data according to Eq. 1-7.
501
sample condition R, Å /
RHS, Å
(water)amorphous, %
lam, x 1010 cm-2
Lb, Å / D, Å
inter-lam, x 1010 cm-2
(water)inter-lam, %
S=46.3%, with C70
RH=50% 100 H2O / 0 D2O
55.0 / 73.0
4.53 6.012 130.6 / 107.9
5.989 5.09
RH=70% 100 H2O / 0 D2O
58.8 / 77.0
7.45 6.012 151.6 / 114.7
5.983 5.17
RH=80% 100 H2O / 0 D2O
68.6 / 85.0
12.63 6.012 172.0 / 120.5
5.981 5.20
S=19.5%, with C60
RH=80% 100 H2O / 0 D2O
52 / -
18.20 6.003 159.2 / 99.3
5.989 5.10
RH=80% 68 H2O / 32 D2O
52 / -
17.85 6.003 155.6 / 106.7
5.993 7.20
RH=80% 0 H2O / 100 D2O
52 / -
18.50 6.003 135.4 / 110.9
5.999 -
502
The data measured on the meridian sector were modeled for a morphology consisting of
503
oriented crystalline-amorphous lamellar stacks, which are “embedded” in a bulk amorphous
504
environment (Figure 1). The scattering was described by combining the Eq. 1 and 4-6 and was
505
superimposed over the scattering from water domains (including the ionomer peak contribution),
506
which is isotropic and is known from the model interpretation of the equatorial data. Assuming a
507
very large lateral extension of the lamellae, Rl > 1000 Å, thus out of the size domain that is covered by
508
the SANS window, and a constant thickness of the crystalline lamellae d=60 Å, an average value of
509
what is reported in literature for sPS crystals with different degrees of crystallinity and subjected to
510
different treatments [56], only two free size parameters were used in the fitting procedure, namely
511
the thickness of the inter-lamellar layer, Lb, and the dispersion (smearing) parameter, D, of the
512
inter-lamellar spacing, LD=d+Lb. As discussed in Section 2.3, the SLD of the crystalline and
513
inter-lamellar amorphous layers, lam and inter-lam, were considered free during the fitting procedure
514
while that of the bulk region bulk was considered that of the amorphous sPS (Table 1). Finally, the
515
volume fraction of lamellar stacks in Eq. 1 was considered fixed and taken from the assumed
516
crystalline degree of the material (35%).
All three experimental curves in Figure 6b were modeled simultaneously. Since the crystalline
518
lamellae are not changing during hydration, the lam free parameter was considered the same for all
519
curves while the other free parameters were left to vary specifically to each RH condition. The model
520
lines in Figure 6b are describing rather well the experimental data and the fitting procedure
521
delivered the main parameters reported in Table 2. As we already noted, the sulfonation of the
522
amorphous regions in the sPS film induced a swelling of the inter-lamellar domains in comparison
523
with the non-sulfonated films, as reported in [23], so slightly larger value for the thickness of the
524
inter-lamellar layer Lb, hence the inter-lamellar spacing LD, as reported in the literature for the sPS
525
crystals was obtained in our case. This quantitative analysis indicates a certain swelling of the
526
inter-lamellar regions with increasing hydration, deduced from the slight increase in the thickness of
527
the inter-lamellar layer Lb. However, we should note that the model interpretation of the current
528
data indicates also an increase in the smearing D of the fitted inter-lamellar correlation distance
529
between the oriented lamellae LD=d+Lb, which makes the actual swelling of the amorphous
530
inter-lamellar layer difficult to assess.
531
To obtain semi-quantitative information about the volume fraction of water accumulated in the
532
inter-lamellar amorphous region, the fitted SLD was further interpreted based on the assumptions
533
made on the polymer and water volume fractions in these regions (Section 2.3). Thus, at low
534
hydration level the water fraction in the inter-lamellar space is rather similar to that in the whole
535
amorphous regions of the film sample. With increasing RH the water domains grow in size and
536
number apparently (Table 2). From the evaluated values for (water)amorphous and (water)inter-lam we can
537
conclude that the formation and growth of the water domains with increasing hydration seem to
538
happen almost only in the amorphous bulk region while the water volume fraction in the
539
inter-lamellar amorphous layers remains quite constant. This may explain also the aspect of the
540
ionomer peak (Figure 7), due to ionic clusters that are remaining dry still at high RH values. Also,
541
keeping in mind that the hydrated regions are characterized by a large polydispersity in size, we can
542
assume that smaller water domains are present in the inter-lamellar regions compared to the bulk
543
regions. These effects may be caused by the increased flexibility of the sPS chains in the bulk
544
amorphous domains compared to that of the amorphous sPS chains between the crystalline
545
lamellae, which favors the formation and growth of water domains mostly in the bulk amorphous
546
region. For very high hydration levels, RH>85%, a growth and percolation of water domains takes
547
place in the bulk region, which ultimately leads to changes in the orientation and position of lamellar
548
stacks, as reported before [23]. The preservation of the lamellar stacks arrangements even at very
549
high hydration level (saturation) is indicative of the lower water uptake in the inter-lamellar
550
amorphous regions as in the bulk amorphous ones.
551
Finally, the fitting procedure delivered the value lam=6.012x1010 cm-2 for the SLD of the
552
crystalline lamellae, a value which is lower than that of crystalline sPS (Table 1). If we consider that
553
the sPS lamellae are loaded with protonated toluene guest, from the interpretation of the fitted value
554
we obtain a volume fraction of about 8.2% protonated toluene hosted between the sPS helices in the
555
crystalline region, a value in very good agreement with what is reported in literature [25].
556
557
3.4. SANS on hydrated films – neutron contrast variation.
558
559
The equatorial and meridional scattering patterns from the s-sPS film with a low degree of
560
sulfonation (S=19.3%) and lower crystallinity (22%), which was loaded with C60 fullerenes, are
561
presented in Figure 8 as they were collected at a constant hydration level, RH=80%, which was
562
achieved by using different H2O/D2O mixtures. Three neutron contrast conditions corresponding to
563
the H2O/D2O ratios (vol%) of 100/0, 68/32 and 0/100 were investigated. The middle ratio corresponds
564
to the matching of the calculated SLD for the sulfonic acid terminal group (SO3H).
565
For the 100/0 H2O/D2O case, the same scattering features as in the case of the sample with a high
566
degree of sulfonation (Figure 6) can be observed: the 010 crystalline peak that is revealed only in the
567
equator direction, the isotropic ionomer peak that is visible in both the equatorial and meridian
scattering patterns and the inter-lamellar peak that is observed only in the meridian direction, at a
569
lower Q value than the ionomer peak. The profile of the inter-lamellar correlation peak is not as
570
strong as in the case of the sample with higher sulfonation degree (Figure 6), which may be due to
571
the lower crystallinity in the present sample. Unlike for the high sulfonation degree sample, in the
572
present case the scattering from the water domains (equatorial sectors) does not show a shoulder
573
like feature at around Q=0.05 Å-1. Instead, a strong upturn appears towards lower Qs. A similar
574
feature was observed in the very low Q region of the scattering patterns from highly sulfonated films
575
[23]. The absence of the shoulder like feature indicates that there is no correlation effect between the
576
water domains. This may be due to the lower sulfonation degree in the present sample, which makes
577
the water domains to form and grow in the amorphous regions well separated from each other. On
578
the other hand, the upturn at low Q, which appears stronger on the equator direction due to
579
stretching of sample on vertical axis, arises from the large-scale fractal-like character of the
580
membranes. This feature is not visible towards low Q in the patterns reported in Figure 6. This may
581
be a consequence of the stronger correlation effects between the lamellae in the stack in that case: the
582
strong structure factor peak induces an intensity drop towards low Q and consequently the intensity
583
upturn is becoming observable at lower Q values. The intensity upturn at low Q can be described by
584
a power law [23, 31], which should be added to the model equations that are used for fitting the
585
experimental data, but is less important for the data interpretation in this work. The 70/30 H2O/D2O
586
data show basically the same scattering features that are shown by the 100/0 H2O/D2O patterns, only
587
the global intensity is lower, due to lower contrast achieved between hydrated and non-hydrated
588
components of the film morphology. No matching of any scattering feature is visible. The data
589
measured under the 0/100 H2O/D2O contrast show a different behavior from the other two contrast
590
conditions. The first striking effect is the vanishing of the ionomer peak. We assume that the
591
matching of the scattering properties of ionic clusters and surrounding water is achieved, which
592
renders the correlation between the ionic clusters not anymore visible. From this observation, a very
593
important conclusion may be drawn: the ionic clusters that are promoting the water uptake by the
594
membrane consist of an association of larger sections of neighboring s-sPS chains in the region of the
595
benzene ring and the sulfonic acid terminal group, which are correlated over the distance 2/Qion.
596
With increasing hydration, the water domain grows and the correlation distance between these
597
groups increases. The correlation effects are vanishing in the scattering patterns when the hydration
598
medium has a similar SLD to that of the sulfonated sPS segment, which is roughly the D2O case.
599
Another peculiarity of the scattering data in this contrast condition is the low Q behavior, where
600
a Q-1 power law behavior of the scattered intensity may be roughly identified in the equatorial
601
profile, rather than the spherical form factor profile combined with a low-Q steeper power law
602
feature, as for the other contrast conditions or the case of the highly sulfonated sample [23]. The Q-1
603
power law behavior is indicative of one-dimensional structures present in the sample. If we consider
604
that the water accumulates along groups of elongated s-sPS chains in the amorphous region, this
605
will highlight the hydrated regions as one-dimensional arrangements in contrast to the surrounding
606
crystalline or non-sulfonated sPS environment, which is in agreement with the observed scattering
607
behavior.
608
The interpretation of the experimental data was done in a similar way as for the sPS film with
609
higher sulfonation degree (Figure 6). The equatorial data were described by the combination of a
610
spherical form factor of the water clusters (Eq. 2) and a Gaussian feature of the ionomer peak. An
611
additional Q-3 power-law term was added to describe the low-Q data behavior. The meridian data
612
were fitted by a superposition of the scattering features from the water clusters and the correlated
613
lamellar stacks (Eq. 4-6). The modeling of the experimental data was quite successful and has
614
delivered the parameters reported in Table 2. For the description of the equatorial data only a
615
spherical form factor was considered, as no tracks of correlation between the water clusters was
616
observed. The experimental data were separately fitted on the equatorial sectors first, to obtain the
617
water domains parameters, and then on the meridian direction, simultaneously for all contrast
618
conditions. The fitting procedure was carried out as discussed in the Section 3.3. The Lb parameter
619
was fitted, but kept the same for all contrast condition, since they were measured at the same RH.