ENERGY USE AND CO
2
EMISSIONS IN
CHINA: RETROSPECT AND PROSPECT
PETER SHEEHAN AND FIONA SUN
Energy Use and CO
2Emissions in China: Retrospect
and Prospect
Peter Sheehan and Fiona Sun
Abstract
For more than two decades after the ‘opening to the market’ in 1979 China achieved rapid expansion with low growth in energy use, the energy growth rate being only about half that of GDP. This has not continued in recent years; over 2001-05 real GDP grew by 45% and energy use by 57%. During 1979-2001 falling energy intensities, in both secondary and tertiary industries, substantially offset the impact on energy demand of high growth and structural change, but the decline in sectoral intensities ceased after 2001. China will find difficult to achieve further reductions in energy intensity prior to 2010, and major policy initiatives or structural change may be necessary to return to an energy elasticity of GDP of much less than one. An unchanged policy projection shows growth in energy use and CO2 emissions from fuel combustion in China over 2002-30 of 6.7% and 6.5% per annum respectively. Such growth will place heavy pressure on both Chinese and global supplies of energy, and will have major implications for the world’s climate.
1. Introduction
There has been widespread discussion in recent years about the rapid rate of economic growth taking place in China, especially since China’s entry into the World Trade Organisation in 2001, and about the impact of that development on world markets for coal, oil and natural gas. The rate of growth in GDP and in energy use has indeed been rapid. Official figures put real GDP growth for 2005 at 9.9%, with average growth over 2001–2005 of 9.8%, while growth in total energy consumption over the four-year period was 11.6% per annum (NBSC 2006a).
To contribute to greater understanding of these issues, this paper undertakes five tasks. In Section 2 existing projections of China’s energy use and CO2 emissions are reviewed in the light of recent developments. In Section 3, the different stages of China’s growth since 1979 are examined, with emphasis on the special characteristics of the growth path since 2001. Building on this analysis, a decomposition of growth in China’s energy use since 1980 is reported (Section 4), to quantify the contribution to increasing energy use, in different periods, of GDP growth and changes in sectoral shares and in sectoral energy intensities. Future trends in aggregate energy intensity, or in the energy elasticity of GDP, are vital to any projection of China’s energy use and emissions, and this issue is examined in Section 5. Finally, in section 6 we present an unchanged policy projection to 2030 for energy use and CO2 emissions from fuel combustion in China that takes account of the implications of recent developments. The analysis is constrained by the quality and quantity of the available data, but understanding China’s energy use and contribution to greenhouse gas emissions is too important to be left until richer data permit more sophisticated forms of analysis. Conclusions are presented in Section 7.
2. Existing Projections and Emerging Realities
On the basis of an assumed average growth rate of GDP (measured in constant purchasing power parity prices) of 5% per annum between 2002 and 2030, in the 2004
World Energy Outlook the IEA projected growth of only 2.6% per annum in total energy
use (total primary energy supply – TPES), and of 2.8% in CO2 emissions, in China over that period (IEA 2004). This implies that each one percent growth in GDP generates only 0.52% growth in total energy use (an elasticity of energy demand with respect to GDP of 0.52). These projected figures for 2002-2030 are little more than half of the IEA figures for China over 1971-2002: 4.8% per annum growth in energy use and 4.9% growth in CO2 emissions from fuel combustion.
The IEA is not alone in projecting a long run reference case rate of growth in energy demand in China over the next 25-30 years below that of 1971-2002, and a range of recent projections are summarised in Table 1 below. An authoritative study by the Energy Research Institute of the National Development Commission of China and the Lawrence Berkeley National Laboratory in the USA, released in October 2003, projected growth in energy demand in China of 3.8% per annum between 1998 and 2020 in their unchanged policy scenario (ERI/LNBL 2003). The latest projections from the Energy Information Agency of the US Department of Energy (DOE 2005) show, for the reference case, annual growth in primary energy consumption in China of 4.1% per annum over 2002-2025. A regional study from the Asia Pacific Energy Research Council (APERC 2002; see also APERC 2004) projected lower average growth rates in the reference case of 2.7% over 1999-2020. Projections of growth in CO2 emissions, where they are available, are a little lower than for energy use, except for the case of the IEA.
2004), and an abridged English version was released (NDRC 2004; see also Dai and Zhu 2005). The report includes scenarios projecting energy use and CO2 emissions for China to 2020 on three bases: existing policies (scenario A), alternative policies, focusing on energy efficiency and sustainability (scenario B), and an ‘advanced policy scenario’ (scenario C). Scenario A projects annual average growth in energy use and CO2 emissions over 2000-2020 of 4.7% and 4.6% respectively (Table 1), very close to the outcomes for 1971-2002 noted above.
Table 1. Projections of Primary Energy Use and CO2 Emissions, China, various periods
Timeframe Reference projection
Growth in primary energy
use (% pa)
Growth in CO2
emissions (% pa)
Long-run energy elasticity
of GDP
Panel A: Independent Projections
ERI/LNBL (2003) 1998-2020 3.8 3.6
EIA International Energy
Outlook (DOE 2005) 2001-2025 4.1 3.6 0.66
APERC Outlook (2002)
1999-2020 2.7 na
IEA World Energy Outlook
(2004) 2002-2030 2.6 2.8 0.52
Panel B: China National Energy Strategy and Policy to 2020 (2004)
Scenario A – Existing Policy 2000-2020 4.7 4.6 0.64
Scenario B – Alternative
Policies 2000-2020 4.1 3.9 0.54
Scenario C – Advanced Policies
2000-2020 3.3 2.9 0.40
Table 2. Projections for Selected Variables, Scenario A, National Comprehensive Energy Strategy and Policy to 2020, and Actual Values for 2005
Actual Strategy Report – Scenario A Actual 2000 2005 2010 2020 2005
Primary energy demand (mtce) 1297 na 2137 3280 2225
Electricity generation capacity (GW) 319 402 559 947 505
Demand for fossil fuels
Coal (100 m tons) 12.7 16.2 20.0 29.0 21.4
Oil (100 m tons) 2.3 2.9 3.8 6.1 3.0
Natural gas (100 m cubic metres) 272 399 840 1654 500 Output of main energy intensive products
Iron and steel (m tons) 128.5 250 300 280 352
Cement (m tons) 597 680 790 1070 1060
Ethylene (10,000 tons) 450 790 1200 2000 756
Synthetic ammonia (10,000 tons) 3346 3600 3800 4000 42221
Paper (10,000 tons) 2487 4000 5000 7500 48641
Note: 12004 values.
Sources: For actual 2000 and strategy report values see. Actual data for 2005 from NBSC (2006a) and for 2004 from NBSC (2005a)
Some indication of what lies behind these surging energy demand numbers can be gleaned from comparing the projections for output of some energy intensive products that are provided in the report for scenario A with available data for 2005, or for 2004 where the 2005 data are not available (Table 2). For three of the products (iron and steel, cement and synthetic ammonia) the estimates for 2005 (or in one case 2004) are already well in advance of the projections for 2010, and this is likely to be the case for paper also, based on the 2004 figure. Only in the case of ethylene is the estimate for 2005 below the projection for that year. It is clear that, in the short run, energy demand and use in China is growing much more rapidly than envisaged in scenario A, and hence than over the previous thirty years.
3. Stages of Growth in China since 1979
and over this time the primary and tertiary sectors contributed 62% of total growth. These dynamics changed substantially during the 1990s, as the expansion of industrial activity, linked into global markets and driven in significant part by foreign investment and by a more competitive currency, became the main source of growth. Between 1990 and 1997 real industrial GDP grew by 15.7% per annum, while growth in both the agricultural and services sectors slowed (Table 3). As a result, the industrial share of GDP rose sharply from 37.0% to 48.9% between 1990 and 1997, and secondary industry contributed just on 60% of the growth of real GDP during this period.
Table 3. Real GDP by Sector, 1970-2000, estimated 2000 values
Agriculture Industry Services Total (100 billion yuan, at 2000 values)
1980 5.5 5.1 3.6 14.2 1990 10.1 12.6 11.4 34.1 1997 13.4 34.9 23.0 71.3 2001 15.0 48.7 33.0 96.7 2005 17.7 74.6 48.0 140.4
Share of total GDP (per cent)
1980 38.9 35.8 25.2 100 1990 29.6 37.0 33.4 100 1997 18.8 48.9 32.3 100 2001 15.6 50.4 34.1 100 2005 12.6 53.1 34.2 100
Annual growth rates (per cent per annum)
1970-1980 2.0 9.1 6.0 5.1
1980-1990 6.2 9.5 12.3 9.4
1990-1997 4.2 15.7 10.6 11.5
1997-2001 2.9 8.7 9.4 8.0
2001-2005 4.2 11.2 9.9 9.8
Sources: NBSC (2005a); NBSC (2006a) and estimates of the authors.
Table 4. Trends in Fixed Asset Investment and Exports, China, 1991-2005
Investment in fixed assets (billion yuan, 1991 prices)
Ratio of investment in fixed assets to
household consumption (real terms, %)
Exports (US$billion)
Exports/GDP in yuan
(%)
Ratio of change in exports to change in GDP
over period, in yuan (%)
1993 896.0 69.7 91.7 15.0 15.0
1997 1382.5 78.3 182.8 19.2 18.91
2001 2044.7 86.9 266.1 20.1 14.82
2002 2384.9 94.4 325.6 22.4 46.1
2003 2981.0 110.8 438.2 26.7 60.3
2004 3581.1 114.2 593.4 30.7 53.3
2005 4263.5 123.6 762.0 35.6 70.0
Notes: 1For the period 1993-1996 inclusive. 2 For the period 1997-2000 inclusive.
Sources: NBSC (2005a); NBSC (2006a) and estimates of the authors.
In this new stage of China’s development three inter-related features stand out. The first is the extremely rapid growth in exports. In just four years between 2001 and 2005 China’s exports in US dollar terms increased nearly threefold, growing by 30% per annum and rising from US$288 billion in 2001 to US$762 billion in 2005. The share of exports in GDP increased from 20.1% in 2001 to 35.5% in 2005 and the increase in exports over the four years amounted to 59% of the growth in GDP, and to 70% in 2005. The second feature of this period has been heavy investment in fixed assets, which has increased sharply in recent years and surpassed household consumption spending as the dominant factor in domestic demand. Real fixed asset investment has more than doubled between 2001 and 2005, growing at an average annual rate of 20.2%. These two factors of burgeoning exports and high levels of fixed asset investment are undoubtedly closely related. Creating the capacity for such a high level of exports required heavy investment in fixed assets, not only within firms but also in a wide range of economic and social infrastructure, ranging from power stations, ports and railways to housing and urban facilities. Revenues being received by various parties, both firms and government agencies, from the export boom would also assist with the financing of that infrastructure. The third feature of this period is perhaps an inevitable result of these two, namely a further rise in the role of the industrial sector in driving China’s growth. Measured in 2000 values, the share of secondary industry in GDP rose from 46.0% in 2001 to 48.5% in 2005 (Table 3), with virtually all the decline in the primary sector being taken up by industry.
transformation of China into the major trading nation on the globe and the investment implications of that transformation – are real. While growth in the world economy continues, and while China’s strategy and competitiveness foster further increases in China’s share of world markets, export led, energy intensive growth is likely to continue at a high level in China.
4. A Sectoral Decomposition of China’s Energy Use, 1980-2005
One valuable tool for understanding China’s energy use is a sectoral decomposition of that use (Wu et al. 2003). Given data limitations, the analysis here is limited to the three sectors discussed in the preceding section, namely primary, secondary and tertiary industry. For these three sectors, and for several periods, the objective is to decompose the increase in energy use in China into components reflecting growth in GDP, changes in energy intensity within sectors and changes in the sectoral composition of GDP.
The total energy use in period t is given by:
E =
∑
iyti . εti
=
∑
i(y0i + Δyti) . (ε0i + Δεti)
Where Δyti and Δεti are the change in value-added in sector i (yi) and in the energy
intensity of sector i (εi) in period t respectively. This implies:
ΔE =
∑
i(y0i . ε0i + Δεti. y0i + Δyti . (ε0i + Δεti) -
∑
i
y0i . ε0i
=
∑
i( Δεti. y0i + Δyti . (ε0i + Δεti)
The first term in the summation represents the change in total energy use due to changes in energy intensity in the industry sectors, for opening levels of GDP in the sectors, and the second term represents the combined effects of changes in the aggregate level and the composition of GDP, and their interaction with changes in sectoral energy intensities. Let sti be the share of sector i in total GDP at time t, and Yt be total GDP at t, so that:
Δyti = sti . Yt - s0i . Y0 = (s0i + Δsti) . (Y0 + ΔYt) - s0i . Y0
= s0i . ΔYt + Δsti . Yt .
Thus, substituting (3) into (2),
ΔE =
∑
i=
∑
iΔεti. y0i + (s0i . ε0i . ΔYt + Δsti . ε0i . Yt) + s0i . ΔYt . Δεti
+ Δsti . Δεti . (Y0 + ΔYt)
=
∑
is0i . ε0i . ΔYt + (Δεti. y0i + s0i . ΔYt . Δεti) + Δsti . ε0i . Yt
+ Δsti . Δεti . (Y0 + ΔYt)
This decomposition breaks the total change in energy use down into four effects, each summed across industry sectors, namely:
• the pure growth effect – s0i . ε0i . ΔYt - that due to the increase in total GDP, for
opening sectoral shares and energy intensities;
• the pure intensity effect – (Δεti . y0i + s0i . ΔYt . Δεti) - that due to changes in
sectoral energy intensities, at opening GDP levels by sector, and that due to the product of the change in GDP in sectors, for given GDP shares, and in sectoral energy intensities;
• the pure sectoral effect - Δsti . ε0i . Yt - that due to the change in sectoral GDP
shares, for opening energy intensities; and
• the interaction effect - Δsti . Δεti . (Y0 + ΔYt) – that due to the joint interaction of
the changes in sectoral shares and intensities, in relation to both the opening level of total GDP and its change.
Given the interaction between the variables in determining final energy use, the various effects cannot be fully isolated, so that the interaction effect measures the change in energy use due to the combined change in sectoral shares and in sectoral intensities.
The results of the decomposition analysis are summarised in Table 5 and provided in full in the Appendix, Table A1. It should be noted that here energy use excludes energy from traditional biomass and waste.
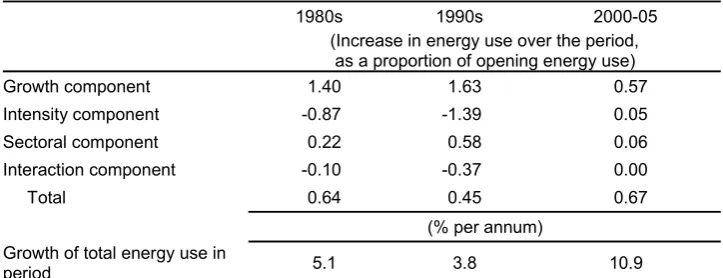
Table 5. Components of Increase in Energy Use, Selected Periods, 1980-2005, as a proportion of opening total energy use
1980s 1990s 2000-05
(Increase in energy use over the period, as a proportion of opening energy use)
Growth component 1.40 1.63 0.57
Intensity component -0.87 -1.39 0.05
Sectoral component 0.22 0.58 0.06
Interaction component -0.10 -0.37 0.00
Total 0.64 0.45 0.67
(% per annum) Growth of total energy use in
period 5.1 3.8 10.9
Source: Estimates of the authors, based on data from NSBC (2005a) and NSBC (2006a). For details see Table A1.
In the 1990s, growth in GDP was even stronger (at 10.1%) than in the 1980s so that, in spite of the lower level of energy intensities in the opening year, the growth effect was large (163% of 1990 energy use by 2000 – Table 5). During this decade the share of secondary industry rose rapidly, so that sectoral effects also contributed strongly to growth in energy use (to the extent of 58% of 1990 energy use). Other things being equal, the growth and sectoral effects would have led to an increase of 12.4% per annum in total energy use during the 1990s. But again other things were not equal, and the decade saw very large falls in energy intensities – energy use per unit of real value added in secondary industry fell by 59% between 1990 and 2000, and that in tertiary industry by 45%. The impact of these falls in intensity, both directly and through the interaction component, were such as to offset substantially the growth and sectoral effects, so that total energy use in China grew by only 3.8% per annum over the decade. The implied energy elasticities for the decade are thus very low, being 0.28 for secondary industry and 0.37 for the economy.
Thus in the dynamics of Chinese energy use in the 1990s two powerful forces were opposed – strong GDP growth and the changing structure of the economy, on the one hand, and sharp falls in energy use per unit of value added, especially in secondary and tertiary industries, on the other. The balance between these forces was always precarious – if falling intensities were no longer achieved, rapid growth in energy use would result. Indeed, the speed of the decline in energy intensity – especially in secondary industry, where value added increased by 60% over 1995-2000 with only a 1% increase in recorded energy use – was one of several factors casting doubt on the energy statistics for that period. This issue is discussed in the next section.
and fixed asset investment – continues, the growth and sectoral effects will continue to favour rapid growth in energy use. So the key issue, both for interpreting the past and for future projections, is an understanding of the changes in the energy intensity of GDP, or in the energy elasticity of GDP, in China.
5. Interpreting Changes in the Energy Intensity of GDP
To facilitate international comparisons in terms of the energy intensity and elasticity of GDP, we shift from Chinese official data to series based on IEA data for the remainder of the paper. For energy use from 1977 to 2001 the data are from the IEA, and are extended to 2005 using the growth rates for the years 2001-2005 provided in NBSC (2006a). For GDP the data are from the IEA to 1992 in purchasing power parity prices, and are extended from 1993 to 2005 by the growth rates provided in NBSC (2006b)1, so as to account for the recent revisions to China’s GDP data2. The questions are: why did the energy intensity of GDP fall so sharply over the 1980s and the 1990s and what is the most reasonable basis for future projection of it?
We start from the very high energy intensity of China’s GDP in the late 1970s. Figure 1 summarises the IEA data in relation to the energy intensity of GDP over 1971-2002 for three main country groupings and China. Here energy intensity is defined as the ratio of total primary energy supply, measured in million tonnes of oil equivalent, per US$ billion of GDP, measured in 2000 purchasing power parity prices. At its peak in 1978 China’s energy intensity of 0.61 mtoe per billion US$ GDP was five times that of other developing countries taken as a whole (0.12) and more than twice that of the OECD countries (0.27). But, given the long decline described earlier, by 2001 China’s energy intensity had fallen to 0.175 mtoe per US$b, below that of the OECD countries (0.187) and close to that of the other developing countries taken as a whole (0.160). The speed and extent of the fall in China’s energy intensity is notable also compared to other transition economies (data for which are available only from 1992). For 27 other transition economies as a group, energy intensity in 1992, at 0.60, was close to China’s 1978 level and fell to 0.51 in 2001, remaining nearly three times China’s level in the latter year. It should also be noted that the fall in energy intensity in China has been almost identical in secondary and tertiary industry – the energy intensity of value added in 2001 being 26% of that in 1980 for the secondary sector and 28% of the 1980 level for the tertiary sector. In this context, China’s long run reduction in energy intensity is a striking achievement.
1 No distortion is introduced into the PPP data by this procedure, for there is virtually no difference in the
growth rates of China’s real GDP reported in the IEA PPP statistics and in the NBSC data.
2 In 2005 China’s First National Economic Census was undertaken, and the results were released in relation
Figure 1. Energy intensity of GDP: China, other developing countries and transition economies, actual 1971–2002, mtoe per billion US$ GDP, in 2000 PPPs
0.00 0.10 0.20 0.30 0.40 0.50 0.60 0.70
OECD Trans ition econom ies China Developing ex China
Source: IEA database.
The measure used in Figure 1 – aggregate energy use per unit of GDP, measured in constant purchasing power parity prices – is a simple measure that conceals many complexities, both of measurement and aggregation. For example, there are clearly many areas in which China can achieve much increased energy efficiency (NDRC 2004), and the use of market exchange rates rather than PPPs for GDP would increase China’s reported energy intensity, although it would introduce other distortions. High levels of investment in focused policies and management strategies directed at energy efficiency appear to have played a significant role in the process of declining intensity (Lin 2005), as did the ability to ration energy supply to enterprises still largely under direct government control, and hence to force increase efficiency (Andrews-Speed 2004). But, as Lin (2005) has shown, investment on energy conservation projects in China has fallen from over 8% of total energy investment over 1981-1995 to only 4% over 1996-2003, and rationing is no longer a viable option in the new economy.
To attempt an empirical estimate of the importance of the data problems we applied the following test to the data for secondary industry. Assume that, in the period in which intensity is declining as a result of increased operating efficiency, investment in new plant and equipment and energy programs, the rate of decline is greater when the economy is growing more rapidly, both relative to trend rates. More rapid growth provides scope for higher investment in more efficient equipment, and for utilising energy more efficiently over a higher level of output. Secondly, assume that the misreporting of data commences in 1997 and continues with cumulative effect to 2001 before being eliminated over the next three years, so that there is no under-reporting by 2004. On this basis we estimate for secondary industry the following equation:
∆T ln (It) = α + β∆T ln (Yt) + γ Dt + εt , (5)
where ∆T ln (It) is the deviation from trend of the log of energy intensity, ∆T ln (Yt) is the deviation from trend of the log of value added, Dt is a dummy variable that takes the value 1 in 1997, rises to 3 by 2001 and declines to zero by 2004, and εt is an error term. The result of estimation over 1980-2004 by ordinary least squares is as follows:
∆T ln (It) = 0.030 - 0.741 ∆T ln (Yt) - 0.0461Dt, R2 = 0.49 (6)
(2.29) (4.13) (3.50)
with t-values in brackets. The results imply that the model is consistent with the data, explaining 49% of the deviation of ln (It) from trend, with the value added variable significant and of the correct sign (when value added is above trend the falls in energy intensity are larger). The dummy variable is significant and implies that, at the peak level in 2001, energy intensity was nearly 15% lower than it would otherwise have been. This simple empirical test thus supports the view of Sinton and Fridley (2003) that data problems might have significantly influenced both the reported decline in energy use over 1996-2001 and the subsequent surge in reported energy use over 2001-2004, but that the data should be clear of the problem by 2004. Making this correction to the 2001 data implies an elasticity of energy use over 2001-2005 of close to one.
Table 6. Elasticity of energy use (TPES) with respect to GDP, developing countries, actual 1971-2002.
Annual GDP growth
rate (% pa) Annual TPES growth rate (% pa) Elasticity of TPES with respect to GDP
1971-2002 1971-1990 1990-2002 1971-2002 1971-1990 1990-2002 1971-2002 1971-1990 1990-2002
China 8.5 7.8 9.6 4.8 5.7 3.4 0.57 0.73 0.35
India 4.9 4.6 5.3 5.6 6.1 4.7 1.15 1.34 0.89
SE Asia 5.4 6.0 4.4 6.9 7.2 6.5 1.28 1.19 1.47
Other 3.1 3.1 3.0 4.5 5.1 3.5 1.46 1.64 1.18
All developing
countries 4.7 4.4 5.3 4.9 5.9 3.4 1.04 1.35 0.64
Finally, Table 6 places China’s experience in the context of other developing countries. With the exception of India over 1990-2002, the experience of the developing countries has been of an energy elasticity of GDP significantly greater than one. The developing countries in South East Asia, many of whom follow a similar development model to China, have in aggregate had an energy elasticity of 1.28 over 1971-2002, while for 60 developing countries the figure was 1.46. India’s energy elasticity over 1971-2002 was 1.15, although it was only 0.89 over 1990-2002. But over that period India’s growth has been driven by the service sector and India has suffered chronic energy shortages (IPC 2005), so that this is not a representative case.
The evidence assembled here suggests that, while some of the recorded recent rise in energy use reflects data problems from the late 1990s, China will find it difficult to achieve significant further reductions in energy intensity (or an elasticity significantly less that one) in the immediate future. China is still following an energy intensive development strategy, based on exports, investment in fixed assets and rapid growth in secondary industry. Nevertheless, it has brought its energy intensity of GDP down, on one standard measure, to parity with the OECD countries and to close to that of the other developing countries as a whole, so that many of the easier gains have been made. Further, the current round of rapid expansion in China’s energy production capability energy investment has taken place in a context of urgency arising from energy shortages, precluding careful exploitation of advanced technologies. Above all, China still faces many of the imperatives of a developing country, with energy use per capita still only 18% of the OECD average and little more than half the global average. The historic and unique phase of rapid growth in a large developing economy with an energy elasticity of only about 0.5 is almost certainly over. Until the economy matures or the development strategy changes, further reductions in energy intensity will need to be achieved through sustained policy initiatives in many areas.
6. A Changed Policy Projection of Energy Use and CO2 Emissions,
China 2002-2030
One way to explore the implications of current trends is to develop a simple projection for energy use and CO2 emissions from fuel use in China for the period to 2030. This is an unchanged policy projection, and hence is based on an interpretation of the policies in force in 2006, but attempts to take account of the trends described and analysed above.
Projection Framework
For a given country i in year t, n years from some initial period, real GDP in international purchasing power parity prices (Yti) is given by:
Yti = Y0 (1 + αti)n,
where Y0 is opening period real GDP and αti is the average annual growth rate of real
GDP for country i from the initial year to year t. The elasticity of energy use with respect
annual rate of growth of total primary energy supply (eti) to the average annual rate of
growth of GDP (αti). That is:
εti = eti / αti .
Hence the rate of growth of total energy use (eti) over the period is εti.αti, and total energy
use by country i in year t is:
Eti = E0i (1 + εti.αti) n.
Energy use involves different types of fuels (coal, oil, natural gas and various types of non-fossil and renewable fuel types), each with a different propensity to generate CO2 emissions. The share of fuel type j in total energy use in country i (sji) will vary over time,
depending on availability, relative prices, investment patterns, policy initiatives and other factors. The energy use met by fuel j in country i in year t can then be denoted by:
Etji = Eti. stji = E0i (1 + εti.αti) n. stji .
Finally, CO2 emissions per unit of fuel use (mtji) will vary across countries, depending for
example on the quality of fuel used and the technological processes involved, and over time within a given country. Total CO2 emissions from the use of fuel j in country i in year t with then be given by:
Mtji = mtji . Etji = mtji. stji . Eti .
Thus total CO2 emissions in country i in year t (Mti) are given by:
Mti = ∑mtji. stji . E0i (1 + εti.αti) n .
j
Given this relationship, the projection methodology focuses on four key parameters for a given country or region: αti, the rate of growth of real GDP; εti, the elasticity of energy
use (total primary energy supply) with respect to GDP; stji, the shares of various fuel
types in total energy use and mtji, the level of CO2 emissions per unit of energy supply for different fuel types. In aggregating emissions energy use from fossil fuels only (coal, oil and natural gas) is included, as non-fossil fuel use generates no CO2 emissions and biomass and waste are excluded by convention.
GDP Growth Projections (αti)
involves a considerable slowing of Chinese growth from its current hectic pace, but continued fairly strong growth over the longer term.
Elasticity of Energy Use (εti) and Total Primary Energy Supply
Consistent with the discussion above, we assume an energy elasticity of one for the period 2006-2010, with a gradual subsequent decline as the economy matures and as current renewable energy and price reform measures take effect, to 0.85 over 2010-20 and to 0.75 over 2020-30. Together with the GDP profile described above, these assumptions imply that growth in TPES in China of 10.6% per annum over 2002-2010, but with growth slowing to less than half that rate (5.2% per annum) over 2010-2030, giving 6.7% per annum growth over 2002-2030. This projection means that China’s energy use would increase more than six-fold between 2002 and 2030 and account for more than 30% of global energy use by 2030, as China takes an ever larger share of global production of energy intensive products, as well as providing higher living standards for its people.
Fuel Use Type (sji) and Emissions Intensity of Different Fuel Types (mtji)
The values for China over the projection period of stji, the shares of various fuel types in
total energy use, and of mtji, the emissions intensity of different fuel types, are based on
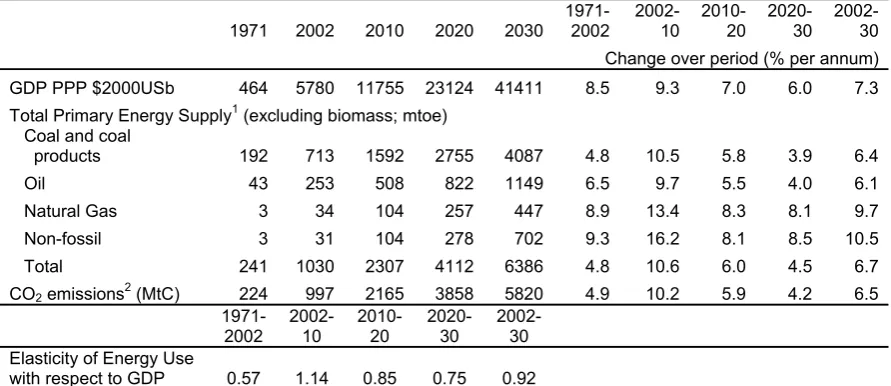
Table 7. Summary of Unchanged Policy Projections
1971 2002 2010 2020 2030 1971-2002 2002-10 2010-20 2020-30 2002-30 Change over period (% per annum) GDP PPP $2000USb 464 5780 11755 23124 41411 8.5 9.3 7.0 6.0 7.3 Total Primary Energy Supply1 (excluding biomass; mtoe)
Coal and coal
products 192 713 1592 2755 4087 4.8 10.5 5.8 3.9 6.4
Oil 43 253 508 822 1149 6.5 9.7 5.5 4.0 6.1
Natural Gas 3 34 104 257 447 8.9 13.4 8.3 8.1 9.7
Non-fossil 3 31 104 278 702 9.3 16.2 8.1 8.5 10.5
Total 241 1030 2307 4112 6386 4.8 10.6 6.0 4.5 6.7
CO2 emissions2(MtC) 224 997 2165 3858 5820 4.9 10.2 5.9 4.2 6.5
1971-
2002 2002-10 2010-20 2020-30 2002-30 Elasticity of Energy Use
with respect to GDP 0.57 1.14 0.85 0.75 0.92
1Excludes energy from traditional biomass. 2Includes emissions from cement production.
Source: IEA database and estimates of the authors.
Emissions Projections
The resulting projections are summarised in Table 7. By 2030 total primary energy use in China is projected to be 6.4 btoe, about 30% of global energy use by that time and implying an increase of 6.7% per annum over 2002-30. With nearly 90% of energy use in 2030 still being provided from fossil fuel sources, in spite of a projected 10.5% per annum growth in energy from non-fossil fuel sources, emissions are projected to grow by 6.5% per annum and to total about 5.8 billion tonnes of carbon by 2030. For reference, total global emissions of CO2 from fuel combustion and cement in 2000 were 6.4 billion tonnes of carbon.
7. Conclusion
growth rates over 2010-2030 still imply very high levels of energy use and emissions in China by 2030. Such outcomes, if they come to pass, will have major ramifications for world energy markets and for the global climate.
References
Andrews-Speed, P. (2004), Energy Policy and Regulation in China, Kluwer Law
International, The Hague.
Asia Pacific Energy Research Centre (APERC) (2002). APEC Energy Demand and Supply Outlook 2002, Asia Pacific Energy Research Centre, Tokyo.
Asia Pacific Energy Research Centre (APERC) (2004). Energy in China: Transportation, Electric Power and Fuel Markets, Asia Pacific Energy Research Centre, Tokyo.
British Petroleum (BP) (2005), Statistical Review of World Energy, June, BP, London.
Dai Yande and Zhu Yuezhong (2005), ‘China's energy demand scenarios to 2020: Impact analysis of policy options on China's future energy demand’, International Journal of Global Energy Issues, vol. 24, nos. 3/4, pp. 131-143.
National Development Research Centre (NDRC) (2004), China National Energy Strategy and Policy to 2020: Subtitle 2: Scenario Analysis on Energy Demand, Beijing.
Department of Energy US (DOE) (2005), International Energy Outlook, Energy Information
Agency (EIA), Washington DC.
Energy Research Institute (ERI) (2003), ‘China’s Sustainable Energy Future: Scenarios of Energy and Carbon Emissions’, Lawrence Berkeley National Laboratory, Berkeley, CA.
International Energy Agency (IEA) (2004), World Energy Outlook 2004, , Paris.
Lin, Jiang (2005), ‘Trends in Energy Efficiency Investments in China and the US’, LBNL-57691, June, China Energy Group, Lawrence Berkeley National Laboratory, Berkeley, CA.
National Bureau of Statistics of China (NBSC) (2004), China Statistical Yearbook 2004, Beijing.
National Bureau of Statistics of China (NBSC) (2005a), China Statistical Yearbook 2005,
Beijing.
National Bureau of Statistics of China (NBSC) (2005b), ‘Key Advancements of the First National Economic Census with New Changes of China’s GDP Aggregates and its Structure’, Beijing, at: http://www.stats.gov.cn/english/newsandcomingevents/t20051220_402297118.htm
National Bureau of Statistics of China (NBSC) (2006a), ‘Statistical Communique of the People’s Republic of China on the 2005 National Economic and Social Development. Beijing’, at:
http://www.stats.gov.cn/english/newsandcomingevents/t20060302_402308116.htm
National Bureau of Statistics of China (NBSC) (2006b), ‘Announcement on Revised Result about Historical Data of China’s Gross Domestic Products’, Beijing, at:
http://www.stats.gov.cn/english/newsandcomingevents/t20060110_402300302.htm
Sinton, J.E. and Fridley, D.G. (2003), ‘Comments on recent energy statistics from China’,
Sinosphere, vol.6, no. 2, pp. 6-12.
Sheehan, P. and Sun, F. (2006), ‘Energy Use and Emissions in China’, CSES Climate Change Working Paper no. 4, Centre for Strategic Economic Studies, Melbourne, at:
http://www.cfses.com/projects/climate.htm.
Appendix
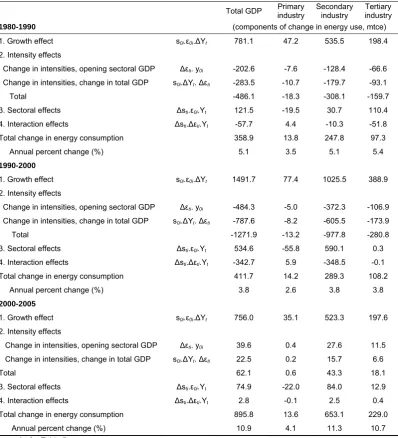
Table A 1. Sectoral Decomposition of Energy Consumption, China, 1980-2005
Total GDP Primary industry Secondary industry industry Tertiary
1980-1990 (components of change in energy use, mtce)
1. Growth effect s0i.ε0i.ΔYt 781.1 47.2 535.5 198.4
2. Intensity effects
Change in intensities, opening sectoral GDP Δεti. y0i -202.6 -7.6 -128.4 -66.6
Change in intensities, change in total GDP s0i.ΔYt. Δεti -283.5 -10.7 -179.7 -93.1
Total -486.1 -18.3 -308.1 -159.7 3. Sectoral effects Δsti.ε0i.Yt 121.5 -19.5 30.7 110.4
4. Interaction effects Δsti.Δεti.Yt -57.7 4.4 -10.3 -51.8
Total change in energy consumption 358.9 13.8 247.8 97.3 Annual percent change (%) 5.1 3.5 5.1 5.4
1990-2000
1. Growth effect s0i.ε0i.ΔYt 1491.7 77.4 1025.5 388.9
2. Intensity effects
Change in intensities, opening sectoral GDP Δεti. y0i -484.3 -5.0 -372.3 -106.9
Change in intensities, change in total GDP s0i.ΔYt. Δεti -787.6 -8.2 -605.5 -173.9
Total -1271.9 -13.2 -977.8 -280.8 3. Sectoral effects Δsti.ε0i.Yt 534.6 -55.8 590.1 0.3
4. Interaction effects Δsti.Δεti.Yt -342.7 5.9 -348.5 -0.1
Total change in energy consumption 411.7 14.2 289.3 108.2 Annual percent change (%) 3.8 2.6 3.8 3.8
2000-2005
1. Growth effect s0i.ε0i.ΔYt 756.0 35.1 523.3 197.6
2. Intensity effects
Change in intensities, opening sectoral GDP Δεti. y0i 39.6 0.4 27.6 11.5
Change in intensities, change in total GDP s0i.ΔYt. Δεti 22.5 0.2 15.7 6.6
Total 62.1 0.6 43.3 18.1
3. Sectoral effects Δsti.ε0i.Yt 74.9 -22.0 84.0 12.9
4. Interaction effects Δsti.Δεti.Yt 2.8 -0.1 2.5 0.4