Strengthening Science Understanding with Learning
Trails
Wolfgang Leister1 , Ingvar Tjøstheim1, Göran Joryd2,3, Jan Alfred Andersson4, and Håvard Heggelund4
1 Norsk Regnesentral, Postboks 114 Blindern, 0314 Oslo, Norway; [email protected] (W.L.);
[email protected] (I.T.);
2 Expology AS, Sagveien 23F, 0459 Oslo, Norway; [email protected] (G.J.)
3 Museum of Cultural History, Postboks 6762 St. Olavs plass, 0130 Oslo, Norway; [email protected]
(G.J)
4 Norwegian Museum of Science and Technology, Kjelsåsveien 143, 0491 Oslo, Norway;
[email protected] (J.A.A.); [email protected] (H.H.).
* Correspondence: [email protected] (W.L.)
Version May 15, 2019 submitted to Preprints
Abstract:The Norwegian Museum of Science and Technology have developed a learning concept for 1
school classes in science centres named ‘learning trails’. In this concept, groups of students perform a 2
series of thematically related experiments with installations in the science centre. The learning trails 3
are designed to support the generic learning outcomes for science centre visits. We argue for using the 4
previously developed Engagement Profile in an indicator to determine both media forms and generic 5
learning outcomes for such learning concepts. Further, we implemented the learning trails in two 6
modes: one mode used paper-based content to guide the students, while the other mode supported 7
the use of tablet PCs where engaging content is triggered when the students approach the location 8
of an experiment in the learning trail. We studied the engagement factors of the learning trails and 9
observed how school classes use these. In a study with 113 students from lower secondary school, 10
they answered short questionnaires that were integrated into the implementation of the learning 11
trails. While the concept of the learning trails was evaluated positively, we could not find significant 12
differences in how engaging the two implemented modes were. 13
Keywords:learning trail; science centres; visitor engagement; generic learning outcomes 14
1. Introduction 15
Science centres are informal learning environments [1] that offer exhibits supporting free-choice 16
learning, as well as specific programmes for organised school class visits. We want to explore to what 17
degree such learning programmes engage students and find means to strengthen the engaging factors 18
of an exhibit [2]. 19
The Norwegian Museum of Science and Technology (NTM) introduced the concept of learning 20
trails around science centre installations grouped thematically. The learning trails combine physics 21
experiments with technology history from the exhibitions in the science centre. The motivation for 22
this is to foster learning from using these installations and to create dialogues and narratives [3] that 23
explain science phenomena. The activities of the learning trails are designed for groups of up to four 24
students at a time. 25
The objective of this paper is to explore how the elements in the learning trail concept can be used 26
to create engaging content that supports the generic learning outcomes [4] specified by the science 27
centre. We relate the Engagement Profile [2] to the generic learning outcomes and evaluate the learning 28
trails in an empiric study with students from secondary school classes. Further, we investigate the 29
impact of presenting location-based content on a tablet PC versus a paper-based version of the learning 30
trails. To study this, we implemented a prototype that presents content upon arrival at an experiment, 31
using unobtrusive and affordable in-door location technology. 32
In the following, we present an overview of related work including a review of learning outcomes, 33
the Engagement Profile, and location technology in museums and science centres (Section2), before we 34
show how to translate the Engagement Profile to terms related to media forms and learning outcomes 35
(Section3). Thereafter, we present the concept of the learning trails and their implementation (Section4) 36
and develop the Engagement Profiles for the learning trail concept and the single experiments, before 37
deriving the related media forms (Section5). Section6presents an empiric study where the prototype 38
of the learning trails was evaluated with students from secondary school classes. Section7concludes 39
our essay. 40
2. Related Work 41
We focus on school children visiting science centres as a class activity as the main target group for 42
our work. As these students may have diverse learning agendas and prefer diverse ways of learning 43
(such as reading, interacting with others, touching and doing) [4], science centres offer a diversity of 44
exhibits that can be explored during the visit. The design of installations [5] should address factors 45
such as the targeted learning outcome, learning styles, levels of engagement, and context. 46
2.1. Learning Outcomes in Science Centres 47
Learning outcomes in science centres are difficult to specify and to measure, even if we consider 48
the compulsory participation of school children. The pedagogical tool Generic Learning Outcomes 49
(GLO) [4] describes the impact of learning in museums in terms of a) knowledge and understanding, 50
b) skills, c) change in attitudes and values, d) enjoyment, inspiration and creativity, and e) activity, 51
behaviour and progression. These five aspects cannot be used as guidelines to control the design 52
process of exhibits, as these aspects are yet unrelated to design properties. However, we note that 53
design and implementation elements will have a considerable impact on the GLO. Therefore, we seek 54
a way to predict how changes in design and implementation will impact the GLO. 55
Brown [6] remarked that the GLO are subjective, do not measure learning directly, and are 56
most effective as post hoc measures, that is, after the learning experience. He suggested to consult 57
Laurillard’s taxonomy of educational media [7] that is based on the teacher’s concepts and constructed 58
environment, and the student’s concepts and specific actions. The four kinds of activities in her 59
framework are: discussion, adaptation, interaction, and reflections. Unlike the GLO, Laurillard’s 60
framework is not specifically developed for science centres, and adjustments for its use in science 61
centre learning might be necessary. 62
In Laurillard’s framework, the related learning experiences and adjacent media forms (in 63
parentheses) are: i) attending, apprehending (narrative); ii) investigating, exploring (interactive); 64
iii) discussing, debating (communicative); iv) experimenting, practising (adaptive); and v) articulating, 65
expressing (productive). 66
As all five learning experience types and media forms are present in science centre learning, 67
Laurillard’s framework can be applied to exhibits in science centres. However, these learning 68
experiences are present to a varying degree in each exhibit or concept. Experimenting and practising, 69
as well as investigating and exploring are the most prevalent forms of experiences, while specific 70
concepts, such as the learning trails, can extend learning to other learning experience types. Notice 71
that the work by Laurillard [7] and that by Brown [6] were published before many of the current media 72
technologies were introduced in science centres; thus, the methods and technologies described there 73
might be somewhat outdated and could need adjustment. 74
The GLO are used as a basis for evaluations in science centres and museums. For instance, 75
Ayudhya and Vavoula [8] use the GLO to guide the design of questions about the outcomes in an 76
assessment of a mobile app used by families in a science museum. In their analysis, they also encode 77
observations captured on video according to Bitgood [9]’s attention-value model, that comprises of the 78
Competition
Na
rra
tiv
e
In
te
ra
ct
iv
it
y
Ph
y
s
i
cal
User Control
So
c
ia
l
A
ch
ie
ve
m
en
ts
Ex
p
l
o
ra
t
i
o
n
no achieve results with installation with visitor asynchronously with visitor(s) in real time team challenge influence other visitorslook only explai
ning
text limite
d narr .
structu
re rich n
arrati ve
struc ture drama
tiseds tory
scen ograp
hic setti
ng
imm ersive
environ ment
dram atised
story
lo ok on ly ha ndle ob je ct lim ite d (y/n st ar t/s top) ch oi ce s in fluen ce ou tc om e hi gh de gr ee ;c hoice s ha ve co ns eque nces or ow n na rrativ e vis ito rc re at esco nten t loo k on ly touc h, hold m ove guided tour) so mea ctiv ity ope
rating o bjec
t full body motion lon ger phy
s. acti vity full b
ody
motion acti
vity
in real
setting
lo o k only linear chronol. sequences and conditions choices with no effect on flow visitor controls flow
parallel narratives high degree of control
creative process
1
visito r
1 visi tor
oth.o bser
ve
nvisit orsus
e
1 insta
ll.each
1 visit
or,oth ers
observ e,en
gage
intende
d for m
ultip le simult aneo usvi sitor s
multi-v
isitorin stalla
tion
visitor
s mus t coo
pera te no im m ed iate fe ed ba ck ac hie ve m en ts sh own at en d pro gre ss ba r gra ph ica lv is. dis play ac hie ve m en ts (po ints ,lis ts, ga dg ets ) dis play ac hie ve m en ts wit h ch oic es an d co ns eq ue nc es defi ned view
se vera
l pe
r-spe ctive s expl orew hile st opped explo
re while ongo ing dissec twi th reco ver
y fun cti
on follo
w branc
hes
inp ossi
bility s pace
1
2
3
4
5
1
2
3
4
5
1
2
3
4
5
1
2
3
4
5
0
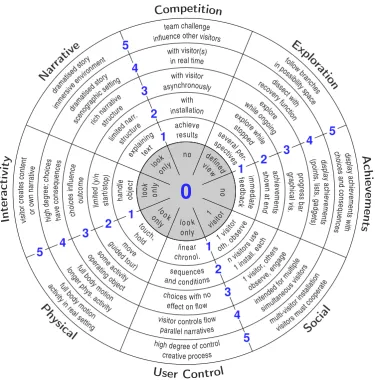
Figure 1.The dimensions of the Engagement Profile explained with short definitions. To define the
value of a property, find the adjacent number of the phrases that fit best.
encoding activities belong to the visitor-centric view of assessment. In contrast, we want to focus on 80
the installation-centric view that is discussed by Leisteret al.[2, p.51]). 81
2.2. Quantitative Evaluation of User Engagement 82
Behavioural engagement is one of the factors that has a positive correlation to achievement-related 83
outcomes [cf. 10, p. 70ff]. In informal learning arenas, this implies that engaging exhibits and 84
installations will foster better learning outcomes than exhibits that do not engage. 85
To evaluate how engaging installations are, the Engagement Profile [2] has been used alongside 86
with sensors, observations, and questionnaires to measure engagement and user satisfaction. The 87
Engagement Profile has been applied to the design process at museums and science centres [5], to 88
analyse engagement and narratives for installations [3], and to develop a robotic teaching assistant for 89
students at a university college [11]. 90
The Engagement Profile quantifies the characteristics of installations along eight dimensions, each 91
of which is given a value between 0 and 5. The dimensions of the Engagement Profile represent the 92
degrees ofcompetition(C),narrativeelements (N),interaction(I),physicalactivity (P),user control(U), 93
socialaspects (S),achievementsawareness (A), andexplorationpossibilities (E). A graphical presentation 94
External influences are not taken into account in the Engagement Profile since these are not 96
properties of the direct learning environment. Physical factors, such as noise, light or smell could 97
play a role in the perception of engagement, but need to be handled outside the Engagement Profile. 98
Properties that belong to the context, such as social factors, institutional factors, or recent incidents 99
personally or globally, are excluded. However, these factors still need to be taken into account in the 100
assessment process, e.g., as suggested in the DEX-framework [12]. 101
2.3. Location-Based Systems in Science Centres and Museums 102
We posit that engagement can be increased when offering tailored content based on the visitor’s 103
current location. Such location-based systems are commonly used as a component of installations, as 104
well as part of visitor studies and exhibit evaluations [13]. Several authors [e.g.,14,15] suggest to adapt 105
content to the visitor’s current situation or to adjust the visiting path using on-line tracking. In our 106
approach, we use on-line tracking to trigger engaging content based on the location of the visitor. 107
Location-based systems can be used to retrieve viewing times, itinerary, speed, group behaviour, 108
and so on. Yalowitz and Bronnenkant [16] presented methods for visitor tracking and timing in 109
museums. They classified the variables to be recorded into a) stopping behaviour; b) other behaviour; 110
c) observable demographic variables; and d) situational variables. Further, they addressed practical 111
issues, technology, and ethics to collect, analyse, and interpret these variables. 112
Baldwin and Kuriakose [14] presented several technologies for tracking visitors. Tracking data are 113
used to a) predict a visitor’s future path in the museum; b) recommend exhibits of potential interest to 114
the visitor, and c) personalise content delivered to visitors. They also explored the impact of physical 115
proximity and visitor gaze on exhibit engagement. 116
Yoshimuraet al.[17] presented a study where they use Bluetooth proximity data of visitors’ smart 117
phones to measure the visitors’ transition between places in a museum. Moussouri and Roussos 118
[18] discussed cultural itineraries of visitors and present a study where outdoor tracking devices 119
are used to extract the paths of visitors in the London zoo. Further, Moussouri and Roussos [19] 120
proposed a methodology for representing location-based data collected by the use of smart-phones. 121
They presented three ways: a) trail-based representation; b) functional representation; and c) statistical 122
distributions of displacement. 123
The prediction of visitor’s sentiments and future behaviour can be based on current observations. 124
Parsonset al.[15] suggested to use viewing times as an indicator of preference, and they propose a 125
recommendation system based on this idea. Bohnert and Zukerman [20] used viewing times as an 126
indicator for interest. They proposed non-intrusive personalisation of the museum experience based 127
on viewing times of previous visitor behaviour and evaluated two prediction approaches. 128
Besides outlining exhibit design approaches and strategies, Bitgood [21] presented three types of 129
visitor measures of success: a) behaviour measures including stopping (attracting power), viewing 130
time (holding power), social impact, human factors impact, and trace or decay measures; b) knowledge 131
acquisition (memory, comprehension); and c) affective measures (attitude change, interest level, 132
satisfaction). 133
2.4. Indoor-location Technologies 134
In-door location can be used both for analysis, and to adapt and control the stream of 135
content to the visitor. Mautz [22] presented a variety of indoor-tracking systems based on ample 136
technologies. Lymberopouloset al.[23] compared indoor-location technologies that are based on WiFi, 137
geo-magnetic, sound signals for the infrastructure-free technologies, and RF-beacons, RFID, infrared, 138
ultrasound, Bluetooth, short-range FM transmitters, lights, and magnetic signal modulators for the 139
infrastructure-based technologies. Bickersteth and Ainsley [24] compared ample technologies for 140
tracking using mobile phones in museums, such as use of the Temporary Mobile Subscriber Identity 141
(TMSI), Bluetooth, and WiFi. In museums and science centres, we have also seen location approaches 142
C N
I Narrative
P Interactive
U Communicative
S Adaptive
A Productive
E
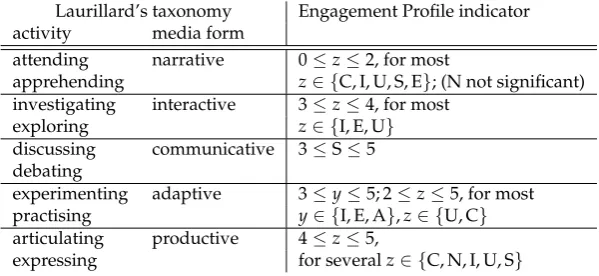
Figure 2.Aligning the entities of the Engagement Profile (left) with those of Laurillard’s taxonomy
(right). The dashed lines indicate partial impact. Colours are used for graphical clarity.
3. Generic Learning Outcomes, Media Forms, and the Engagement Profile 144
Learning outcomes depend on how students use the installations within the context of their 145
science centre visit and how the installations and activities are designed. We have already outlined 146
that the GLO define the outcome of a science centre visit, while Laurillard’s taxonomy qualitatively 147
describes activities and media forms for learning. In contrast, the Engagement Profile describes 148
properties of exhibits quantitatively. 149
The implementation of an exhibit, characterised by the Engagement Profile, supports the learning 150
outcome and the GLO through the learning activities in the science centre. Further, we posit that the 151
media form can be described by the Engagement Profile. To support this claim, we relate the terms of 152
Laurillard’s taxonomy to the terms used in the Engagement Profile and define thresholds that indicate 153
which media forms an exhibit has. 154
To create this indicator, we use the description of the media forms, adapted from the work by 155
Brown [6] as a starting point. Further, we use the description of the Engagement Profile (see Figure1 156
for the graphical short form). We create the indicator by evaluating which term in the Engagement 157
Profile fits best to the description of the respective media form. 158
This results in the following findings: The variables C, I, U, and E have an impact on on the 159
narrative, interactive, and adaptive media forms. We also observed that the productive media form 160
requires several high values in the Engagement Profile. Further, P appears to be irrelevant to indicate 161
the media form as defined in Laurillard’s framework. The relationship between the Engagement 162
Profile and Laurillard’s framework is graphically shown in Figure2. 163
By identifying which values of the Engagement Profile suit the description of the media forms, 164
we are able to set up conditions for which media form a given exhibit potentially can have. These 165
conditions and their respective thresholds are shown in Table1. The media forms relate to the 166
Engagement Profile as follows: 167
Narrative media forms are described to be linear, highly structured, and non-interactive. Interestingly, 168
the entire range of N applies for this media form. To fit into the narrative media form, most 169
values of C, I, U, S, and E need to be rather low, i.e., between 0 and 2. Values above the threshold 170
of 2 need to be considered regarding their impact from case to case. 171
Interactive media forms allow learners to explore in a non-linear way, but the content remains 172
unchanged. This description aligns with high values of I, E and U; however, values of 5 for these 173
three variables are not suitable. Further, medium high or high values of S and E are suitable. 174
Communicative media forms support feedback and foster discussions, which indicates high values 175
of S. The other variables do not have an impact here. 176
Adaptive media forms adapt responses to the student’s actions. This is supported by high values of I, 177
Table 1.Engagement Profile indicators for media types
Laurillard’s taxonomy Engagement Profile indicator
activity media form
attending narrative 0≤z≤2, for most
apprehending z∈ {C, I, U, S, E}; (N not significant)
investigating interactive 3≤z≤4, for most
exploring z∈ {I, E, U}
discussing communicative 3≤S≤5
debating
experimenting adaptive 3≤y≤5; 2≤z≤5, for most
practising y∈ {I, E, A},z∈ {U, C}
articulating productive 4≤z≤5,
expressing for severalz∈ {C, N, I, U, S}
Productive media forms are tools where learners can express themselves to demonstrate their 179
understanding. This implies high values of C, N, I, U, and S. 180
In practice, supported media forms for a given exhibit can be estimated by first creating the 181
Engagement Profile, that is finding the most suitable description in Figure1or by using the textual 182
description in [2, p.56, Table II]. Thereafter, Table1is used to check whether the condition for each 183
media form is met. 184
4. Learning Trails 185
The learning trails at NTM are designed for school classes. They combine physics experiments 186
with technology history from the exhibitions, grouped thematically. To increase the learning effect, 187
these installations are intended to create a wider dialogue and narratives that explain science 188
phenomena. From the perspective of the GLO, increased knowledge and understanding are most 189
important outcomes, while the visit at the science centre shall be enjoyable and inspiring. 190
NTM has organised learning objectives for subjects that have been discussed in class before the 191
museum visit. Further, the museum also expected that students understand the task better when they, 192
additionally, can listen to content from an audio file. 193
There are indications from earlier observations at NTM that the students will be more quiet when 194
given organised tasks, instead of letting them explore the exhibits on their own. As in many science 195
centres, noise from school classes in the exhibition area can be annoying. Therefore, the learning trails 196
have been designed so that the single tasks are performed at different locations in the museum. 197
4.1. Concept of the Learning Trails 198
The learning trails are designed for self-experience in small groups of up to four students, lead by 199
the teacher. The total activity in a learning trail is meant to last less than 30 minutes. Upon arrival, 200
the students are divided into groups of up to four. Each group receives a set of experiments that the 201
members of one group shall solve together. These experiments take place in the exhibition of the 202
science centre and are related to exhibits (e.g., objects, boards, and pictures), installations, and areas 203
where the necessary ingredients for the experiment are available. 204
Each group needs at least one smart device (smartphone or tablet PC) with the possibility to use 205
Bluetooth for interaction with the beacon technology that provides the location service. The smart 206
devices are used to present tasks and extra content. Alternatively, tasks and content can be handed out 207
on paper. 208
The learning trails are compatible with the Bring Your Own Device (BYOD) paradigm, so that 209
science centres do not need to distribute these devices to the visitors. However, NTM can provide such 210
devices for school classes to avoid compatibility problems, as students might not have an own device 211
Table 2.List of experiments of the learning trails an reference to illustration image
learning trail # name description, activity Figure
“Forces” #1#2 PirouetteCup use installation, change speed through body movementscup, lace, pencil; does the cup break? 3b3a
#3 C. regulator observe model, watch video 3c
“Sound” #1#2 ThunderSpoon video: thunderstorm; count seconds: sound through tubelisten via medium air/laces: two teaspoons hit each other 3d3e
#3 Vacuum bell listen while pump makes vacuum around ringing bell 3f
“Light” #1#2 Light-tableLetterboard try out convex and concave lensesexperiments with long- and short-sightedness 3g3h
#3 Up-Down observe projected image through lenses, film 3i
Each group performs the given tasks and experiments at the stations of the learning trail. 213
Afterwards, all students participate in a quiz implemented with the Kahoot [26]. 214
4.2. Implementation of the Learning Trails 215
So far, NTM has developed three learning trails that offer content on the physical phenomena 216
of forces, sound, and light. Each learning trail has been implemented in two modes: I) the learning 217
trail is paper-based; i.e., instructions to the participants are printed on laminated cards; II) the learning 218
trail and its content are available on a device such as a smart-phone or tablet PC. This device will 219
automatically push instructions and extra content (such as illustrating videos and audio) to the 220
participants. The content is triggered as soon as the students approach the location of the respective 221
experiment of the learning trail. 222
The indoor-localisation technology was implemented using beacons that are based on Bluetooth 223
Low Energy (BLE). At each location of a learning trail experiment one beacon is placed. Actions are 224
triggered by the proximity of the device (smartphone or tablet PC) to the respective beacon. The 225
proximity level is classified into five zones A-E using the following thresholds: A:<1m; B:<2.5m; C: 226
<5m; D:<7.5m; and E: above. Depending on characteristics of the installation, we assume that a 227
participant is close by when being in Zone C, but for some exhibits Zone B is more appropriate. This 228
can be configured per exhibit. 229
While the student groups perform the learning trails, the students’ devices check the beacon 230
proximity about once every second. Notice that too high sampling rates could drain the device for 231
battery power. 232
4.3. The Experiments of the Learning Trails 233
Each learning trail consists of three experiments, which are performed according to a pre-defined 234
schedule. In total, nine experiments have been developed, each of them described as a sequence of 235
presentations, questions, and tasks to be performed by the student group. The experiments include 236
discussions in the group to reflect on the subject of the respective experiment. Table2gives a short 237
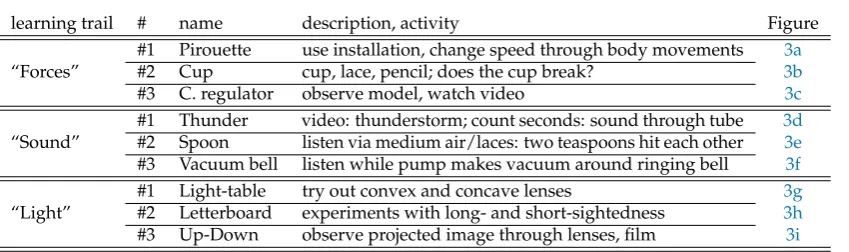
overview of these experiments, and illustrative photos taken during class visits are shown in Figure3. 238
For the learning trail forces, thepirouetteis an installation that can be used to explore rotation 239
movements. The students are asked to use the installation and change rotation speed through their 240
body movements (Figure3a).Cupis an experiment where a cup is attached to a lace. Given the lace is 241
led over a pencil and the cup is released, does it hit the ground? The students are asked to perform this 242
experiment (Figure3b). In a third experiment the students watch and discuss a model of a centrifugal 243
regulator (Figure3c). 244
For the learning trail sound,thunderis an experiment where the students watch the video of a 245
thunderstorm, and they count the seconds from when they see the lightning until they notice the 246
sound of the thunder through a long pipe (Figure3d).Spoonis an experiment where the students listen 247
(a) (b) (c)
(d) (e) (f)
(g) (h) (i)
Figure 3.Examples for the experiments in the three learning trails. Forces:(a)-(c). Sound:(d)-(f). Light:
Competition
Narra tive
In
te
ra
ct ivity
Ph ysical
User Control
Socia l
A ch iev
em
en
ts
Exp loratio
n
0 1 2 3 4 5
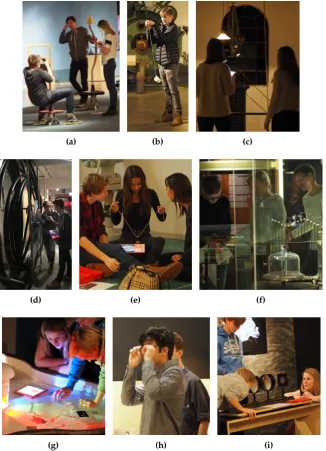
Figure 4.Engagement profile of a generic learning trail. The red dotted field indicates the S-value
when the learning trail is performed as a single visitor instead of in a group.
In the installationvacuum bella door bell is installed under a cheese dome, where a pump can generate 249
a vacuum. The students shall observe when they stop hearing the sound from the bell (Figure3f). 250
For the learning trail light,light tablelets the students try out convex and concave lenses (Figure3g), 251
whileletterboardprovides experiments with long- and shortsightedness (Figure3h). Inup-down, the 252
students observe a projected image through a set of lenses (Figure3i). 253
5. Engagement Profile and Media Forms of the Learning Trails 254
For the analysis of the learning trails, we consider the Engagement Profile of the generic learning 255
trail concept separately from the Engagement Profile of each experiment. In practice, we overlay the 256
Engagement Profile of each experiment with the Engagement Profile of the generic learning trail. We 257
also use the above described indicator to determine the media forms of the generic learning trail. 258
5.1. Engagement Profile of the Learning Trails 259
In Figure4, we show the Engagement Profile of a generic learning trail. The values for each of 260
the eight Engagement Profile dimensions are determined by considering which of the phrases in the 261
description fits best. As this process is based on subjective considerations, we note the following: Since 262
learning trails are usually performed in groups, we set the social dimension S=5 (for a single visitor 263
S=2). Regarding the narrative (N) dimension, the learning trails are structured sequentially without 264
the possibility for the student to alter this. Thus, we set narrative and user control to N=2 and U=1. 265
The remaining values are set according to which phrase of the Engagement Profile definitions (see 266
Figure1) fits best for each dimension. 267
5.2. Engagement Profile for the Single Experiments 268
We created the Engagement Profile for all nine of the experiments by subjectively determining 269
the phrase from Figure1that fits best. The charts for the experiments on forces, sound, and light, 270
respectively are presented in Figure5. 271
In the context of the learning trails, the Engagement Profile of the generic learning trail can be seen 272
as an overlay for the Engagement Profile of each experiment. Note that some of the characteristics of the 273
C
N
I
P
U
S
A
E a
0 1 2 3 4
5 C
N
I
P
U
S
A
E b
0 1 2 3 4
5 C
N
I
P
U
S
A
E c
0 1 2 3 4 5
(a)Learning trail forces
C
N
I
P
U
S
A
E a
0 1 2 3 4
5 C
N
I
P
U
S
A
E b
0 1 2 3 4
5 C
N
I
P
U
S
A
E c
0 1 2 3 4 5
(b)Learning trail sound
C
N
I
P
U
S
A
E a
0 1 2 3 4
5 C
N
I
P
U
S
A
E b
0 1 2 3 4
5 C
N
I
P
U
S
A
E c
0 1 2 3 4 5
(c)Learning trail light
Figure 5.Engagement profile of the three experiments in the three learning trails (blue marking are for
Table 3.Media form evaluation of generic learning trails. Relevant parameters are marked with3if
condition is met and with7else. Unmarked entries do not have an impact according to Table1.
media form C N I P U S A Ea decision
Narrative 3 3 3 3b 7 3
Interactive 7 7 3 7
Communicative 3c 3c
Adaptive 7 7 7 3 3 7
Productive 7 7 7 7 3c 7
a impact is not considered to be relevant for learning trails. b if visitor is alone.
c if visitor is in group.
of a single experiment might not have an impact. For instance, increasing the social dimension for a 275
task might not have an impact, as the social dimension of the generic learning trail is already high. 276
5.3. Media Forms of the Learning Trails 277
Using the Engagement Profile of the generic learning trail and the translation in Table1, we could 278
determine the applicable media forms of the learning trail concept. Table3shows the outcome of this 279
analysis, indicating with3the conditions that applied and with7those that failed. Unmarked entries
280
do not contribute to the respective media form (cf. Figure2). 281
Note that not all values of the Engagement Profile are equally important, and considerations on 282
the impact on each value need to be made. For instance, the impact of E is considered to be weak in 283
the case of the interactive media form, as time constraints apply for school classes (i.e., the duration of 284
the visit is limited). 285
From Table3we conclude that the narrative and the communicative media forms apply for the 286
learning trails in their generic formation. However, when a learning trail is performed by a single 287
student, the communicative media form does obviously not apply. As a consequence, the concept 288
of the learning trails supports predominantly the activities of attending, apprehending, discussing, 289
and debating. Note that the concept of the learning trails does not focus on debating as an activity. 290
Elements of investigaging, exploring, and experimenting are present, but not predominantly. The 291
activities of practising, articulating, and expressing are least present, and we recognise that the learning 292
trails are not developed for these activities. 293
6. Studying the Learning Trails 294
We wanted to explore whether we can observe differences for the operation modesIandII, as 295
well as other characteristics of the learning trails. We studied this by collecting data from school classes 296
performing the learning trail and analysed these data by aligning them with observations. 297
6.1. Test setup. 298
Each of the three learning trails consisted of three experiments, here denoted as At, Bt, and Ct 299
for learning trailt. After each performed experiment, the participants answered a micro survey M 300
with four questions; after the last micro-survey there was one further question denoted as survey S. 301
See Table4for the survey questions. Finally, all participants answered a Kahoot quiz K where the 302
correctness of the students’ answers were evaluated. Thus, each group undergoes one of the sequences 303
AtMBtMCtMSK, BtMCtMAtMSK, or CtMAtMBtMSK. The answers given in the micro-surveys and 304
the positioning data were stored in the respective tablet PCs and analysed later. 305
We implemented this entire procedure for both modes, that is ModeIfor the paper-based version 306
and ModeII where interactive content is pushed to the students’ devices when approaching the 307
respective experiment. In our study, the participants were divided into groups of three or four; one 308
Table 4. Formulation of the questions and scales for experimentiand learning trailt. The second column indicates the category (F=fun, R=recommend, A=use again, K=knowledge).
M1it F How much did you like Experiment(i,t)? — scale: 1-7 (not at all – very much)
M2it R I recommend Experiment(i,t)to others who visit the science centre. — scale: 1-7
(totally disagree – totally agree)
M3it A When I’ll visit the science centre next time, I’ll use Experiment(i,t). — scale: 1-7
(totally disagree – totally agree)
M4it K How much did you know from your school classes about the subject of Experiment
(i,t). — scale: 1-5 (1=nothing, 2=a little, but don’t remember much, 3=something,
4=quite a lot, 5=very much)
L Which of the experiments At, Bt, Ctdid you like best?
used for answering the micro-surveys, for logging the relative position of the device, and for accessing 310
the content (modeIIonly). Participants that were not group leaders could answer survey questions on 311
tablet PCs that were placed near the installations they visited. The participants were not aware of the 312
test setup of other groups. 313
As each session included up to nine groups of students with three to four participants each, we 314
made some precautions that groups do not interfere with each other, e.g., use the same installation 315
concurrently. 316
We developed separate apps for each of both modes: App I for the paper-based version 317
implemented the micro-surveys and logged the relative positions to the beacons. The micro-surveys 318
were automatically triggered when a group left an area or time was up. This version did not give access 319
to extra content. AppIIautomatically presented tailored content when the participants approached an 320
experiment; it also implemented the micro-surveys and logs. Note that all participating groups were 321
given a tablet PC under the trials to avoid an extra bias when some groups used a tablet PC while 322
others would not. 323
The questions of the micro-surveys given in Table4reflected whether the participants liked an 324
experiment, recommendation to others, the willingness to use the experiment again, and which of the 325
three experiments they liked best. These factors can give a good indication whether a participant liked 326
an experiment [27]. Additionally, a self-report about the pre-visit knowledge can indicate how much 327
they learnt, together with the number of right and wrong answers in the quiz. 328
We had planned a further question whether the participants had enough time to use the 329
installation. However, after preliminary tests, we recognised that the learning trails were absolved 330
much faster than anticipated. Consequently, this question was obsolete and removed from the survey. 331
6.2. Test Results 332
Students from school classes at the lower secondary school in the Oslo area participated in the 333
study. In total, five sessions were done between Autumn 2016 and Spring 2017. In total, 113(34, 38, 41) 334
participants appear in our log files; the numbers in parenthesis denoting participants in the learning 335
trails “Forces”, “Sound”, and “Light”, respectively. The students were divided into groups of two 336
to four to enable discussion and interaction in between them. One of each group was selected as 337
spokesperson, here denoted as the group leader. The number of group leaders wasn=41(14, 14, 13); 338
n = 14(5, 5, 4)for ModeIandn = 26(9, 9, 8)for ModeII. The number of samples was too low to 339
determine whether ModeIor ModeIIwas more engaging; we did not recognise obvious trends. 340
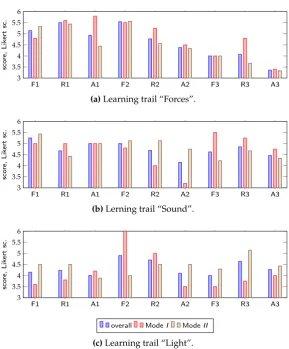
6.2.1. Results for all participants 341
Figure6shows the results from the questionnaires for the variablesF,R, andAfor each of the 342
nine experiments and for all participants. As expected, the installations in the learning trails received 343
different ratings. This result can be used by the science centre to evaluate which of the experiments are 344
liked better than other experiments. As an observation, it seems that the leaning trail for light received 345
F1 R1 A1 F2 R2 A2 F3 R3 A3
3 3.5 4 4.5 5 5.5 6
sco
re,
Lik
ert
sc.
(a)Learning trail “Forces”.
F1 R1 A1 F2 R2 A2 F3 R3 A3
3 3.5 4 4.5 5 5.5 6
sco
re,
Lik
ert
sc.
(b)Lerning trail “Sound”.
F1 R1 A1 F2 R2 A2 F3 R3 A3
3 3.5 4 4.5 5 5.5 6
sco
re,
Lik
ert
sc.
overall ModeI ModeII
(c)Learning trail “Light”.
Figure 6. Response scores for tests with three learning trails and the three stations ion a Likert
scale for the variables forfunFi, recommendRi andplay again Ai. The number of participants is
F1 R1 A1 F2 R2 A2 F3 R3 A3
3 3.5 4 4.5 5 5.5 6
sco
re,
Lik
ert
sc.
(a)Learning trail “Forces”.
F1 R1 A1 F2 R2 A2 F3 R3 A3
3 3.5 4 4.5 5 5.5 6
sco
re,
Lik
ert
sc.
(b)Lerning trail “Sound”.
F1 R1 A1 F2 R2 A2 F3 R3 A3
3 3.5 4 4.5 5 5.5 6
sco
re,
Lik
ert
sc.
overall ModeI ModeII
(c)Learning trail “Light”.
Figure 7.Group leader response scores for tests with three learning trails and the three stationsion a
Likert scale for the variables forfunFi,recommendRiandplay againAi. The number of group leaders is
n=41(14, 14, 13);n=14(5, 5, 4)for ModeIandn=26(9, 9, 8)for ModeII.
Table 5.Number of group leaders who liked which experiment best.
Experiment #1 #2 #3 no vote
“Forces” 9 4 0 1
“Sound” 3 5 5 1
“Light” 4 0 6 3
rating than most of the others. We observed some unexpectedly high values for the learning trail for 347
light in one of the experiments for ModeI. 348
6.2.2. Results for group leaders 349
As we suspected irregularities in the data set caused by the technical setup of stationary tablet 350
PCs used for the micro surveys, we also extracted the data for the group leaders. The results for group 351
leaders are shown in Figure7. Still, it is not obvious which of the two modes was more engaging. 352
6.2.3. Group leaders vs. ordinary participants 353
We classified the answers into those from group leaders and ordinary participants for ModeI
354
and ModeII. From these results, shown in Figure8, we did not recognise significant differences in 355
pre-visit knowledge between the participants. For the variablesF,R, andA, we cannot see significant 356
differences between the four groups. However, the participants in ModeIIgive slightly lower scores 357
F R A K
0 1 2 3 4 5 6
sco
re,
Lik
ert
sc.
grpl. ModeI all ModeI grpl. ModeII all ModeII
Figure 8.Response scores for tests with learning paths on a Likert scale for the variables forfunF, recommendR andplay againA and pre-visit knowledge K.
Table 6.Results from the knowledge questions for all participants: percentage of right answers for all
participants. Questions that are not related to the experiment are marked with∗.
Question “Forces” “Sound” “Light”
#1 73% 69% 44%
#2 21% 21% 19%
#3 24% 72% 14%
#4 9% ∗13% 11%
#5 65% ∗71% 50%
#6 ∗ 3% 14% 88%
#7 21% 56% 0%
#8 12% 15% 42%
#9 ∗56% 78% 54%
32% 45% 36%
6.2.4. Experiment Preferences 359
The results for the question which of the experiments the group leaders liked best is shown in 360
Table5. Note that some group leaders failed to register for this question. For “Forces” and “Sound”, 361
these numbers are compatible with the results in Figure7. However, for “Light”, there is a discrepancy, 362
as experiment #2 received no likes while it was rated rather high in the scores. As a further observation, 363
the experiment “Pirouette” (see Figure3a) received the highest number of mentions. 364
6.2.5. Knowledge questions 365
We evaluated the number of correct answers to knowledge questions. Each question has four 366
alternatives where one of these is correct. Of the questions, there is always one “odd” alternative; it 367
does not seem that the participants chose these to a large degree. Table6shows the percentage of 368
correct answers. We marked questions that are about content that has not been presented during the 369
experiment with an asterisk (∗). 370
For the knowledge question, it is not significant whether ModeIor ModeIIis used, nor whether 371
the participants are group leaders. As a further observation, the pre-visit knowledge is in the average 372
rather low (see the factorKin Figure8). 373
6.3. Discussion of the Results 374
We went into the study with the expectation that ModeIIwould be preferred by the participants 375
and, thus, resulting in higher scores. So far, we did not find evidence for this. We recognised that the 376
number of participants in the single parts of the study is too small to show significant preferences. 377
The low impact of the mode to the result might be caused by a rather large impact of the design, 378
activities, and use of other modalities to convey the content. In other words, the learning trail might be 379
minor impact. Another source of error might be the research setting that the students might not be 381
used to. Further, in our study, the presented content did not fully use the extra possibilities for the 382
push-medium. 383
As a note, there are other studies where the mode of presentation did not have the expected 384
impact. For instance, Vogtet al.[28] reported from a study where social robots were used to tutor 385
children in second language learning. They could not find the expected differences in the learning 386
effect between modes that were different in their implementation (tablet only vs. use of a social robot, 387
the latter with and without the use of gestures), although they performed a large scale study. 388
In our study, there is an indication that participants that are not group leaders in ModeIIgive 389
lower ratings for the variables for fun, recommend, and play again. Possibly, these participants are not 390
enough included when the group leader is working with the tablet PC. Although this effect is rather 391
small, that might be an indication that all participants should be given a tablet PC while performing a 392
learning trail. 393
There was an expectation that the students will be more quiet with organised tasks, and the 394
learning outcome will increase. During the study, we could observe that the students were more 395
quiet compared to ordinary science centre visits, although we did not perform concrete noise level 396
measurements. We leave this for future work. 397
There are indications that the characteristics of the learning trails may contribute essentially to 398
our result. The content of the learning trail for light received low scores, which can be explained by the 399
content being closer to the curriculum, being built up more theoretically, and having less engaging 400
video content than the other two learning trails. However, note that the learning outcome is not 401
necessarily related to the scores, nor to the Engagement Profile. 402
As a further note, the low scores for the experimentcentrifugal governorcould be a result of this 403
experiment consisting of looking of an object and solving a simple task. This is also visible in the chart 404
of Figure5a.c. In contrast, the experimentcup(see the chart in Figure5a.b) seems to be more engaging, 405
and will evoke more enjoyment, inspiration, creativity, activity, behaviour, and progression. 406
For NTM, the correctness level for the knowledge questions is in the usual range, compared to 407
internal studies. Commonly, the pre-visit knowledge is rather low when the students arrive at the 408
science centre. As the subjects treated by the learning trails are rather theoretical, we expected that 409
only few students were able to answer correctly. For school classes, pre-visit knowledge can often be 410
more relevant than the learning outcome from the experiments. 411
The Kahoot-quiz was performed right after the learning trails had been performed, and the learnt 412
had not yet been internalised by the students. Thus, the Kahoot could act as an engaging repetition 413
that would have helped in the internalising process of the learnt knowledge. A repetition of the Kahoot 414
some weeks after the science centre visit could have given more evidence. 415
NTM had tried several location-based concepts before; these have not worked well. In contrast, 416
the learning trails using location-based services worked well. 417
6.4. Evaluation with the Engagement Profile 418
The Engagement Profile supports design choices for improvements of installations [5], here 419
applied to the experiments of learning trails. For experiments that did not score high, we can consider 420
which dimensions of the Engagement Profile could be altered. In the context of the learning trails, the 421
social dimension S is already high, and changing S for experiments could interfere with the idea of 422
the learning trails. The factors A and E are considerably high for the generic learning trail. Thus, we 423
regard mostly the other dimensions of the Engagement Profile when considering improvements. 424
In our study, #3 of “Forces”, #2 of “Sound”, and all of the experiments of “Light” received low 425
scores. In Figure5a.c, the Engagement Profile of this experiment shows rather low engagement factors 426
for #3 of “Forces”. In Figure5b.b, the Engagement Profile of this experiment shows low engagement 427
Figure5c. Thus, either of the factors but S (and to some degree A and E) can be considered for an 429
improvement of these experiments. 430
From our previous work [3] we know that the factors C, P, and U are important for the target 431
group (school children). To improve the experiments of the learning trails, we recommend adding 432
more competition, adding more physical activity, and/or designing the experiments for more user 433
control. 434
6.5. Learning Trails and the GLO 435
To answer which GLO are supported by the learning trails, we revisit the five outcomes. The 436
media forms and learning experiences derived from the Engagement Profile (see Table1) are used 437
check which of the GLO is supported by the learning trail concept. 438
Knowledge and understanding: The activities of attending and apprehending are supported, while 439
activities such as exploring or experimenting are more a part of the single experiment. Generally, 440
the learning trails can be said to support this outcome. 441
Skills: The activities of practising, but also investigating, exploring, and experimenting are not 442
predominant in the learning trails. Although these activities might be supported by the single 443
experiment, the learning trails do not support this outcome in general. 444
Change of attitude: The concept of the learning trails is too generic to support this outcome. However, 445
specific experiments in the learning trails might support this outcome. 446
Enjoyment, inspiration, and creativity: We found that the mean value of the responses for “I liked 447
the experiment” were on the positive side for almost all single experiments. Unfortunately, we 448
could not test the generic learning trail separately, as the single experiments would have had a 449
significant impact on enjoyment. For inspiration and creativity, the single experiment will have 450
most impact. 451
Activity, behaviour, and progression: Their outcomes are not measured with the learning trails. 452
Further, as the productive activity is not supported by the generic learning trails, this cannot be 453
said to be supported. 454
Thus, we conclude that for the concept of the learning trails, knowledge and understanding as 455
well as enjoyment are the most predominant terms of the GLO. 456
7. Conclusion 457
The science centre NTM has developed the concept of learning trails where a number of 458
thematically connected experiments are performed by a group of students. A learning trail can 459
be implemented based on laminated sheets or using apps on a tablet PC and location-based online 460
content. In our study, we could not find evidence which of these two modes is better liked or gives a 461
better learning outcome. The learning trail “Forces” performed best in our study. Further we discussed 462
the scores for the learning trails and single experiments from the findings of our study. In our study, 463
the number of samples was too low, i.e., more experiments are required to evaluate which learning 464
trail or experiment scores better than others. 465
We used the Engagement Profile as a roadmap for suggestions to improve the experiments of the 466
learning trails in the study by considering those dimensions of the Engagement Profile that are low for 467
the experiment and the overall learning trail. It is the task of designers to suggest the concrete changes 468
that are needed to increase engagement. 469
We also developed an indicator to determine the media form of exhibits. The concept of the 470
learning trails implements mostly the narrative and communicative form, supporting the activities of 471
attending, apprehending, and discussing. We also related the Engagement Profile to the media forms 472
and the GLO by setting up a set of condition for translation. 473
For NTM, the learning trail concept is promising and will be further developed to give students an 474
overall rating for most of the experiments and for the concept were on the positive side, i.e., in average 476
larger than 3.5 on the Likert scale. Further, the study also gave evidence which of the experiments 477
were preferred. The Engagement Profile of the experiments can show how to adjust the experiments to 478
increase the engagement factors (see also [5]). Our research could also show that the learning trails 479
primarily support the GLO of knowledge, understanding and enjoyment. 480
Conflict of Interest Statement 481
The experiments were performed at the NTM, where two of the authors (J.A.A., H.H.) are affiliated. 482
The learning trails were implemented as a potential product by Expology, where one of the authors 483
(G.J.) is affiliated. Beyond these facts, the authors declare that the research was conducted in the 484
absence of any commercial or financial relationships that could be construed as a potential conflict of 485
interest. 486
Author Contributions 487
All authors contributed to this paper as joint work in the context of the VISITORENGAGEMENT 488
project. W.L. and I.T. developed the concept, while W.L. prepared the scientific background. J.A.A. and 489
H.H. developed the concept of the learning trails. G.J. and I.T. implemented the learning trails at the 490
NTM and performed the experiments at the NTM together with J.A.A. and H.H. W.L. and I.T. analysed 491
and discussed the data. The paper was written by W.L. with text contributions by all co-authors. 492
Photographs 493
The photographs in Figure3were taken by some of the authors during the study at NTM. The 494
persons depicted on these images have given their written consent that photographs taken during the 495
study can be used in publications. 496
Data Protection 497
The VISITORENGAGEMENTproject is registered with the Norwegian Centre for Research Data 498
(NSD) who acts as a data protection ombud for studies performed in the project. Personal data 499
gathered during the study have been anonymised or deleted after analysis. We state that personal data 500
of participants in the study cannot be retrieved from the here published results. 501
Funding 502
This research has been carried out in the context of the project VISITORENGAGEMENTfunded by 503
the Research Council of Norway in the BIA programme, grant number 228737. Further, this research 504
has been supported through basic institute funding at Norsk Regnesentral, RCN grant number 194067. 505
Project Information 506
The objective for the VISITORENGAGEMENTproject was to measure the degree of engagement 507
and user experience in science centres and museums. This was done by means of sensor and camera 508
technology and the registration of user behaviour, in combination with short surveys. Project partners 509
were Expology, Norsk Regnesentral (Norwegian Computing Centre), The Norwegian Museum of 510
Science and Technology, The Norwegian Maritime Museum, Engineerium, and the Department of 511
Education at the University of Oslo. For information about the project, we refer to the project base 512
entry at the Research Council of Norway [29] and previous publications [2,3,5,11,27,30]. 513
Acknowledgments 514
The authors wish to thank Michel de Brisis for his contributions in the research project and Anders 515
the study. We also thank Ivar Solheim at Norsk Regnesentral for discussions while preparing the paper 517
and all our colleagues in the VISITORENGAGEMENTproject for their input and comments. 518
519
1. Hofstein, A.; Rosenfeld, S. Bridging the gap between formal and informal science learning. Studies in
520
Science Education1996,28, 87–112.
521
2. Leister, W.; Tjøstheim, I.; Joryd, G.; Schulz, T.; Larssen, A.; de Brisis, M. Assessing Visitor Engagement in
522
Science Centres and Museums. Journal on Advances in Life Sciences2016,8, 49–63.
523
3. Leister, W.; Tjøstheim, I.; Norseng, P.G.; Joryd, G.; Bagle, E.; Sletten, H.T. Digital Storytelling
524
and Engagement in Exhibitions about Shipping. Norsk museumstidsskrift 2018, 4, 50–73.
525
doi:10.18261/issn.2464-2525-2018-02-02.
526
4. Hooper-Greenhill, E. Measuring Learning Outcomes in Museums, Archives and Libraries: The
527
Learning Impact Research Project (LIRP). International Journal of Heritage Studies 2004, 10, 151–174.
528
doi:10.1080/13527250410001692877.
529
5. Leister, W.; Tjøstheim, I.; Joryd, G.; de Brisis, M.; Lauritzsen, S.; Reisæter, S. An Evaluation-Driven Design
530
Process for Exhibitions. Multimodal Technologies Interact.2017,1, 1–13. doi:10.3390/mti1040025.
531
6. Brown, S. A critique of generic learning outcomes.Journal of Learning Design2007,2, 22–30.
532
7. Laurillard, D.Rethinking University Teaching: A Conversational Framework for the Effective Use of Learning
533
Technologies; RoutledgeFalmer, 2002. 534
8. Ayudhya, W.S.N.; Vavoula, G. Mobile Family Learning in the Science Museum. Proceedings of the 16th
535
World Conference on Mobile and Contextual Learning; ACM: New York, NY, USA, 2017; mLearn 2017, pp.
536
22:1–22:8. doi:10.1145/3136907.3136948.
537
9. Bitgood, S. An Attention-Value Model of Museum Visitors. Report, Jacksonville State University, 2010.
538
10. Fredricks, J.A.; Blumenfeld, P.C.; Paris, A.H. School Engagement: Potential of the Concept, State of the
539
Evidence. Review of Educational Research2004,74, 59–109. doi:10.3102/00346543074001059.
540
11. Cooney, M.; Leister, W. Using the Engagement Profile to Design an Engaging Robotic Teaching Assistant
541
for Students. Robotics2019,8, 21. doi:10.3390/robotics8010021.
542
12. Ocampo-Agudelo, J.; Maya, J.; Roldán, A. A Tool for the Design of Experience-Centred Exhibits in Science
543
Centres. poster at Science Centre World Summit – SCWS2017, 2017. doi:10.13140/RG.2.2.22080.43520.
544
13. Lindauer, M. What to ask and how to answer: a comparative analysis of methodologies and philosophies
545
of summative exhibit evaluation.museum and society2005,3, 137–152.
546
14. Baldwin, T.; Kuriakose, L.T. Cheap, Accurate RFID Tracking of Museum Visitors for Personalized Content
547
Delivery. Museums and the Web; , 2009.
548
15. Parsons, J.; Ralph, P.; Gallagher, K. Using Viewing Time to Infer User Preference in Recommender Systems.
549
Proc. AAAI Workshop on Semantic Web Personalization held in conjunction with the 9th National
550
Conference on Artificial Intelligence (AAAI’04); , 2004.
551
16. Yalowitz, S.S.; Bronnenkant, K. Timing and Tracking: Unlocking Visitor Behavior. Visitor Studies2009,
552
12, 47–64. doi:10.1080/10645570902769134.
553
17. Yoshimura, Y.; Sobolevsky, S.; Ratti, C.; Girardin, F.; Carrascal, J.P.; Blat, J.; Sinatra, R. An analysis of visitors’
554
behavior in the Louvre Museum: a study using Bluetooth data. Environment and Planning B: Planning and
555
Design2014,41, 1113–1131. 556
18. Moussouri, T.; Roussos, G. Examining the Effect of Visitor Motivation on Observed Visit Strategies Using
557
Mobile Computer Technologies. Visitor Studies2013,16, 21–38. doi:10.1080/10645578.2013.767732.
558
19. Moussouri, T.; Roussos, G. Conducting Visitor Studies Using Smartphone-Based Location Sensing. J.
559
Comput. Cult. Herit.2015,8, 12:1–12:16. doi:10.1145/2677083. 560
20. Bohnert, F.; Zukerman, I. Non-Intrusive Personalisation of the Museum Experience. Proceedings of the
561
17th International Conference on User Modeling, Adaptation, and Personalization (UMAP-09), 2009, pp.
562
197–209.
563
21. Bitgood, S. Designing Effective Exhibits: Criteria for Success, Exhibit Design Approaches, and Research
564
Strategies. Visitor Behaviour1994,IX, 4–15.
565
22. Mautz, R. Indoor Positioning Technologies. habil thesis, ETH Zürich, Environmental and Geomatic
566
Engineering, Institute of Geodesy and Photogrammetry, 2012.
23. Lymberopoulos, D.; Liu, J.; Yang, X.; Choudhury, R.R.; Handziski, V.; Sen, S. A Realistic Evaluation and
568
Comparison of Indoor Location Technologies: Experiences and Lessons Learned. Proceedings of the 14th
569
International Conference on Information Processing in Sensor Networks; ACM: New York, NY, USA, 2015;
570
IPSN ’15, pp. 178–189. doi:10.1145/2737095.2737726.
571
24. Bickersteth, J.; Ainsley, C. Mobile Phones and Visitor Tracking. Museums and the Web; , 2011.
572
25. Noldus, L.P.J.J.; Loke, B.; Kelia, M.; Spink, A.J. Automated Mobile User Experience Measurement:
573
Combining Movement Tracking with App Usage Logging. Creating the Difference: Proceedings of the Chi
574
Sparks 2014; van Leeuwen, J.P.; Stappers, P.J.; Lamers, M.H.; Thissen, M.J.M.R., Eds., 2014, pp. 31–34.
575
26. Wang, A.I. The wear out effect of a game-based student response system. Computers & Education2015,
576
82, 217 – 227. doi:10.1016/j.compedu.2014.11.004.
577
27. Tjøstheim, I.; Leister, W.; Larssen, A.; Schulz, T. The Role of Emotion and Enjoyment for QoE – a Case Study
578
of a Science Centre Installation. Proc. QoMeX 2015, The 7th Intl. Workshop on Quality of Multimedia
579
Experience; Skodras, A., Ed. IEEE, 2015, pp. 1–6.
580
28. Vogt, P.; van den Berghe, R.; de Haas, M.; Hoffmann, L.; Kanero, J.; Mamus, E.; Montanier, J.M.; Oranc, C.;
581
Oudgenoeg-Paz, O.; Garcia, D.H.; Papadopoulos, F.; Schodde, T.; Verhagen, J.; Wallbridge, C.D.; Willemsen,
582
B.; de Wit, J.; Belpaeme, T.; Göksun, T.; Kopp, S.; Krahmer, E.; Küntay, A.C.; Leseman, P.; Pandey, A.K.
583
Second Language Tutoring using Social Robots. A Large-Scale Study. Proceedings of the 2019 ACM/IEEE
584
International Conference on Human-Robot Interaction (HRI 2019), 2019.
585
29. Visitor Engagement. Entry in PROSJEKTBANKEN, Research Council of Norway, https://www.
586
forskningsradet.no/prosjektbanken/#/project/NFR/228737/Sprak=en, 2017. accessed: 8 September,
587
2018.
588
30. Leister, W.; Tjøstheim, I.; Joryd, G.; Schulz, T. Towards Assessing Visitor Engagement in Science Centres
589
and Museums. Proc. PESARO 2015, The Fifth Intl. Conf. on Performance, Safety, and Robustness in
590
Complex Systems and Applications. IARIA, 2015, pp. 21–27.
591
Abbreviations 592
The following abbreviations and names are used in this manuscript:
593 594
BLE Bluethooth Low Energy
BYOD Bring Your Own Device
EP Engagement Profile
FM Frequency Modulated
GLO Generic Learning Outcomes
GPS Global Positioning System
NSD Norwegian Centre for Research Data (norw. Norsk Senter for Forskningsdata)
NTM Norwegian Museum for Science and Technology (norw. Norsk Teknisk Museum)
PC Personal Computer
RFID Radio Frequency IDentification
TMSI Temporary Mobile Subscriber Identity