IJEDR1402188
International Journal of Engineering Development and Research (www.ijedr.org)2474
Experimental and Computational Fluid Dynamic
Analysis of External Gear Pump
1
Mr. Dipen Rana
,
2Mr. Nirmal Kumar
1ME Student, 2Assistant Professor 1Mechanical Engineering Department,
Shree S’ad Vidya Mandal Institute of Technology,Bharuch,India 1[email protected], 2[email protected]
________________________________________________________________________________________________________
Abstract— CFD analysis is applying for to know flow behavior inside the pump that cannot be captured in physical
testing. Prepare experimental setup for generate experimental data. From experimental find the pump operating pressure at maximum rpm. When applying simulation with the experimental inlet boundary condition and rotation, it has generated profile. This profile was very accurate with measure quantity so, simulation validate accurately. With this feedback simulate for 4 psi deliver pressure which is required to circulate in punching machine. This gives good agreement with experimental result.
Index Terms—CFD gear rotor, experiment of external gear pump test rig
________________________________________________________________________________________________________
I.INTRODUCTION
The gear rotor pump is gaining widespread application and acceptance for automotive oil and fuel delivery purposes due to its simplicity and versatility in design and manufacture. It is basically an internal gear type rotary positive displacement pump. It is driven by engine crankshaft. Gear rotor pumps provide high volumetric efficiency and smooth pumping action. Further, they work well with a wide range of fluid viscosities. Due to manufacturing tolerances, flow leakages do occur through the tip clearances of the gear teeth. To limit the working pressure, excess fluid is re-circulated to the inlet cavity through a pressure relief valve system. In theory, the pumping action is only a function of the gear rotational speed, and discharge is constant regardless of the operating pressure. In practice, however, leakage through the gaps is formed by the meshing gears which increase with increasing in pressure.
II.GEAR ROTOR PUMP OPERATION
When the pump is operating the delivery pressure should be at maximum over the whole upper chamber and the lowest pressure inside the pump will be found at the suction side. The pressure should increase proportionally from the first tooth space volume until it reaches a maximum at the delivery section. This pressure increase causes the pump to feel radial loads which increasing from the suction side to the delivery side. The stresses due to the pressure differences are therefore highest at the delivery area of the pump.
Figure 1 Gear rotor Pump Operation[1]
IJEDR1402188
International Journal of Engineering Development and Research (www.ijedr.org)2475
number of teeth as possible. The fluid transport process ends when the meshing of the gears forces the liquid through the outlet under high pressure, this area is commonly called the discharge chamber.III.PREVIOUS RESEARCH
Many engineers have analyzed gear rotor and other types of positive displacement pumps analytically , but few have used CFD packages to simulate the flow within the pump. A kinematic analysis of gear rotor pumps was performed by Fabiani et al [2]. Other engineers simulate gear rotor pumps using anal typical programs, such as the Advanced Modeling Environment Simulation (AMESim) [3]. This simulation was able to accurately predict the oil flow rate through the pump at low pump speeds, but at high pump speeds (over 4000 RPM), the simulated f low differs from the experimental flow . This occurs because the effects of cavitations and aeration were not modeled.
Kluger etal studied the performance of several pumping systems by studying experimental results [4]. Pumps tested included positive displacement pumps (crescent type with in volute gears, crescent type with hypocycloidal gears, gear rotor, and Duo centric pumps) and a variable displacement (vane) pump. The experimental results showed that the Duo centric and hypocycloidal pumps had 5-10% greater overall efficiency over the other pumps. All results were normalized for displacement, as exact displacements could not be matched.
Jiang and Perng simulated vane and gear pumps using mixed tetrahedron, hexahedron, and polyhedron unstructured meshes [5]. They specified atmospheric pressure at the inlet of the pump and the pump rise (50-100 PSI) at the outlet. Pumps were simulated at speeds ranging from 500 to 6000 RPM. A sliding interface was used to combine the moving and deforming mesh of the pumps with the stationary mesh in other parts of the pump. They were able to match the volumetric efficiency with experimental results. The computational torque values were under predicted at low speeds (below 2200 RPM) and over -predicted at high speeds (above 2200 RPM). The authors concluded that the cavitations seen in experimental results caused the differences in torque values. Other studies used hexahedral mesh elements and the standard k -ϵ turbulence model to simulate vane and gear rotor oil pumps in automatic transmissions [6].
Scope of work from this literature studies are prepairing experimental setup for generate experimental data at various rpm of gear pump. Modelling of gear pump and apply it to Computational fluid dynamics (CFD) analysis for generating computational data and validated using physical test data. To achieved operating pressure with same configuration setup for supply into the punching machine. To check performance of selected pump with various speed of motor.
IV.EXPERIMENT SET UP AND TESTING
The lubricant flow in the engine is mainly dependent on the flow characteristics of the oil pump. The experimental set consist of & gear pump, on whose suction side a vacuum gauge is attached while on the discharge side, a pressure gauge is fitted for measurement of the delivery head. Schematic arrangement of test rig of gear pump is shown in Fig.2. Test rig consists of a motor, oil sump, voltmeter, ammeter, tachometer and varies for vary motor speed. The main parameters that were observed from the test rig are: Speed of the gear pump (rpm), Vacuum Pressure of the oil at inlet(mmHg), Discharged pressure of oil at outlet(psi), Measure Discharge flow (lit/min).
Figure 2 Gear rotor oil pump test rig
IJEDR1402188
International Journal of Engineering Development and Research (www.ijedr.org)2476
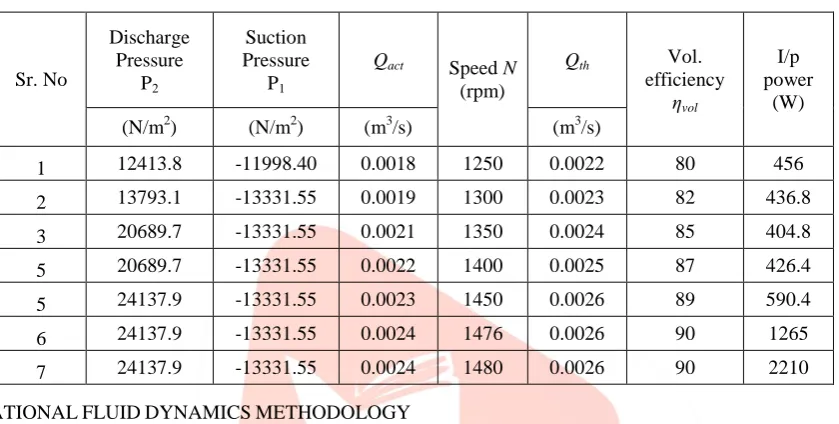
main current supply line. Through varies connection attached with volt meter, ammeter and motor of single phase. After that work done the power switch is on and varies voltage to set required rpm of motor with the help of tachometer. Certain rpm range (1250- 1480) set with the help of tachometer and measure the value of inlet pressure and outlet pressure through pressure gauge for each rpm. At the time of set each rpm also measure the voltage and ampere to know about actual voltage required for each rpm and at each rpm load on the motor. At the time of experiment observed that the motor is not run speed below 1240 rpm and above1480 rpm. Because motor required minimum 80 volt to run and also at 1480 rpm motor required 260 volt and running with the overload condition so ampere is increase and chance to damage the motor. So we collect data of motor speed between 1250 rpm to 1480 rpm. At the last measured the discharge flow rate at regular voltage 230 volt and 1476 rpm. Start the set up and continue to remain in running condition. After five minutes measure the discharge flow rate with the help of flask capacity of 10liter. Measure the flow rate for five second. We take three reading for same time duration and average value of discharge flow is calculated. Whole experimental data and result of experimental have shown in table 1 as below.Table 1 RESULT OF EXPERIMENT
Sr. No
Discharge Pressure
P2
Suction Pressure
P1
Qact Speed N
(rpm)
Qth Vol.
efficiency
ηvol
I/p power
(W)
(N/m2) (N/m2) (m3/s) (m3/s)
1 12413.8 -11998.40 0.0018 1250 0.0022 80 456
2 13793.1 -13331.55 0.0019 1300 0.0023 82 436.8
3 20689.7 -13331.55 0.0021 1350 0.0024 85 404.8
5 20689.7 -13331.55 0.0022 1400 0.0025 87 426.4
5 24137.9 -13331.55 0.0023 1450 0.0026 89 590.4
6 24137.9 -13331.55 0.0024 1476 0.0026 90 1265
7 24137.9 -13331.55 0.0024 1480 0.0026 90 2210
V.COMPUTATIONAL FLUID DYNAMICS METHODOLOGY
In CFD analysis geometry creation is a first step to create physical domain. This domain can help for further simulation. So, it is difficult task to make geometry having fluid domain. Ansys Design modeler is using for geometry creation. It is shown in Figure 5.2 Meshing is a part of modeling. After complete geometry mesh will be applying on geometry. Meshing was required element size, element type and element connectivity in terms of skeewness which can be set in Ansys mesh modeler. Complete step of mesh generation not down element number and node number which can use for grid independency study. Mesh of above figure 5.2 is shown in figure number 5.3. Boundary conditions specify the flow and thermal variables on the boundaries of your physical model. They are, therefore, a critical component of your FLUENT simulations and it is important that they are specified appropriately. As shown in figure 5.4
IJEDR1402188
International Journal of Engineering Development and Research (www.ijedr.org)2477
VI.RESULT AND DISCUSSIONA line graph of rpm vs volumetric efficiency. In this graph compare pump speed with pump volumetric efficiency. From the experimental evidence it was observed that the efficiency of pump achieve more than 80% to 90% with change in rpm. External gear pumps are positive displacement types of pump, in this kind of pump amount of mass discharge at full load condition same. So achieved maximum efficiency at max rpm. As shown in previous result rpm of motor increasing with supply higher voltage and current to the motor. However, at certain period when increasing supply it is increasing rpm of motor and the discharge is also increase.
Pump rotate at high speed eventually it is increasing power output. The rotation of gear set 167.589 red/s, it has developed 27361.6 Pascal, which is near to achievable pressure for punching machine cooling. From the line graph it is clearly observed that the pressure from the very first reading 12410.5Pascal measure with experimentally from the CFD simulation. It is measure 11363.2 pa which is within 8% error. Same for last reading at 1450 rpm the pressure generation is 24131.65 Pascal and through CFD simulation it has got 23058.91 it is within 5% error. From this condition pump operate at 90% efficiency.
VII.CONCLUSION
From Experimentation get the effect of flow discharge rate and discharge pressure at various rpm deliver to the gear rotor for a selected pump. This deliver pressure simulate with CFD in FLUENT. From the simulation the result is generating within 5% error. This is desire for any CFD simulation. From this data same pump geometry check for higher rpm. From the simulation it is conclude that the pump satisfy requirement. The purpose of this project to check existing pump for satisfy working at 4 psi
12 50 13 00 13 50 14 00 14 50 14 76 14 80 VOLUMETRIC
EFFICIENCY 80 82 85 87 89 90 90
74 76 78 80 82 84 86 88 90 92
V
olum
etric
Ef
fic
ienc
y
rpm
Pump Speed vs Volumetric Efficiency
12 50 13 00 13 50 14 00 14 50 14 76 14 80
Qact 0 0 0 0 0 0 0
0 0.0005 0.001 0.0015 0.002 0.0025
Qa
ct
rpm
Pump Speed vs Discharge Flow rate
125 0 135 0 145 0 148 0 160 0 P2(act)
N/m2 12411 20684 24132 24132
P2(cfd)
N/m2 11363 19549 23057 23059 27362
0 5000 10000 15000 20000 25000 30000
Disch
ar
ge
pr
essure
(N
/m
2)
IJEDR1402188
International Journal of Engineering Development and Research (www.ijedr.org)2478
delivery pressure. This pressure supply going to punching machine for cooling purpose. In order to develop the most efficient pump possible with the least cost (time and money), several pumps were simulated on the computer using the computational fluid dynamics (CFD) code FLUENT. By using the computer , various designs can be evaluated using numerical experiments, without the need to machine and assemble a physical pump.REFERENCES
[1] Goulet, Mark G. Fundamentals of Selection and Design: Oil Pumps for Internal Combustion Engines and Gearbo xes.
[2] Fabiani, M., Mancò, S., Nervegna, N., Rundo, M., Armenio, G., Pachetti, C., Trichilo, R., “Modeling and Simulation of Gerotor Gearing in Lubricating Oil Pumps, ” SAE T ransactions, v ol. 1 08, pp. 989-1 003, 1 999.
[3] Mancò, S, Nervegna, N., Rundo, N., Armenio, G., Pachetti, C., Trichilo, R., “Gerotor Lubricating Oil Pump for IC Engines,” S AE Paper 982689, 1 998.
[4] Kluger , Michael A., Fussner , Douglas R., Roethler , B., “ A Perf ormance Comparison of V arious Automatic Transmission Pumping Systems,” SAE Paper 960424, 1 996.
[5] Jiang, Y., Perng, C.,“Efficient 3D Transient Computational Model f or V ane Oil Pump and Gerotor Oil Pump Simulators,” S AE Paper 97084 1, 1 997 .
![Figure 1 Gear rotor Pump Operation[1] process which is caused by the sliding elements, i.e rotation of gears inside the pump](https://thumb-us.123doks.com/thumbv2/123dok_us/8501778.1392357/1.595.171.430.515.679/figure-operation-process-caused-sliding-elements-rotation-inside.webp)