Recent forward physics and diffraction results from CMS
Gábor Veres on behalf of the CMS Collaboration1,a
1CERN, Geneva, Switzerland
Abstract. Recent CMS results on forward physics and diffraction are reviewed. The differential diffractive cross section is measured as a function ofξ=M2
X/sin the region dominated by single dissociation (SD) and double dissociation (DD), where MX is the mass of one of the two final-state hadronic systems separated by the largest rapidity gap in the event. The total SD and DD cross sections are extracted. The observation of a hard color-singlet exchange process in events with a large rapidity gap between two leading jets (jet-gap-jet) is reported. The fraction of jet-gap-jet to all dijet events is measured as a function of the second leading jet transverse momentum and the size of the pseudorapidity gap. The measured fractions are compared with predictions as well as Tevatron data.
1 Introduction
Diffractive interactions account for about a quarter of the total inelastic proton-proton cross section at high energies. These interactions are characterized by at least one large rapidity gap (LRG) that is not suppressed exponentially. Depending on the topology of the event, one can differentiate between single and double dissociation (SD and DD), and central diffraction (CD). An LRG is presumed to be mediated by a color-singlet exchange (CSE). Measurements of diffractive processes at the LHC provide valuable input to phenomenological models, as these cross sections cannot be calculated within perturbative QCD, and extrapolations in √sfrom lower energies vary depending on model parameters.
Another interesting and related area of research is the study of events with a LRG between two jets at high transverse momentumpT. Normally dijet production is the consequence of an exchange of a colored object, and the color field associated with the exchanged parton calls for additional soft parton emissions, populating theηinterval between the jets. For dijet events with central LRG, the BFKL approach is expected to describe the data [1]. The LRG is a signature of CSE, this time involving a hard scale, with a much higher momentum transfer compared to soft diffractive events. Thus, studies of CSE events as a function of the rapidity gap width helps disentangle the BFKL dynamics from the DGLAP evolution. The results are also sensitive to rescattering processes, as those can destroy the LRG.
The detailed description of the CMS detector can be found in [2]. For measurements of diffraction, the extensive forward instrumentation is relevant: the forward component of the hadron calorimeter, HF (2.9<|η|<5.2), the CASTOR calorimeter [3] (−6.6 < η <−5.2), the Zero Degree Calorimeter (ZDC) and the Forward Shower Counters (FSC). The TOTEM experiment, including Roman Pots and
cal X
ξ
10
log
-6 -5 -4 -3 -2
Events / 0.5 units
2000 4000 6000 8000
10000 (a1)
(7 TeV) -1 b
μ
16.2
CMS
cal X
ξ
10
log
-6 -5 -4 -3 -2
Events / 0.5 units
2000 4000 6000 8000
10000 (b1)
(7 TeV) -1 b
μ
16.2
CMS
cal X
ξ
10
log
-6 -5 -4 -3 -2
Events / 0.5 units
2000 4000 6000 8000
10000 Data
PYTHIA8-MBR: SD1 SD2 DD CD ND Pileup
(c1)
(7 TeV) -1 b
μ
16.2
CMS
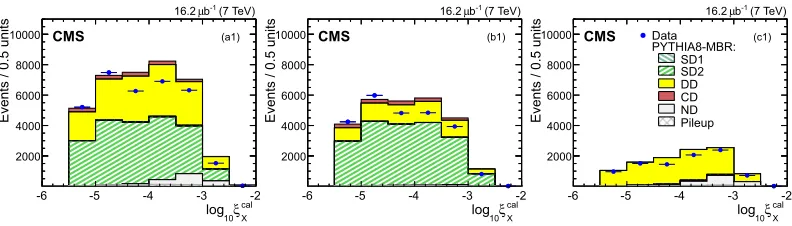
Figure 1.Detector-level distributions of the reconstructed and calibratedξXfor (left) the entire FG2 sample, and the FG2 subsamples with (middle) no CASTOR tag, and (right) a CASTOR tag (statistical errors only). The data are compared to the predictions of the PYTHIA 8 MBR simulations, which are normalized to the integrated luminosity of the data sample. The contribution of each of the generated processes is shown separately.
tracker detectors very close to the beamline and sharing collision point with CMS, presents a unique future opportunity to extend the studies discussed here.
2 Diffractive dissociation cross sections
In the experimental analysis presented here, the SD and DD events are separated using the CASTOR calorimeter [3], covering the−6.6< η <−5.2 region. A special data set of 16.2μb−1at √s=7 TeV was used, where the probability of more than oneppcollisions occurring coincidentally was only 7%, collected in 2010. Monte Carlo (MC) simulations are used to correct the measured distributions for the geometrical acceptance and efficiency of the detector [4].
The pp collisions are selected with a very inclusive minimum bias trigger. No reconstructed collision vertex or charged particle tracks are required, but at least two reconstructed particle-flow (PF) objects above 4 GeV total energy in the forward region. The acceptance of this selection is 90% for events where any of the diffractiveMX andMYmasses exceed 12.6 GeV.
Various event topologies are defined: FG1 (FG2) events contain anη-gap on the positive (negative)
η-side. In case of FG1 (FG2) topologies, theη-gap extends toηmax andηminwhich are the highest (lowest)ηof the PF objects in the central detector. In order to select samples of FG1 and FG2 events with the forward LRG signature in the detector, the requirementsηmax<1 andηmin>−1 are imposed, respectively. The detection of the low-mass dissociated system, Y, and thereby the separation of DD and SD events, is performed by using a CASTOR tag, defined as the presence of a signal above the energy threshold (1.48 GeV) in the CASTOR calorimeter.
The forward rapidity gap cross section is expressed as a function of ξX = M2X/s. Since ξX is not directly measurable, it is approximated experimentally byξ±= Σ(Ei∓pi
z)/
√
s, whereEiandpi z refer to PF objects, where the dissociated system is on the positive (negative) side. Good correlation betweenξX andξ+X was found using single diffractive events simulated by the PYTHIA 8 Minimum Bias Rockefeller (MBR) tune. Based on this correlation, the measuredξ+values can be calibrated (translated intoξX). Figure 1 shows the distribution of this calibrated log10ξcal
X for the FG2 sample, compared to model predictions, including the SD, DD and ND components separately. The separation of SD and DD processes by the CASTOR tag is clearly seen in these figures.
mea-X ξ 10 log -6 -5.5 -5 -4.5 -4 -3.5 -3 -2.5 -2
(mb)
X
ξ
10
/dlog
σ
d
0 0.2 0.4 0.6 0.8 1 1.2 1.4 1.6 1.8 2
< 0.5
Y
M
10
log
(7 TeV)
-1
b μ 16.2
CMS (a)
X ξ 10 log -6 -5.5 -5 -4.5 -4 -3.5 -3 -2.5 -2
(mb)
X
ξ
10
/dlog
σ
d
0 0.2 0.4 0.6 0.8 1 1.2 1.4 1.6 1.8 2
Data
PYTHIA version: =0.08)
ε
P8-MBR ( =0.104)
ε
P8-MBR ( P8-4C P6-Z2*
< 1.1
Y
M
10
0.5 < log
(7 TeV)
-1
b μ 16.2
CMS (c)
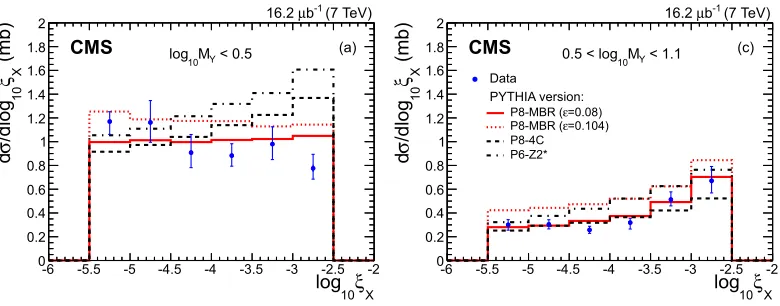
Figure 2. Cross sectionsdσ/dlog10ξX for log10MY < 0.5 (dominated by single diffraction, left panel) and 0.5<log10MY <1.1 (dominated by double diffraction, right panel) compared to MC predictions: (top) PYTHIA 8 MBR, PYTHIA 8 4C, PYTHIA Z2∗, and (bottom) PHOJET, QGSJET-II 03, QGSJET-II 04, EPOS. Error bars are dominated by systematic uncertainties.
sured inξXbins, separately for events with no particles depositing energy in the CASTOR calorimeter (this selection corresponds approximately to log10MY <0.5 and the cross section is corrected to this generator level interval) and for events with CASTOR tag (0.5<log10MY <1.1). The cross sections are corrected for the small fraction of simultaneous ppcollisions in the data, as well as for accep-tance and migration effects, evaluated with the iterative Bayesian method, using the response matrix obtained from the PYTHIA 8 MBR model (with=0.08).
Figure 2 presents the measured cross sections, compared to the PYTHIA 8 MBR, PYTHIA 8 4C, and PYTHIA 6 Z2∗predictions. The error bars are dominated by systematic uncertainties. The predictions of PYTHIA 8 MBR are shown for the values of the parameterof the Pomeron trajectory
=0.08 as well as =0.104. The data with CASTOR tag, 0.5 <log10MY <1.1, favor =0.08, especially when both of theMYandMX masses are low. The PYTHIA 6 Z2∗tune, using the Schuler-Sjöstrand model, overestimates the data; the predicted rising behavior of the cross section as a function ofξXis not confirmed by this measurement.
The cross sections have been integrated over the measured kinematic range−5.5 < log10ξX <
−2.5 for events with and without a CASTOR tag, corresponding to 0.5 < log10MY < 1.1 and log10MY < 0.5, respectively. The result of the integration is σno−CASTOR = 2.99 ± 0.02(stat)+0.32
−0.29(syst) mb andσCASTOR=1.18±0.02(stat)±0.13(syst) mb.
Theσno−CASTOR cross section is dominated by SD events, with background mainly originating
from DD processes. The latter is well understood via the CASTOR-tagged events. The PYTHIA 8 MBR simulation was used to correct for the small non-diffractive (ND) fraction and other diffractive processes to obtain the visible SD cross section (−5.5 < log10ξX < −2.5), which is found to be 4.06±0.04(stat)+0.69
−0.63(syst) mb. The main contributors toσCASTOR are DD events, with a dominant background from ND events. The corrected visible DD cross section in the CASTOR-tagged sample (−5.5<log10ξX <−2.5 and 0.5<log10MY <1.1) is 1.06±0.02(stat)±0.12(syst) mb.
(GeV) s
10 102 103 104
(mb)
SD
σ
0 5 10 15 20 25
CMS (extrapolated with PYTHIA8-MBR) ALICE
CDF E710 UA4 CHLM (ISR) Armitage et al. (ISR)
=0.104) ε PYTHIA8-MBR (
=0.08) ε PYTHIA8-MBR ( GLM KP
< 0.05
ξ
(7 TeV) -1 b
μ
16.2μb-1 (7 TeV) 16.2
CMS (a)
(GeV) s
10 102 103 104
(mb)
DD
σ
0 5 10 15 20 25
CMS (extrapolated with PYTHIA8-MBR) ALICE NSD (DD+ND)
CDF PYTHIA8-MBR (ε=0.104)
=0.08) ε PYTHIA8-MBR ( GLM KP > 3
η Δ
(7 TeV) -1 b
μ
16.2
CMS (b)
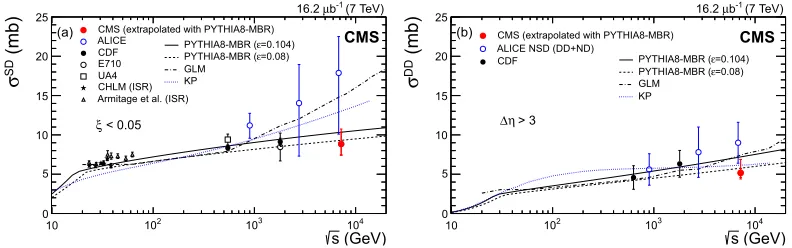
Figure 3.Diffractive cross sections as a function of collision energy measured inppandppcollisions compared to PYTHIA 8 MBR ( =0.08, 0.104) and other model predictions [5–7]. Left: total single-diffractive cross section forξ < 0.05. Right: total double-diffractive cross section forΔη >3. The inner (outer) error bars of the CMS data points correspond to the statistical and systematic (and the additional extrapolation) uncertainties added in quadrature.
approximately 2 was obtained for this extrapolation. The final extrapolated SD and DD cross sections were found to beσS D = 8.84±0.08(stat)−+11..4938(syst)−+10..1737(extrap) mb (ξ < 0.05) and σDD =5.17± 0.08(stat)+0.55
−0.57(syst)+ 1.62
−0.51(extrap) mb (Δη >3), respectively. Figure 3 presents these extrapolated cross sections compared to the ALICE results and a collection of measurements at lower √s, as well as predictions by various models.
3 Dijet events with a rapidity gap
The fraction of jet-gap-jet events in ppcollisions was measured to be around 1% at the Tevatron. Here we present the first observation of such events at the LHC, along with the CSE fraction at
√
s=7 TeV, using two jets with pT >40 GeV and 1.5<|η|<4.5. The CSE signal is extracted from the charged particle multiplicity distribution in the central region|η|<1 between the jets, using tracks withpT >0.2 GeV. For this analysis it is essential that the probability of overlappingppcollisions is low. The amount of data used correspond to 8pb−1integrated luminosity collected in 2010 [8].
Jets are clustered with the anti-kT algorithm, with a radius parameter R=0.5. The jet energy corrections are derived from simulation and confirmed with measurements of dijet andγ+jet energy balance. Jet-gap-jet events are simulated with the HERWIG 6 generator, which takes into account the reactions involving hard CSE via elastic parton-parton scattering according to the Mueller-Tang model, which is based on BFKL evolution [9]. Multi-parton interactions (MPI) in the underlying event is provided by the JIMMY package [10].
The data are divided into three bins of the pT of the lower-energy jet in the dijet system; pjet2T : 40–60 GeV, 60–100 GeV and 100–200 GeV. At most one primary collision vertex is allowed in each event, and the jets have to satisfy the conditions|ηjet1|>1.5,|ηjet2|>1.5 andηjet1·ηjet2 <0, in order to ensure the necessary separation between the jets and the region (gap) where the charged particle multiplicity is measured.
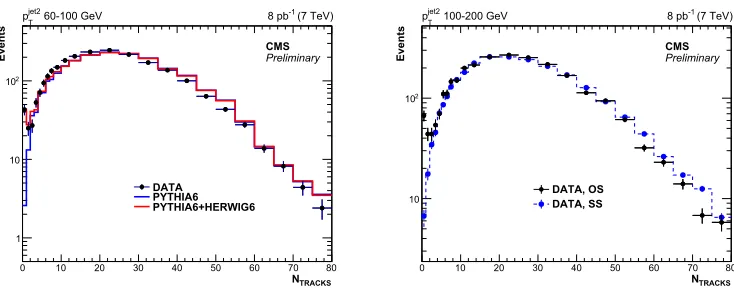
The left panel of Figure 4 shows the measured track multiplicity distribution for the 60< pTjet2 <
TRACKS N
0 10 20 30 40 50 60 70 80
Events
1 10
2
10
Preliminary
CMS
(7 TeV) -1 8 pb 60-100 GeV
jet2 T p
DATA PYTHIA6 PYTHIA6+HERWIG6
TRACKS N
0 10 20 30 40 50 60 70 80
Events
10
2
10
Preliminary
CMS
(7 TeV) -1 8 pb 100-200 GeV
jet2 T p
DATA, OS DATA, SS
Figure 4. Left: Charged particle multiplicity distributions for pTjet2 between 60 and 100 GeV, compared to predictions of PYTHIA 6 and HERWIG 6. The normalization of the MC distribution is obtained from a fit to the data. Right: Charged particle multiplicity distribution in the highestpTjet2sample (100–200 GeV), shown together with the charged multiplicity distribution from the same-sign sample.
distributions of jets in the zero-track bin agree well with MC predictions. It was also found that the CSE dijets are more balanced, both in azimuthal angle and transverse momentum, compared to non-CSE dijets.
In order to quantify the contribution of CSE events in inclusive the dijet sample and measure the CSE fraction, fCS E, one has to subtract the background events first, estimated to have a non-CSE origin. The fCS Efraction is not sensitive to trigger inefficiencies and jet reconstruction uncertainties, as they cancel in the ratio.
Two methods are used to estimate the number of background events. First, the shape of the charged particle multiplicity distribution is obtained from a sample with the two leading jets being on the same side of the CMS detector (SS sample,|ηjet1| > 1.5,|ηjet2| > 1.5 andηjet1·ηjet2 > 0). The region in which the multiplicity was measured was widened to be|η|<1.2 (for details, see [8]) and normalized to the nominal opposite-sign (OS) sample. The number of events in the first multiplicity bins is taken as the estimate of the background. An example of the SS and OS multiplicity distributions is shown in the right panel of Fig. 4 for the 100<pTjet2<200 GeV bin. The second method involves a negative binomial fit to the charged particle multiplicity distribution restricted to the multiplicity region 3–35. The number of background events with these two methods agree within statistical uncertainties. The non-CSE background amounts to about half of the events in the first three bins of the multiplicity distribution.
(GeV) T jet2 p
0 20 40 60 80 100 120 140 160 180
CSE fraction (%)
0 0.5 1 1.5 2 2.5
| < 1 gap
η
| < 0 jet2
η
* jet1
η
CMS
| < 5.0, anti kT (R=0.5)
jet1,2
η 1.5 < |
=1.8 TeV) s D0 (
| < 4.1, Cone (R=0.7)
jet1,2
η 1.9 < |
=1.8 TeV) s CDF (
| < 3.5, Cone (R=0.7)
jet1,2
η 1.8 < | Preliminary
CMS
(7 TeV)
-1
8 pb
jet1,jet2 η Δ
3 3.5 4 4.5 5 5.5 6 6.5 7
CSE fraction (%)
0 0.5 1 1.5 2 2.5
Data MT model
Preliminary
CMS
(7 TeV)
-1
8 pb
40-60 GeV
jet2 T
p
Figure 5. Left: The fraction fCS Eas a function of pjet
2
T as measured by CMS for 40 < p jet2
T <60 GeV, 60 <
pTjet2 <100 GeV, and 100< pTjet2 <200 GeV at √s=7 TeV, and by D0 [11] and CDF [12] at √s=1.8 TeV.
The details of the jet selections are given in the legend. The results are plotted at the mean value ofpTjet2 in the bin. Right: The fractionfCS Eas a function ofΔηj jmeasured in the three bins ofpjet
2
T : 40-60 GeV, 60-100 GeV, and 100-200 GeV. The results are plotted at the center of theΔηj jbin. Inner and outer error bars correspond to the statistical, and the statistical and systematic uncertainties added in quadrature, respectively.
In Summary, we have presented various measurements concerning color-singlet exchange pro-cesses, in particular, inclusive single- and double-diffraction cross sections (those visible by our ap-paratus as well as extrapolations to a larger phase space), and dijet events with a large rapidity gap between them, that need to invoke CSE to explained their presence in the data. Comparisons to ear-lier measurements and phenomenological models contribute to the further scrutiny of these important processes in hadron-hadron interactions.
References
[1] J.D. Bjorken, Phys. Rev.D47, 101 (1993)
[2] S. Chatrchyan et al. (CMS), JINST3, S08004 (2008) [3] V. Andreev et al., Eur. Phys. J.C67, 601 (2010)
[4] V. Khachatryan et al. (CMS), Phys. Rev.D92, 012003 (2015),arXiv:1503.08689 [5] E. Gotsman, E. Levin, U. Maor, Phys. Lett.B716, 425 (2012),arXiv:1208.0898 [6] A.B. Kaidalov, M.G. Poghosyan, Eur. Phys. J.C67, 397 (2010),arXiv:0910.2050 [7] A.B. Kaidalov, M.G. Poghosyan (2011),arXiv:1109.3697
[8] V. Khachatryan et al. (CMS) (2015),CMS-PAS-FSQ-12-001 [9] A.H. Mueller, W.K. Tang, Phys. Lett.B284, 123 (1992)
[10] J.M. Butterworth, J.R. Forshaw, M.H. Seymour, Z. Phys.C72, 637 (1996),hep-ph/9601371 [11] B. Abbott et al. (D0), Phys. Lett.B440, 189 (1998),hep-ex/9809016
![Figure 5. Left: The fractionand 100-200 GeV. The results are plotted at the center of the fCS E as a function of p jet2Tas measured by CMS for 40 < p jet2T< 60 GeV, 60 <pjet2T< 100 GeV, and 100 < pjet2T< 200 GeV at √s = 7 TeV, and by D0 [11] and CDF [12] a](https://thumb-us.123doks.com/thumbv2/123dok_us/8158598.1361036/6.482.45.423.85.248/figure-left-fractionand-results-plotted-center-function-measured.webp)
