c
Owned by the authors, published by EDP Sciences, 2015
Rate dependence of electrical and mechanical properties of conductive
polymer nanocomposites
J.R. Foley1, C.L. Stilson1, K.K.G. Smith1,2, C.M. McKinion1,3, C. Chen4, S. Ganguli4, and A.K. Roy4 1Air Force Research Laboratory, Eglin AFB, FL, USA
2National Research Council Postdoctoral Research Associate, Eglin AFB, FL, USA 3Doolittle Institute, Fort Walton Beach, FL, USA
4Air Force Research Laboratory, Wright-Patterson AFB, OH, USA
Abstract. Conductive polymer nanocomposites with enhanced electrical and thermal properties show promise as an alternative solution for electronic materials. For example, electronic interconnect materials will have comparable electrical and thermal conductivity to solder with an increased operating range of strain and temperature. This paper documents the fabrication and experimental evaluation of a prototype conductive polymer nanocomposite. Material selection, fabrication processes, and initial characterization of a low Tg polymer with a high fill ratio of carbon nanotubes is presented. The electrical and thermal properties of the composite are measured and compared with predictions. The mechanical properties are measured using dynamic mechanical analysis (DMA) over a wide temperature range. The mechanical and electrical responses of the conductive polymer composite are simultaneously measured at higher strain rates using a modified split Hopkinson pressure bar (SHPB) apparatus. The dynamic stress-strain response is obtained using traditional analytic methods (e.g., two- and three-wave analysis). The electrical response is observed using constant current excitation with high bandwidth (>500 kHz) instrumentation. The dynamic compression data implies the change in electrical resistance is solely a function of the material deformation, i.e., the material exhibits constant electrical conductivity and is insensitive to the applied loads. DMA and SHPB dynamic data are used to estimate the parameters in a Mulliken-Boyce constitutive model, and the resulting behavior is critically evaluated. Finally, progress towards improving the polymer composite’s mechanical, electrical, and thermal properties are discussed.
1. Introduction
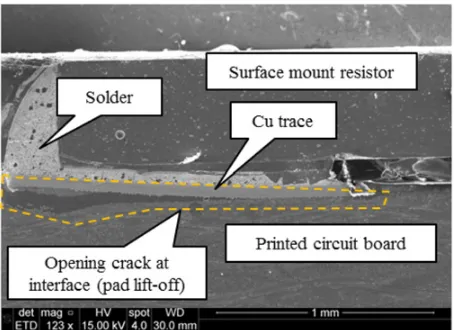
The global electronics industry is dominated by com-ponents designed for commercial electronics [1]. Ac-cordingly, the design architecture, fabrication process, materials, component design, and testing [2] all reflect the mass-production, commercial-off-the-shelf (COTS) nature of consumer electronics. However, these same processes, materials, etc., are often used in electronics subjected to much harsher operating environments. The corresponding failure modes are diverse and depend on the geometry, materials, and physics of operation of the devices [3]. For example, Fig.1shows an SEM image of the cross-section of a surface mount resistor subjected to severe mechanical shock environments [4,5]. The mechanical loading initiated a crack that has propagated along the interface between the fiber-reinforced polymer printed circuit board and the copper trace material. The particular damage mechanism, known as pad lift-off [6] or pad cratering, occurs at the interconnect between the assembly and the component. Other electronics failure modes at device interconnects include solder joint fracture, component termination failures, or component stress cracking.
Developing alternatives for the packaging and assembly of traditional electronics requires understanding of the multifunctional response of candidate materials. This paper documents the fabrication and initial char-acterization of the combined thermal, electrical, and
Figure 1. SEM image of a surface-mount electronic component
cross-section after high shock loading. The dashed line indicates the onset of pad lift-off at the printed circuit board-copper trace interface.
rate-dependent mechanical response of a new electrically-conductive polymer composite.
2. Material development
A conductive polymer nanocomposite (CPnC) was proposed as an alternative material for electronic
Table 1. Design objectives for the conductive polymer
nanocomposite in comparison to Sn-37Pb and SAC305 solders.
Design Metric
Sym. Sn-37Pb
SAC-305
CPnC Goal
Units
Electrical resistivity
ρ 0.146 0.132 ≤0.5 µ·m
Thermal conductivity
κ 50.9 58 ≥58 W/m·K
Tensile Elongation
L/L0 ∼50 35 >100 %
Glass Trans. Temp.
Tg N/A∗ N/A∗ <273 K
Viscosity η N/A∗ N/A∗ <1e6 poise
∗Note: glass transition temperature and viscosity are not
meaningful for solder alloys except during the reflow process and are therefore not applicable.
interconnects. This section reviews the design objectives, composition and fabrication process of the initial composite, and characterization of the material.
2.1. Material performance objectives
The primary performance objective for the CPnC is to reproduce the thermal and electrical properties of solder while exhibiting strain-tolerance over a wide range of operating conditions. A eutectic lead-based solder alloy, Sn-37Pb (63% Sn, 37% Pb), and a lead-free solder alloy, SAC305 (96.5% Sn, 3% Ag, 0.5% Cu), were chosen as references [7]. The strain tolerance was given indicated by the strain to failure (i.e., ultimate strain). Viscosity, particularly shear-thinning behavior, was sought to aid in mixing, processing, and ultimately enable manufacturing concepts. Finally, the electrical properties should be insensitive to strain (i.e., not change resistivity as a function of deformation). Table 1 below lists the design objectives for the study.
2.2. Fabrication process
A low Tg polymer matrix was chosen instead such that the material would remain compliant during dynamic events and extend the ultimate strain. The polymer, Epon 828 with Jeffamine D2000 hardener, has relatively poor electrical and thermal performance (i.e., conductivity) in the cured state. In order to improve the electrical and thermal conductivity in a manner similar to commercially available conductive epoxies (e.g., the Ag-epoxy examined in [8]), conductive nanoparticles were considered as the filler. Candidate fillers included Ag nanoparticles and multiwalled carbon nanotubes (MWCNT).
Initial compositions investigated included two heavily filled CPnC’s. The first consisted of 20% (by weight) Ag nanoparticles, 10% MWCNT and the Epon 828/D2000 matrix. The second was 20% MWCNT with the Epon 828/D2000 matrix. The processing procedure involves three mixing cycles of 2000 rpm for 3 minutes each in a Thinky planetary centrifugal mixer. After each mix cycle, the composite material is degassed under vacuum (20 kPa) while continuing mixing for 2 minutes. After three mixing cycles, the mixture is cast in either silicone or Teflon
Figure 2. Thermal conductivity at three different temperatures.
molds, placed in vacuum bags, and subsequently cured in an autoclave. The curing temperature profile involves (1) a ramp from room temperature to 120◦C at a rate of 1◦C/min., (2) hold at 120◦C for 3 hours, then (3) a cool down to room temperature; pressure is maintained at 690 kPa and a vacuum of −100 kPa (gauge pressure) is applied to the parts during curing. The vacuum and pressure are released after the parts cooled and the samples then separated from the molds.
2.3. Characterization
After fabrication of the samples, basic thermal, electrical, and mechanical charaterization of the candidate CPnC’s was performed. Electrical resistivity was estimated using the van der Pauw technique. The 20% MWCNT/Epon 828/D-2000 prototype material was measured to have an electrical resistivity of 0.5µ·m, reaching the design goal. The 20% Ag/10% MWCNT/Epon 828/D2000 was observed to have a much higher resistivity,
The thermal conductivity was measured using laser flash analysis. The 20% MWCNT/Epon 828/D2000 and the 20% Ag/10% MWCNT/Epon 828/D2000 were measured at 25◦C, 50◦C, and 100◦C. The results are shown in Fig. 2 below. While both conductivities were significantly below the design goal, the 20% MWCNT material showed higher average thermal conductivity (0.37 W/m·K) than the 20% Ag/10% MWCNT composite (0.25 W/m· K).
Figure 3. SEM image of the 20% Ag/10% MWCNT CPnC
showing carbon nanotubes and the flakes of silver nanoparticles (matrix has been removed).
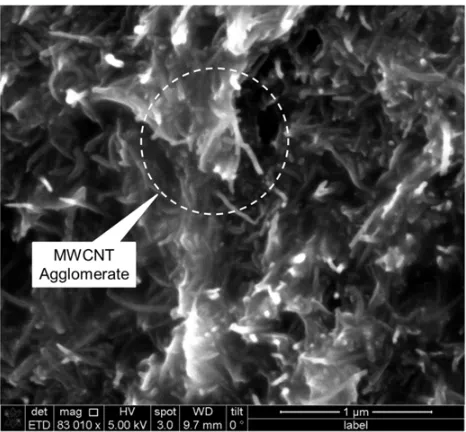
Figure 4. SEM image of the 20% MWCNT CPnC showing
multiwalled carbon nanotubes with significant agglomeration (matrix material has been removed).
of nanoparticle. The MWCNT-only CPnC, shown in Fig.4, exhibits slightly enhanced transport relative to the silver-loaded CPnC, presumably through conduction within the agglomerated nanotubes.
The overall better performance of the 20% MWCNT composite–with a lower electrical resistivity and higher thermal conductivity–led to its selection as the best candidate for more detailed analysis. Due to the importance of processability for electronics materials, the viscosity of the CPnC was measured as a function of curing temperature profile, shown in Fig. 5. The melt-thinning
Figure 5. Viscosity and temperature vs. time for the 20%
MWCNT CPnC.
Figure 6. Shear-thinning behavior of the 20% MWCNT CPnC.
of the matrix contributes to the reduced viscosity through the temperature, reaching a minimum of approximately 1.3e6 poise at the cure temperature. The shear-thinning behavior of the composite is shown in Fig. 6; the 20% MWCNT material exhibits significant shear-thinning, which is desirable for many processing techniques.
2.4. Dynamic mechanical analysis
Dynamic mechanical analysis (DMA) [10] was then performed on both candidate CPnC’s. DMA samples of 17.9 mm long, 11 mm wide, and 3.1 mm thick were cast for each of the candidate materials and the matrix material. The samples were tested in a single cantilever configuration in a TA Instruments Q800 [11,12]. The excitation frequency was set at 1 Hz and the samples were ramped through the temperature range of−120◦C to
+120◦C at a rate of 3◦C/minute. The displacement was held constant at 20µm for this analysis.
Typical DMA data for the CPnC’s is shown in Fig.7 at the measured frequency of 1 Hz. The low Tg is readily apparent, and the room temperature (298 K) modulus of both candidates are approximately 70 MPa. The frequency can be converted to an equivalent strain rate (˙ε) using the equivalence relationship [13],
˙
ε=4ωd0/lg, (1)
where ω is the angular frequency (in rad/s), d0 is the
150 200 250 300 350 400 0
500 1000 1500 2000 2500 3000 3500 4000 4500 5000
Temperature [K]
Mo
d
u
lu
s
[
M
P
a
]
20Ag,10MWCNT,828/D2000 - Storage 20Ag,10MWCNT,828/D2000 - Loss ×10 20MWCNT,828/D2000 - Storage 20MWCNT,828/D2000 - Loss ×10
Figure 7. DMA storage and loss modulus data for two candidate
CPnC’s.
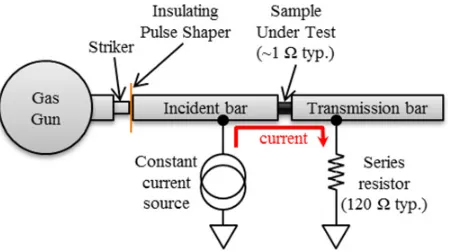
Figure 8. Schematic diagram of modified SHPB apparatus used
to simultaneously monitor mechanical and electrical response of the sample under test.
length. For this sample geometry, the equivalent strain rate is ˙ε≈0.03 s−1.
3. Dynamic compression experiments
3.1. Apparatus
A split Hopkinson pressure bar (SHPB) apparatus [14] was modified to allow simultaneous measurement of the electrical resistance of the sample by using the incident and transmission bars as electrodes. A schematic is shown in Fig. 8. 6 foot (1.81 m) long aluminum alloy (6061) bars with 1 in. (25.4 mm) diameter were used for both the incident and transmission bar.
The technique to simultaneously measure the electrical and mechanical response of the material is most similar to previous work by Heeder et al. [15]. The primary distinction is the much higher mass loading of the 20% MWCNT CPnC investigated in this work. Other recent studies have attempted similar measurements but on much higher equivalent resistance composites [16,17].
A Precision Filters 28144 constant current signal conditioner [18] is used to provide the excitation current. Electrical connection to the incident and transmission bars is made using hose clamps compressing a copper mesh (to which the wires are soldered) as shown in Figure. Due to the low resistivity of the nanocomposite (the sample
Figure 9. Photographic detail of SHPB experiment showing
sample and contact configuration.
resistance is typically less than 1), a series resistor is necessary to raise the total resistance to the expected range of a strain gage (in this case, approximately 120). Uncured conductive epoxy is used in lieu of conductive grease as a multifunctional surface finish: it reduces friction at the sample-bar interfaces and also reduces the contact resistance.
Dynamic strain is measured on the incident and transmission bars using Kyowa semiconductor strain gages [19]; the same Precision Filters system used to measure the sample resistance provides the strain gage conditioning. Both sensor and sample resistance signals are digitized by a National Instruments data acquisition system with PXI-6133 cards [20].
3.2. Sample material, preparation, and geometry
The 20% MWCNT nanocomposite samples were prepared as noted in Sect. 2.2 and cast into 0.625 in. (16 mm) diameter rods. SHPB sample disks with variable lengths between 0.125 in. (3 mm) and 0.188 in. (4.8 mm) were cut from these rod.
3.3. Results and discussion
As expected with a low Tg matrix, the 20% MWCNT CPnC exhibited a compliant, rubbery response as shown in the stress-strain curve shown in Fig.10with a measured strain rate of 522 s−1. The material exhibited excellent recovery, exhibiting no measurable change in thickness after dynamic compression and no discernible damage.
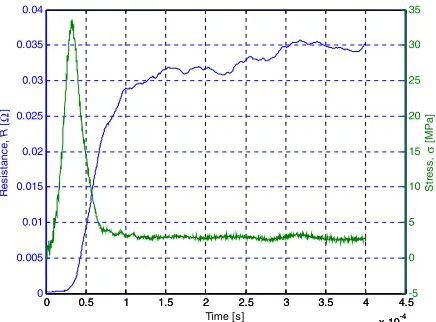
The electrical response of the material in various tests is shown as a function of time is shown in Fig. 11 and Fig. 12. The bulk resistivity of the sample was initially hypothesized to follow the compressive stress (or pressure) due to the MWCNT networks acquiring more contact points, decreasing the overall composite material’s resistance. However, as Fig. 11 shows, there was no direct correlation to support this hypothesis. The opposite scenario, where the bulk resistivity (ρ0) is constant, would yield a scenario where the change in resistance (R)
follows from the geometric distortion of the sample,
R=ρ0(L/A), (2)
0 0.5 1 1.5 2 2.5 0 10 20 30 40 50 60 70 80 90
True Strain [ ]
T ru e Str e s s [M Pa ]
Figure 10. Typical stress-strain diagram for the 20% MWCNT
CPnC.
0 0.5 1 1.5 2 2.5 3 3.5 4 4.5 x 10⁻⁴
0 0.005 0.01 0.015 0.02 0.025 0.03 0.035 0.04 Time [s] R e si sta n ce , R [Ω ]
0 0.5 1 1.5 2 2.5 3 3.5 4 4.5 x 10⁻⁴
-5 0 5 10 15 20 25 30 35 St re s s , σ [ M Pa ]
Figure 11. Change in resistance and stress vs. time for the
nanocomposite.
proportionality is evident in Fig. 12, supporting this conclusion.
3.4. Constitutive analysis
The Ogden model [21] was initially considered due to the rubbery nature of the nanocomposite, however the calcualted compression of the CPnC with minimal radial distortion suggested this was inappropriate.
The Mulliken-Boyce (M-B) constitutive model was then chosen for analyzing the data based on previous work [22,23]. The M-B model [24,25] is a two phase (α and β) viscoelastic-viscoplastic model for glassy polymers that incorporates both polymer network stress and the chain stresses. The model has been shown to accurately reproduce rate-dependent behavior of polymers. DMA data [26] is used to estimate the activation energies, mean temperatures, and shift factors associated with different phases of a polymeric material associated in the M-B model. However, the CPnC’s considered are well above the glass transition temperature. Nonetheless, the model was implemented with the assumption that the nanotube networks can be modeled by the chain stresses
0 0.5 1 1.5 2 2.5 3 3.5 4 4.5 x 10⁻⁴
0 0.01 0.02 0.03 0.04 C h a n g e i n R e si st a n ce , ∆ R [Ω ] Time [s]
0 0.5 1 1.5 2 2.5 3 3.5 4 4.5 x 10⁻⁴
0 1 2 3 4 5 6 x 10⁻³
C o m p re ssi o n , ∆ L [m] Test 6 Test 7
Figure 12. Resistance change (left axis) and total deformation
(right axis) for two tests. The roughly proportional response implies little change in the bulk resistivity as a function of pressure. (An intermittent electrical contact is evident in the resistance during test 6.)
0 0.2 0.4 0.6 0.8 1 1.2 1.4 1.6 0 20 40 60 80 100 120 140
Strain [ ]
Str e s s [M Pa ] Experimental Data M-B Model (Best Fit)
Figure 13. Overlay of expermental and Mulliken-Boyce model
stress-strain diagrams for a 20% MWCNT CPnC sample.
analagous to the polymer (quantified as a Langevin spring element in the viscoelastic model).
A genetic algorithm was implemented in Matlab [27] to estimate the M-B model parameters. The DMA data was used for the modulus as a function of temperature with theβphase assumed to be negligible. A resulting fit is shown in Fig.13. The rubbery modulus was estimated to be 20 MPa with a stretch factor (N ) of 2.9, indicating significant participation in the network stress term. The estimates for the phase activation energies (∼10−19J) nor attempt frequencies (∼1019s−1) are not expected to be
4. Future work
The development of the CPnC is at a very immature stage. While the initial results are promising, the thermal conductivity and electrical resistivity need to be significantly improved. CNT interface functionalization (metallic approach) is being pursued as a possible means to further improve the properties of the next iteration of the nanocomposite. More thorough examination of the rate-dependent effects, including a wider range of frequencies of DMA data and adding both quasi-static and dynamic tensile and compressive testing at different strain rates, are also underway. Improvements to the modified SHPB are also underway, such as using bars with lower impedance (e.g., hollow Al bars) and utilizing longer duration loading pulses. Detailed examination of the coupling between the mechanical and electrical response of the material is also in progress. Lastly, analysis of the stress-strain data using different constitutive models is planned.
5. Conclusion
The development of a conductive polymer nanocomposites with enhanced electrical and thermal properties was pur-sued as an alternative material for electronic interconnects. The material synthesis method and electrical/thermal characterization of two prototype CPnC’s compositions– 20% Ag/10% MWCNT and 20% MWCNT in Epon 828/D2000 matrix–was presented. Mechanical properties of the resulting rubbery material was measured over a wide temperature range using dynamic mechanical analysis (DMA). The mechanical and electrical responses of the conductive polymer composite were simultaneously measured at higher strain rates using a modified split Hopkinson pressure bar (SHPB) apparatus. The change in electrical resistance of the sample during dynamic deformation is shown to be largely a function of the material deformation. If the bulk resistivity is assumed to be constant, the resulting change in resistance implies the material is largely insensitive to the applied loads. The stress-strain curves were estiamted using a Mulliken-Boyce model with marginal results. Finally, ongoing research towards improving the polymer composite’s mechanical, electrical, and thermal properties was discussed.
The authors wish to thank the U.S. Air Force Office of Scientific Research (Project Officer: Dr. Byung-Lip “Les” Lee) for their support of this project. Opinions, interpretations, conclusions, and recommendations are those of the authors and are not necessarily endorsed by the United States Air Force.
References
[1] W. Custer, IPC Outlook (downloaded from www.ipc.org) (2011)
[2] JEDEC, Board level drop test method of components for handheld electronic products (2003)
[3] R.A. Amy, G.S. Aglietti, and G. Richardson, Shock & Vibration. 16, 45 (2009)
[4] R.D. Lowe, et al., Proceedings of the 85th Shock and Vibration Symposium (2014)
[5] R.D. Lowe, et al., Proceedings of the 85th Shock and Vibration Symposium (2014)
[6] J.W. Dally, P. Lall, and J.C. Suhling, Mechanical Design of Electronic Systems (College House Enterprises Knoxville, TN, 2008)
[7] T. Siewert, et al., Database for Solder Properties with Emphasis on New Lead-free Solders (National Institute of Standards and Technology Colorado, 2002)
[8] X. Luo and D.D.L. Chung, Journal of Materials Science. 34, 273 (1999)
[9] Tra-Con, Tra-Duct 2902 Room Temperature Conduc-tive Silver Epoxy Adhesive (Technical Product Data and MSDS) (2002)
[10] Introduction to Dynamic Mechanical Analysis (DMA): A Beginner’s Guide (PerkinElmer, Inc. Waltham, MA, 2008)
[11] DMA Q800 Specifications (TA Instruments, 2010)
[12] TA Instruments Dynamic Mechanical Analyzer (TA284) (TA Instruments, 2011)
[13] A.D. Mulliken and M.C. Boyce, International Journal of Solids and Structures. 43, 1331 (2006)
[14] G.T. Gray III, in ASM Handbook. Vol 8: Mechanical Testing and Evaluation, edited by H. Kuhn and D. Medlin (ASM International, Materials Park, 2002), pp. 462
[15] N. Heeder, et al., Journal of Materials Science. 47, 3808 (2012)
[16] A.S. Lim, et al., Composites Science and Technology. 71, 616 (2011)
[17] L. Jin-tao, C. Jian-kang, and Z. Ming-hua, Polymers & Polymer Composites. 20, 45 (2012)
[18] Precision 28144 Quad-Channel Wideband Transducer Conditioner with Voltage and Current Excitation (Datasheet) (Precision Filters, Inc. Ithaca, 2009)
[19] Kyowa KSP-2-120-E4 Strain Gage Datasheet (Kyowa Electronic Instruments Co., 2014)
[20] NI PXI-6133 Specifications. (Available from ni.com) edn. (National Instruments Austin, 2003)
[21] O.A. Shergold, N.A. Fleck, and D. Radford, Int. J. Impact Engng. 32, 1384 (2006)
[22] J. Jordan, J. Foley, and C. Siviour, in Mechanics of Time Dependent Materials (Monterey, CA, 2008) [23] J. Jordan, J. Foley, and C. Siviour, Mechanics of
Time-Dependent Materials. 12, 249 (2008)
[24] A.D. Mulliken. Massachusetts Institute of Technol-ogy, 2004
[25] A.D. Mulliken. Massachusetts Institute of Technol-ogy, 2006
[26] J.R. Foley, J.L. Jordan, and C.R. Siviour, Proceedings of DYMAT 2012 (2012)