DOI: http://dx.doi.org/10.26483/ijarcs.v9i2.5881
Volume 9, No. 2, March-April 2018
International Journal of Advanced Research in Computer Science
RESEARCH PAPER
Available Online at www.ijarcs.info
ISSN No. 0976-5697
A NEW HYBRID HARD-FUZZY (K-MFCM) DATA CLUSTERING METHOD FOR
FINDING CLUSTER CENTROID
O.A. Mohamed Jafar
Associate Professor, PG & Research Department of Computer Science Jamal Mohamed College (Autonomous)
Tiruchirappalli, Tamil Nadu, India [email protected]
Abstract: Data mining is a collection of methods used to extract useful information from large data bases. Cluster Analysis refers to the grouping of a set of data points into clusters. Most widely used partitioning methods are K-means and Fuzzy c-means (FCM) algorithms. However, they suffer from the difficulties such as random selection of initial centre values and handling outlier data points. Most of the existing clustering methods use the Euclidean distance metric. The modified fuzzy c-means algorithm (MFCM) is efficient in handling outlier data points. In this paper, a new hybrid algorithm is proposed to solve the limitations of the traditional clustering methods. The hybrid K-MFCM algorithm is tested on four real world bench mark data sets from UCI machine learning repository with various distance metrics including Euclidean, City Block and Chessboard. The cluster centroid values of hybrid algorithm are calculated for various data sets. The experimental results show that the hybrid algorithm gives good results in terms of objective function value and better fuzzy cluster validity results for chessboard distance metric than other distance metrics.
Keywords: Clustering; Partitioning Methods; Modified FCM; Hybrid Algorithm; Cluster Validity
I. INTRODUCTION
Recently, there has been an explosive growth in the generation and storage of electronic information. Data has played a vital role in many organizations. In recent days, the data continues to grow at a phenomenal rate but useful information seems to be decreasing. The large amount of stored data contains valuable hidden information. The organizations are unable to find useful information in the database. The relevant and meaningful information can help the authorities in the organizations to take effective decisions. Extracting information and knowledge from a large database is a challenging task. Hence a process of converting huge volume of data to knowledge will become invaluable. The area of knowledge discovery in databases (KDD) has arisen over the last decade to address this challenge.
The typical process of knowledge discovery is to include the steps: data cleaning, data integration, data selection, data transformation, data reduction, data mining, pattern evaluation and knowledge representation. Data Mining is the process of extracting or mining knowledge from large databases. It involves the use of data analysis techniques to discover previously unknown, useful patterns and relationships in large data sets. Data clustering is a popular unsupervised classification technique which partitions an unlabelled data set into groups of similar objects. Clustering is a method for exploring the structure of data. Objects can be described in terms of relationships with other objects and measurements. Some general applications of clustering include medical analysis, pattern analysis, biometrics, image processing, marketing and information retrieval [1]. The cluster analysis methods are divided into broad categories such as hierarchical methods, partitioning methods, density-based methods, model-density-based methods and grid-density-based methods.
K-means [2] and K-medoids [3] are popular hard clustering algorithms. Fuzzy c-means algorithm, a soft clustering algorithm, is proposed by Dunn [4] and then generalized by Bezdek [5]. However, there are some limitations such as sensitive to random selection of initial centre values, stuck at local optimal value and sensitive to outlier data points. Modified Fuzzy c-means (MFCM) is efficient in handling natural data with uncertainty and outlier data objects. Euclidean distance metric is used in most existing clustering algorithms. The performance of clustering methods can be improved by using hybrid algorithms. In this paper, the combination of K-means and modified fuzzy c-means algorithm (K-MFCM) is proposed using city block and chessboard distance measures. The algorithm is evaluated through bench mark data sets such as Blood Transfusion, Glass, Iris and Vowel.
This paper is organized as follows: Section II describes the review of literature. The methodology is presented in Section III which includes the details of distance metrics and hybrid algorithm. Section IV explains the results and discussion. Finally, Section V concludes the work.
II. REVIEW OF LITERATURE
proposed fuzzy c-means algorithm for motif discovery. The soft-clustering-based machine learning methods such as FCM were useful to find the patterns in biological sequences. Li Xiang Jun et al. [10] proposed a solution of cluster centers and attached matrix into application of Fuzzy C-means clustering algorithm in macro-economic forecast. Zhe Guo and Furong Wang [11] modeled telecommunication user behavior based on the incoming/outgoing call holding time and then use fuzzy c-means algorithm to classify every level in user pyramidal model. Zhiye Sun et al. [12] studied fuzzy c-means algorithm and applied in meteorological data. Oyelade et al. [13] described a system for analyzing students’ academic performance based on cluster analysis. They used the standard statistical algorithms to arrange students’ scores data according the level of their performance. Runhua Wang et al. [14] implemented a K-means clustering algorithm for the application in University Libraries. The clustering results considered as a guide to rationalize the distribution of library resources. Balafar [15] presented a review of the FCM based segmentation algorithms for brain MRI images. FCM based segmentation algorithms and comparative evaluations were given in the review. Singh Yadav et al. [16] proposed a fuzzy c-means clustering technique for student academic performance evaluation. Manjunath Aradhva and Pavithra [17] explored the extensive applications of Gabor filter and
K-means clustering algorithm in detection of text in an unconstrained complex background and regular images. Shraddha Shukla and S. Naganna [18] presented a current review about the K-means clustering algorithm. They have also discussed the applications and limitations of the K-means clustering algorithm. Ashish Dutt et al. [19] reviewed the different types of clustering algorithms as applied in Education Data Mining context. Jelili Oyelade et al. [20] implemented a soft clustering technique for student academic performance analysis. The student academic performance evaluation problem can be treated as the clustering problem where the clusters are formed on the basis of students’ intelligence. They have used the Fuzzy C-means technique for grouping the students. Umamaheswari et al. [21] proposed K-means clustering technique for Myocardial Infarction Prediction. The system discovered and extracted hidden information from historical heart disease data sets. Sri Winiarti et al. [22] have developed a software that can assist the Indonesian government in making decision to take preventive action against malnutrition. They have applied the K-means clustering algorithm to map the data into several malnutrition status categories.
III. METHODOLOGY A. Distance Metrics
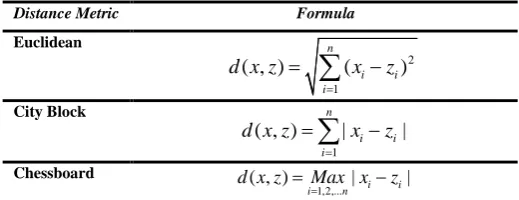
Clustering algorithms are used to find similarity or dissimilarity between any pair of objects. The distance metrics play an important role in data clustering. A distance function calculates the distance between points of a set. The table I shows various distance metrics and their formulae.
The following are the important characteristics of distance metrics [23] [24].
1) d(x, y) ≥ 0, ∀ x and y 2) d(x, y) = 0, only if x = y 3) d(x, x) = 0, ∀ x
4) d(x, y) = d( y, x), ∀ x and y
[image:2.595.309.569.68.168.2]5) d(x, z) ≤ d(x, y) + d( y, z), ∀ x, y and z
Table I. Various Distance Metrics and their Formulae
Distance Metric Formula Euclidean
2
1
( , ) ( )
n
i i
i
d x z x z
=
=
∑
−City Block
1
( , ) | |
n
i i
i
d x z x z
=
=
∑
−Chessboard
1,2,...
( , ) | i i|
i n
d x z Max x z =
= −
B. Hybrid K-MFCM Algorithm
The main drawback of fuzzy c-means algorithm is due to the restriction that the sum of all membership values of a data point in all the clusters must be equal to one. The algorithm has difficulty in handling the outlier data points. The modified fuzzy c-means algorithm imposes a new restriction given in expression (1) which gives the sum of membership values of all the points in all the cluster centers must be equal to the number of data points n. The fuzzy membership values are calculated using the expression (6). This algorithm is efficient in handling outlier data points [25] [26].
1 1
c n
ij j i
u
n
= =
=
∑∑
(1)Hybrid algorithms are based on the integration of two or more algorithms. Recently, hybrid algorithms are mainly applied for improving data clustering results. In this paper, a new hybrid algorithm based on K-means and MFCM (MFCM) is proposed for the clustering problems. The K-MFCM algorithm is given below:
Input: Data set
X
=
{ ,
x x
1 2,...,
x
n}
Output: Cluster centers
z
=
{ ,
z z
1 2,...,
z
n}
, Objective Function Value (OFV) and Cluster validity measures. Step 1: LetX
=
{ ,
x x
1 2,...,
x
n}
be the set of data points andz
=
{ ,
z z
1 2,...,
z
n}
be the set of cluster centers.(i) Select ‘c’ cluster centers randomly from the data set. (ii) Find the distance between the data points and cluster centers.
(iii) Assign each data point
x
ito its nearest cluster centerz
j(iv) Recalculate the cluster center
z
j usingi
i x j j
j
x
z
n
∈=
∑
(2)where
n
j is the number of data points belong to cluster j.(v) Repeat the steps (ii) to (iv) until convergence is obtained.
(vi) Return the final cluster centers.
Step 2: Distance calculation
d
ij2=
||
x
i−
z
j||
2 (3) i = 1, 2, ….., n ; j = 1, 2, . . . , c using centers from step 1 Step 3: Calculate membership function values U = [uij]Step 4: At k steps: calculate the centers vectors Z(k) = [ zj ],
j = 1, 2, ... , c with U(k) according to equation
z j =
m ij i 1 m ij 1
u
x
u
n i n i = =∑
∑
; 1 ≤ j ≤ c (4) Step 5: Compute selected distance d2ijStep 6: Calculate the value of objective function
2
1 1
c n m
m ij ij
j i
J
u d
= =
=
∑∑
(5)Step 7: Update the membership function values U(k) and U(k+1) 1 1 2 1 1 2 1 1
1
*
1
d
m ij ijc n m
k i ik
n
d
u
− − = =
=
∑∑
(6) where||
||;
||
||;1
&1
ij i j ik i k
d
=
x
−
z
d
=
x
−
z
≤ ≤
j
c
≤ ≤
i
n
Step 8: Calculate the cluster validity measures
Step 9: If ||U(k+1) - U(k)|| < Є then stop ; otherwise return to step 4.
IV. RESULTS AND DISCUSSION
[image:3.595.307.567.69.154.2]The objective of this paper is to study the performance of K-MFCM algorithm to data clustering problems using different distance metrics. The parameter values of hybrid algorithm are given in Table II. The performance is measured by the objective function value and cluster validity measures.
Table II. Parameter Values
Parameters Description Value
M Fuzzy index 2.0
ε Iteration Error 0.00001
K Maximum Number of Iterations 100 (or) depends on data set
Table III summarizes the characteristics of various data sets which are taken from UCI machine learning repository [27] to evaluate the performance of the algorithms.
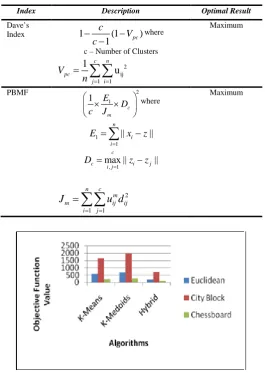
Some popular validity indices [28] [29] are used to evaluate the performance of the algorithms. Table IV gives some cluster validity indices with optimal results.
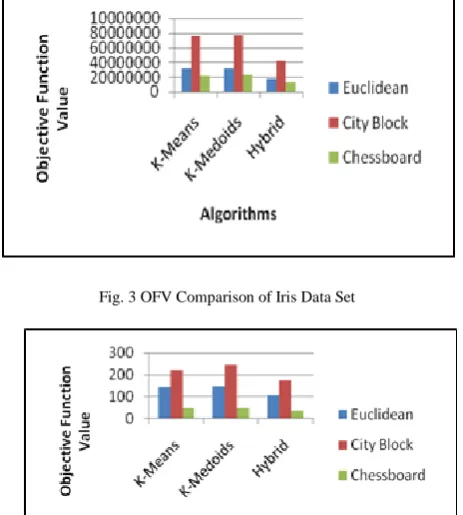
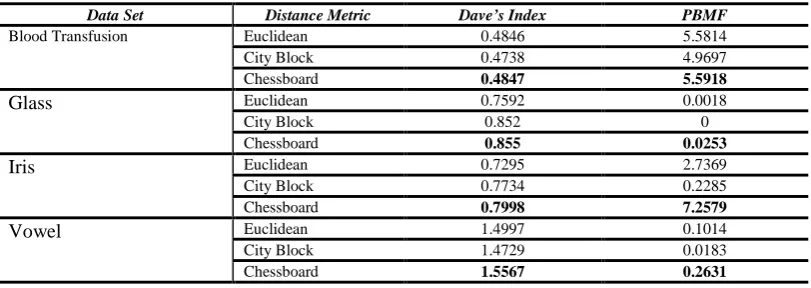
The Objective Function Value (OFV) comparison of various clustering algorithms is shown in Table V. The hybrid algorithm gives better result than means and K-Medoids algorithms. It is also noted that hybrid algorithm based on chessboard distance metric shows better result than other distance metrics. The hybrid algorithm based on chessboard distance metric has the best optimal value of the cluster validity indices such as Dave’s Index and PBMF. The results are given in Table VI. The cluster centroid values produced by hybrid algorithm based on chessboard distance metric are shown in Table VII. Figures 1 to 4 give the OFV of various clustering algorithms of three distance metrics on four data sets.
Table III. Characteristics of Various Data Sets
Data Set Number of Attributes Number of Classes Number of Instances Blood
Transfusion 4 2 748
Glass 9 6 214
Iris 4 3 150
[image:3.595.38.278.77.379.2]Vowel 3 6 871
Table IV. Cluster Validity Indices
Index Description Optimal Result
Dave’s
Index 1 (1 )
1 pc c V c − − − where
c – Number of Clusters
2 ij 1 1 1 u c n pc j i V
n = =
=
∑∑
Maximum PBMF 2 1 1 c m E D c J × × where 1 1 || || n i iE x z
=
=
∑
−, 1
max || ||
c
c i j
i j
D z z
= = − 2 1 1 n c m
m ij ij
i j
J
u d
= =
=
∑∑
[image:3.595.309.575.175.550.2]Maximum
Fig. 1 OFV Comparison of Blood Transfusion Data Set
[image:3.595.27.294.499.566.2] [image:3.595.316.557.597.729.2]Fig. 3 OFV Comparison of Iris Data Set
Fig. 4 OFV Comparison of Vowel Data Set
V. CONCLUSION
In this paper, the random selection of initial centre values and effective handling of outlier data points are resolved by using the hybrid K-MFCM algorithm. The performances of K-Means, K-Medoids and hybrid K-MFCM are shown using different distance metrics such as Euclidean, City block and Chessboard. The performance of the algorithms is evaluated through real world data sets from UCI machine learning repository such as Blood Transfusion, Glass, Iris and Vowel. The hybrid algorithm based on chessboard distance metric is produced minimum OFV and better cluster validity results than other distance metrics for different data sets. The centroid values of hybrid algorithm are also given for various data sets
VI. REFERENCES
[1] J. Han and M. Kamber, “Data mining: Concepts and Techniques”, Morgan Kaufmann, San Francisco, 2001. [2] J. MacQueen, “Some Methods for Classification and
Analysis of Multivariate Observations”, Proceedings of the Fifth Berkeley Symposium on Mathematical Statistics and Probability, vol 1, pp. 281-297, 1961.
[3] L. Kaufman and P. Russeeuw, “Finding Groups in Data: An Introduction to Cluster Analysis”, New York, John Wiley & Sons, 1990.
[4] J.C. Dunn, A fuzzy relative of the ISODATA process and its use in detecting compact well separated clusters”, Journal of Cybernetics, vol. 3, pp. 32-57, 1973.
[5] J.C. Bezdek, “Pattern Recognition with Fuzzy Objective Function Algorithms”, Plenum Press, New York, 1981.
[6] Songul Albayrak and Fatih Amasyah, "Fuzzy C-Means Clustering on Medical Diagnostic Systems", Proc. International XII Turkish Symposium on Artificial Intelligence and Neural Networks (TAINN 2003), 2003. [7] A.B. Goktepe, A. Altun and A. Sezer, "Soil Clustering
by Fuzzy c-rneans Algorithm", Advances in Engineering Software, vol. 36, pp. 691-698, 2005.
[8] O. Torkul, I.H. Cedimoglu and A.K. Geyik, "An Application of Fuzzy Clustering to Manufacturing Cell Design", Journal of Intelligent and Fuzzy Systems: Applications in Engineering and Technology, lOS Press, Amsteerdam, The Netherlands, vol. 17, issue 2, pp. 173-181, 2006.
[9] Mustafa Karabulut and Turgay Ibrikci, "Fuzzy c-means based DNA Motif Discovery," Lecture Notes in Computer Science, Advanced Intelligent Computing Theories and Applications, With Aspects of Theoretical and Methodological Issues, vol. 5226, pp. 189-195,2008.
[10] Li Xiang Jun, Wu You Xin, Qiu Ji Guang and Wan Li Hui, "The Applications of Fuzzy C-Means Clustering in Macro-Economic Forecast", Second International Symposium on Electronic Commerce and Security, vol. I, pp. 609-611, 2009.
[11] Zhe Guo and Furong Wang, “Telecommunications User Behaviors Based on Fuzzy c-means Clustering”, Lecture Notes in Computer Science, Future Generation Information Technology, vol. 6485, pp. 585-591, 2010.
[12] Zhiye Sun, Li Gao, Shuang Wei and Shijue Zheng, "A Fuzzy c-means Clustering Algorithm and Application in Meteorological Data", Proc. Second International Conference on Modeling, Simulation and Visualization Methods (WMSVM), pp. 15-18, 2010.
[13] O.J. Oyelade, O.O. Oladipupo and I.C. Obagbuwa, “Application of k-Means Clustering Algorithm for Prediction of Students’ Academic Performance”, International Journal of Computer Science and Information Security (IJCSIS), vol. 7, No. 1, pp. 292– 295, 2010.
[14] Runhua Wang, Yi Tang, Guoquan Liu and Yan Li, “K-means Clustering Algorithm Application in University Libraries”, 10th IEEE International Conference on Cognitive Informatics & Cognitive Computing (ICCICC), pp. 419–422, 2011.
[15] M.A. Balafar, “Fuzzy c-mean Based Brain MRI Segmentation Algorithms”, Artificial Intelligence Review, vol. 41, Issue 3, pp. 441-449, 2012.
[16] Singh Yadav, Ramjeet, Pradap Singh and Vijendra, “Modeling Academic Performance Evaluation Using Fuzzy c-means Clustering Techniques”, International Journal of Computer Applications, vol. 60, pp. 15-23, 2012.
[17] V.N. Manjunath Aradhva and M.S. Pavithra, “An Application of K-means Clustering for Improving Video Text Detection”, Intelligent Informatics, Advances in Intelligent and Computing, vol. 182, pp. 41–47, 2013.
[18] Shraddha Shukla and S. Naganna, “A Review on K-means Data Clustering Approach”, International Journal of Information and Computation Technology, vol. 4, Numbeer 17, pp. 1847-1860, 2014.
[19] Ashish Dutt, Saeed Aghabozrgi, Maizatul Akmal Binti Ismail and Hamidreza Mohroeian, “Clustering Algorithms Applied in Educational Data Mining”, International Journal of Information and Electronics Engineering, vol. 5, No. 2, pp. 112-116, 2015.
[image:4.595.44.276.67.325.2]of Physical and Life Sciences (CJPL), vol. 4, No. 1, pp. 1-10, 2016.
[21] M. Umamaheswari, Dr. P. Isakki and Devi,
“Myocardial Infarction Prediction Using K-Means Clustering Algorithm”, International Journal of Innovative Research in Computer and Communication Engineering, vol. 5, Special Issue 1, pp. 117-125, 2017.
[22] Sri Winiarti, Herman Yuliansyah and Aprial Andi Purnama, “Identification of Toddlers’ Nutritional Status using Data Mining Approach”, International Journal of Advanced Computer Science and Applications (IJACSA), vol. 9, No. 1, pp. 164-169, 2018.
[23] Gan, G., C. Ma and J. Wu, “Data Clustering: Theory, Algorithms and Applications”, SIAM, Philadelphia, PA, 2007.
[24] M. Mimack, Gillian, J. Mason, Simon, S. Galpin, and Jacquelin, “Choice of Distance Matrices in Cluster Analysis: Defining Regions,” Journal of Climate, vol. 4, Issue 12, pp. 2790-2797, 2001.
[25] R. Krishnapuram and J.M. Keller, “A possibilistic Approach to Clustering”, IEEE Transaction on Fuzzy System, vol. 1, Issue 2, pp. 98-110, 1993.
[26] G. Raju, Binu Thomas, Sonam Tobgay and Th. Shanta Kumar, “Fuzzy Clustering Methods in Data Mining: A Comparative Case Analysis”, IEEE International Conference on Advanced Computer Theory and Engineering, pp. 489-493, 2008.
[27] UCI repository of machine learning databases, University of California-Irvine, Department of Information and Computer Science, http://www.ics.uci.edu/~mlearn/MLRepository.html.
[28] R.N. Dave, “Validating fuzzy partition obtained through c-shells clustering”, Pattern Recognition Lett., vol. 17, pp. 613-623, 1996.
[image:5.595.48.551.306.458.2][29] Weina Wang and Yunije Zhang, “On Fuzzy Cluster Validity Indices”, Fuzzy Sets and Systems, vol. 158, Issue 19, pp. 2095-2117, 2007.
Table V. Objective Function Value (OFV) Comparison of Various Clustering Methods with Hybrid Algorithm
Data Set Distance Metric Objective Function Value (OFV)
K-Means K-Medoids Hybrid
Blood Transfusion Euclidean 677749582.250 684074723.000 504936469.271 City Block 707476419.050 713383386.000 528426340.629 Chessboard 677359575.426 682773264.000 504598791.903
Glass Euclidean 577.407 670.060 196.105
City Block 1647.974 1972.754 696.654
Chessboard 233.334 240.586 86.018
Iris Euclidean 142.859 148.700 105.856
City Block 223.214 245.120 172.520
Chessboard 48.360 49.740 37.034
Vowel Euclidean 31776779.679 31846300.000 18014446.677
City Block 75409724.722 77414400.000 41313204.252 Chessboard 21821571.194 22389100.000 12421744.591
Table VI. Cluster Validity Indices of Hybrid Algorithm for Different Distance Metrics
Data Set Distance Metric Dave’s Index PBMF
Blood Transfusion Euclidean 0.4846 5.5814
City Block 0.4738 4.9697
Chessboard 0.4847 5.5918
Glass Euclidean 0.7592 0.0018
City Block 0.852 0
Chessboard 0.855 0.0253
Iris Euclidean 0.7295 2.7369
City Block 0.7734 0.2285
Chessboard 0.7998 7.2579
Vowel Euclidean 1.4997 0.1014
City Block 1.4729 0.0183
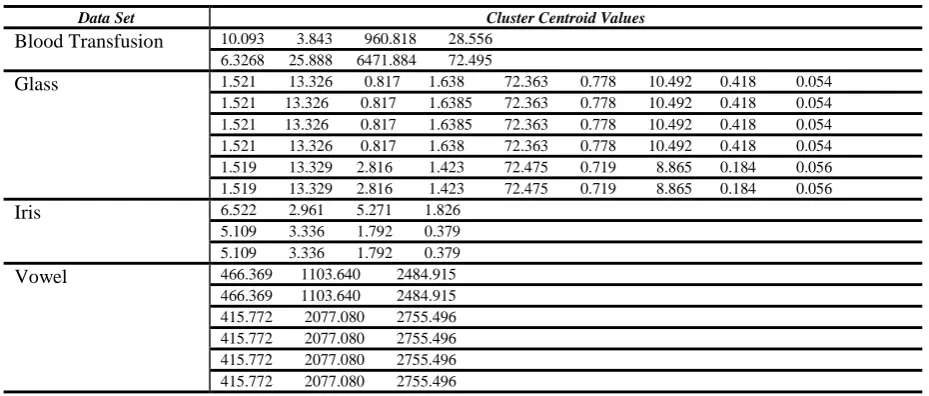
[image:5.595.96.502.481.625.2]Table VII. Cluster Centroid Values Produced by Hybrid Algorithm Based on Chessboard Distance Metric
Data Set Cluster Centroid Values
Blood Transfusion 10.093 3.843 960.818 28.556 6.3268 25.888 6471.884 72.495
Glass 1.521 13.326 0.817 1.638 72.363 0.778 10.492 0.418 0.054 1.521 13.326 0.817 1.6385 72.363 0.778 10.492 0.418 0.054 1.521 13.326 0.817 1.6385 72.363 0.778 10.492 0.418 0.054 1.521 13.326 0.817 1.638 72.363 0.778 10.492 0.418 0.054 1.519 13.329 2.816 1.423 72.475 0.719 8.865 0.184 0.056 1.519 13.329 2.816 1.423 72.475 0.719 8.865 0.184 0.056 Iris 6.522 2.961 5.271 1.826
5.109 3.336 1.792 0.379 5.109 3.336 1.792 0.379 Vowel 466.369 1103.640 2484.915
[image:6.595.66.531.90.288.2]