www.ijrcog.org pISSN 2320-1770 | eISSN 2320-1789
Original Research Article
An audit of caesarean section rate based on Robson’s ten group
classification system
Jishma Jose, Sendhil Coumary Arumugam*, Syed Habeebullah
INTRODUCTION
The incidence of caesarean deliveries is increasing every day going beyond the WHO recommended rate of 15% for all deliveries.1 The contributing factors for the rising rates of caesarean delivery include maternal characteristics, economic, social medico legal factors and malpractice.2 Other important but underestimated factors include women request, hospital system factors, obstetrician's choice and type of care provided by insurance.3 There is growing concern about the higher incidence of long-term complications following one or more caesarean section (CS) such as placenta previa, placenta accrete, retained placenta, and uterine rupture with possible need for peripartum hysterectomy.4
According to the most recent National Family Health Survey (NFHS) (2015-2016), the average rate of C-section in India was 17.2%. The average annual rate of increase (AARI) in India is 8%, which is higher than the global AARI of 4.4% during this period.5 The numbers have escalated in many parts of the country reaching as high as 58% C-section deliveries in Telangana, 40.1% in Andhra Pradesh, 35.8% in Kerala and 34.1% in Tamil Nadu, India.4
There are different classification systems based on indications, urgency, patient characteristics etc. But there is a lack of standardized internationally accepted classification system, to monitor and compare CS rates.6
ABSTRACT
Background: Caesarean section (CS) rates are rising worldwide and is a major public health concern. There is lack of evidence supporting the maternal and neonatal benefits with the increasing CS rates. Robson’s ten group classification system serves as an initial structure with which caesarean section rates can be analysed. RTGCS helps us to analyse and allow us to bring changes in our practice.
Methods: This was a hospital based cross sectional study conducted over a period of 10 months during the year 2018, which involved 1478 pregnant women, out of which 693 underwent CS, those who underwent CS were grouped according to Robson’s Ten group classification system and the data was collected and analyzed.
Results: 693 women underwent CS and the overall section rate was 46.88%. Group 5 (previous LSCS) and Group 2 (nulliparous, >37 weeks, induced) contributed the maximum to the overall CS rates (33.9% and 26.3% respectively). The most common indication for caesarean section was previous LSCS (38%), fetal distress (19.2%) and meconium stained liquor (13.7%).
Conclusions: Robson’s ten group classification system helps us in auditing the caesarean section rates. Group 5 and 2 contributes the maximum for caesarean section rates. Encouraging and adequate counselling for VBAC, proper training of obstetricians in CTG interpretation would reduce the caesarean section rates.
Keywords: Audit, Caesarean section, Robson's
Department of Obstetrics and Gynecology, Mahatma Gandhi Medical College and RI, Puducherry, India
Received: 15 April 2020
Revised: 23 May 2020
Accepted: 28 May 2020
*Correspondence:
Dr.Sendhil Coumary Arumugam, E-mail: [email protected]
Copyright: © the author(s), publisher and licensee Medip Academy. This is an open-access article distributed under the terms of the Creative Commons Attribution Non-Commercial License, which permits unrestricted non-commercial use, distribution, and reproduction in any medium, provided the original work is properly cited.
WHO in April 2015 proposed Robson’s ten group classification system (RTGCS) as a global standard tool for assessing, monitoring and comparing the CS rates between countries.6 This classification is based on 5 parameters: gestational age, parity, onset of labour, presentation, number of gestation.
Robson’s ten group classification system
• Nulliparous, single, cephalic, >37 weeks in spontaneous labour
• Nulliparous, single, cephalic, >37 weeks, induced or CS before labour
• Multiparous (excluding previous CS), single, cephalic, >37 weeks in spontaneous labour
• Multiparous (excluding previous CS), single, cephalic, >37 weeks, induced or CS before labour
• Previous CS, single, cephalic, >37 weeks
• All nulliparous breeches
• All multiparous breeches (including previous CS)
• All multiple pregnancies (including previous CS)
• All abnormal lies (including previous CS)
• All single, cephalic, <36 weeks (including previous CS).
METHODS
The aim of the study was to analyse the caesarean section rates based on the Robson’s ten group classification system. The objective was to identify the group having highest contributing factor and to analyse the caesarean sections rate in each group. This was a hospital based cross sectional study that was conducted in Mahatma Gandhi Medical College and Hospital between February 2018 to November 2018.
Sample size was calculated based on the study done by Radhakrishnan T et al on “increasing trend of caesarean rates in India: evidence from NHFS 4” which showed prevalence of caesarean section rates of Tamil Nadu as 34%. All relevant history and variables needed for the study (age, gestation age, parity, onset of labour, presentation, number of gestations, induced or spontaneous, emergency or elective, indication of caesarean section, baby birth weight, Apgar, NICU admission) were taken as and when CS was done from case records. Privacy and confidentiality were maintained, and the details was recorded in a proforma and classified in Robson’s ten group classification system. The overall caesarean section rate was calculated, and the major contributing factor was also identified. The contribution of each group to caesarean section rate was calculated.
RESULTS
The total number of women who delivered during the period of study were 1478. There were 693 caesarean sections during the study period and 714 live births in the
[image:2.595.310.545.127.491.2]693 sections. The overall caesarean section rate during the period of study was 46.88%.
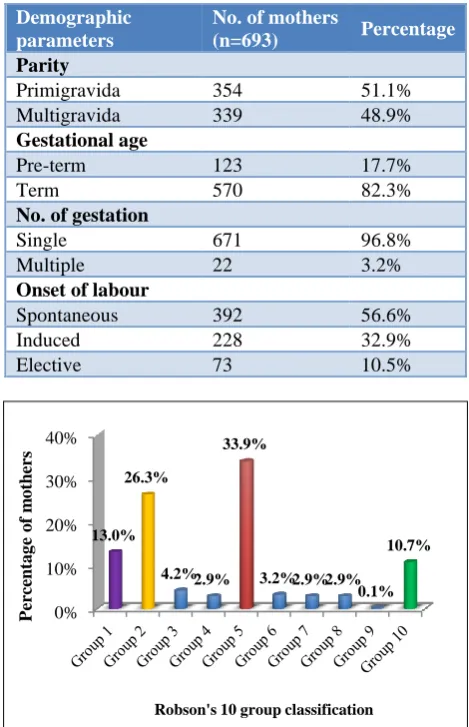
Table 1: Demographic parameters.
Demographic parameters
No. of mothers
(n=693) Percentage
Parity
Primigravida 354 51.1%
Multigravida 339 48.9%
Gestational age
Pre-term 123 17.7%
Term 570 82.3%
No. of gestation
Single 671 96.8%
Multiple 22 3.2%
Onset of labour
Spontaneous 392 56.6%
Induced 228 32.9%
[image:2.595.311.545.129.486.2]Elective 73 10.5%
Figure 1: Robson’s classification.
The 693 women who underwent CS were between the age group of 18 to 39 years and maximum number of women were aged between 25-29 (46.8%). Of the overall 693 patients who has CS 51.1% were nulliparous and rest were multiparous. The 693 women who underwent CS, 82.3% were term patients and 17.7% were pre-term. In the study 96.8% women presented with singleton pregnancies and 3.2% with multiple pregnancies (Table 1).
The 693 women who underwent CS were classified in RTGCS, 235 women in Group 5 and it contributed to 33.9% of the total CS rates. The second highest contributor was Group 2 (nulliparous women, more than 37weeks and induced labour) contributing 26.3% of the overall CS rates. Other groups who underwent CS, were in the ascending order Group 1 (13%), Group 10 (10.7%), Group 3 (4.2%), Group 6 (3.2%), Group 4, 7 and 8 (2.9% each) and Group 9 (0.9%) (Figure 1).
0% 10% 20% 30% 40%
13.0% 26.3%
4.2%2.9% 33.9%
3.2%2.9%2.9% 0.1%
10.7%
Per
ce
n
ta
g
e
o
f
m
o
th
er
s
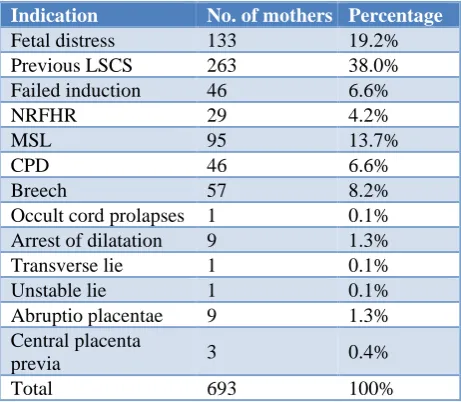
In the study commonest indication for caesarean section was previous LSCS in labour (38%) followed by foetal distress (19.2%) and meconium stained liquor (MSL) (13.7%) (Table 2).
Table 2: Indications for LSCS.
Indication No. of mothers Percentage
Fetal distress 133 19.2%
Previous LSCS 263 38.0%
Failed induction 46 6.6%
NRFHR 29 4.2%
MSL 95 13.7%
CPD 46 6.6%
Breech 57 8.2%
Occult cord prolapses 1 0.1% Arrest of dilatation 9 1.3%
Transverse lie 1 0.1%
Unstable lie 1 0.1%
Abruptio placentae 9 1.3%
Central placenta
previa 3 0.4%
Total 693 100%
Out of 693 women analysed, 620 were emergency LSCS (89.5%) and 73 were elective LSCS (10.5%). 96.4% patients who underwent caesarean section had no complications and 3.6% of patients had complications like postpartum haemorrhage, blood transfusion and postpartum eclampsia, commonest being postpartum haemorrhage.
Totally 714 live babies were delivered including twin births. Maximum number of babies weighed between 2000 gm - 3000 gm (51.3%), 94.1% had an Apgar score of 7/10 and 16.2% were admitted to the NICU. The commonest cause for admission was preterm birth. Other causes were distress at birth and grunting.
DISCUSSION
In the present study, 693 women who underwent CS, Group 5 contributed maximum to the overall CS rates. In a similar study by Ray A et al and Jacob et al in Kerala the overall CS rate was 28.9% and 30.8% respectively and Group 5 contributed to maximum to caesarean section rates, 8.29% and 61.5% respectively of the overall CS rates.7,8
Study conducted by Reddy AY et al, also showed similar results with Group 5 contributing to 18.6% to the overall CS rates 44.6%.9 Other study’s conducted by Zimmo MW et al, Jogia PD et al and Kant et al also showed similar results, that Group 5 contributes to the maximum overall CS rates.10-12
From the above study results it can be inferred that though trial of labour after caesarean section (TOLAC) is being widely advocated, many of the centres in India and
globally are unable to follow it. The reasons being multifactorial ranging from patient refusal to doctor’s fear for complications and poor facilities.
Group 2 was the second major contributor for CS rate (26.3%). The commonest indication in this group was fetal distress (19.2%) and meconium stained liquor (13.7%). A retrospective study of 472 CS cases was carried by Prabhavathi et al, all the cases were grouped according to modified Robson criteria. Their study results showed that Group 2 had an increasing trend in CS rates.13
In this study Group 1 and 3 contribute 13% and 4.2% respectively to the overall CS rates.14 In a similar study conducted by Mbaye et al also showed that group 1 was one of the major contributors to the CS rate of 34.2%.15 and the indication was mainly CPD (55.2%) and fetal hypoxia (27%).
Yadav et al in their study showed that group 1 contributes the largest (37.6%) to the overall CS rates and Group 3 contributes the second largest (15%).16 Also, in a study conducted in Ethiopia Group 3 and Group 1 contributed the maximum to CS rates (21.3% and 19.3% respectively).14 Groups 1 and 3 are expected to have lower CS rates as these are women who present in spontaneous labour. However, in the recent times, all women are allowed a trial of labour and so feto-pelvic disproportions are identified only in active labour.
Group 6 and 7 were smaller groups contributing to only 3.2% and 2.9% to the overall CS rates in present study. These finding were similar to study conducted by Dhodapkar SB et al.17 These groups have a higher incidence of LSCS in all studies. Within the group they had a 100% LSCS rate. The steady incline in LSCS rates in this group is attributable to the fact that assisted breech delivery is an obstetric art that is almost lost. External versions are also no longer done due to lack of knowledge and regular practice.
Group 9 contributes 0.1% of the overall CS rate. Within the group it is a 100% CS rate in the present study. Other studies done by Ray et al, Dhodapkar et al, Bolognani et al and Yadav et al also reports 100% CS rates.7,16-18
In the present study Group10 contributes 10.7% of the overall CS rates. Study conducted by Zimmo MW et al, shows Group 10 contributes 34% to the overall CS rates, which is more than the expected CS rate found in previous studies, which could be because of the large number of women referred to tertiary center for NICU facilities.10 Group 4 contribute 2.9% of the overall CS rate in the present study. According to a study conducted by Litorp et al, Group 4 had the highest increase in CS rates (increase from 26% to 91%).19
Zimmo MW et al.10 They justified their CS rates quoting the fact that twin pregnancies conceived by in vitro fertilization was referred to their center and these women requested for LSCS.
In the present study the most common indication was previous LSCS (38%). Fetal distress (19.2%), MSL (13.7%), breech (8.2%), failed induction (6.6%) and CPD (6.6%) were other indications. It has also been observed from other studies conducted by Ray et al, Yadav et al, Prabhavathi et al and Arpita Y Reddy that previous LSCS is most common indication for caesarean section.7,9,13,16
Another important indication for LSCS in the present study was meconium stained liquor (13.7%). In a retrospective study conducted by Sasikala et al, on perinatal outcome in meconium stained liquor and the mode of delivery reported that in centres with limited facilities for electronic fetal monitoring decision regarding continuing a vaginal mode of delivery in the presence of MSL would be difficult. However, a CS done for MSL may not prevent a meconium aspiration syndrome (MAS). Amnioinfusion in these conditions could bring down the incidence and severity of MAS.20
Among the 714 babies delivered majority of the babies (51.3%) weighed between 2 kg and 3 kg, 41.6% between 3 and 4 kg. Only 5.6% babies weighed between 2 kg and 1 kg. In the present study 6.1% babies had an Apgar less than 7/10 and 16.2% were admitted in NICU, the commonest cause was preterm. Though fetal distress and MSL contributed maximum (19.2% and 13.7% respectively) for CS rates, it was not an indication for NICU admission.
The limitations of this study, as such are the limitations of Robson’s ten group classification system. It does not classify caesarean sections done for specific conditions like major degree placenta previa and those done for maternal request. It also does not classify caesarean sections done for medical, other obstetric complication in the mother and those CS done for fetal indications e.g. Anhydramnios. As the present study has audited only indications for CS, it was unable to analyse the total number women in that group and the overall percentage of women in that group requiring CS versus those who had vaginal delivery which would have added more meaning to the audit.
CONCLUSION
In the present study analysis of caesarean section rates was done using Robson’s ten group classification system. The major contributing groups for CS were Group 5 (previous LSCS) and Group 2 (nulliparous, >37 weeks, single, cephalic, induced or CS before labour). The commonest indication for primary caesarean section was fetal distress and meconium stained liquor. After analysis of CS rates in the study hospital, authors recommend trial of labour after caesarean section (TOLAC) for women
with previous LSCS, who consent for vaginal delivery providing close maternal and fetal monitoring. As fetal distress is one among the common indication for primary caesarean section and electronic fetal monitoring is the norm, it is important that all obstetricians in the institute are well trained in interpreting of cardiotocography (CTG). Further, the art of assisted vaginal breech delivery and external cephalic version is lost and should be revived with regular skill workshops.
Funding: No funding sources Conflict of interest: None declared
Ethical approval: The study was approved by the Institutional Ethics Committee
REFERENCES
1. Dosa L. Caesarean section delivery, an increasingly popular option. Bull World Health Organ. 2001;79(12):1173.
2. Betrán AP, Merialdi M, Lauer JA, Bing-Shun W, Thomas J, Van Look P, et al. Rates of caesarean section: analysis of global, regional and national estimates. Paediatr Perinat Epidemiol. 2007;21(2):98-113.
3. Kaimal AJ, Kuppermann M. Decision making for primary cesarean delivery: the role of patient and provider preferences. Semin Perinatol. 2012;36(5):384-9.
4. Tanaka K, Mahomed K. The ten-group Robson classification: a single centre approach identifying strategies to optimise caesarean section rates. Obstet Gynecol Inter. 2017;2017.
5. Radhakrishnan T, Vasanthakumari KP, Babu PK. Increasing trend of caesarean rates in India: evidence from NFHS-4. JMSCR. 2017;5(8):26167-76. 6. Robson M. The ten-group classification system
(TGCS) - a common starting point for more detailed analysis. An Int J Obstet Gynaecol. 2015;122(5):701-1.
7. Ray A, Jose S. Analysis of caesarean-section rates according to Robson’s ten group classification system and evaluating the indications within the groups. Int J Reprod Contracept Obstet Gynecol. 2017;6(2):447-51.
8. Jacob KJ, Jayaprakash M, Hibina KP. TMC (Thrissur Medical College) modified Robson criteria for caesarean sections. Int J Reprod Contracept Obstet Gynecol. 2017;6:5038-43.
9. Reddy AY, Dalal A, Khursheed R. Robson ten group classification system for analysis of cesarean sections in an Indian Hospital. Res J Obstet Gynecol. 2018;11(1):1-8.
10. Zimmo MW, Laine K, Hassan S, Bottcher B, Fosse E, Ali-Masri H, et al. Caesarean section in palestine using the Robson ten group classification system: a population-based birth cohort study. BMJ Open. 2018;8:e022875.
classification system at a tertiary care centre in Western India. Int J Reprod Contracept Obstet Gynecol. 2019;8:433.
12. Kant A, Mendiratta S. Classification of cesarean section through Robson criteria: an emerging concept to audit the increasing cesarean section rate. Int J Reprod Contracept Obstet Gynecol. 2018;7:4674. 13. Prabhavathi V, Krishnamma BS, Prasad DKV,
Bhavya K, Satyavathi R. Audit of caesarean deliveries in a tertiary care hospital of northern Andhra Pradesh using modified Robson criteria. In Int J Reprod Contracept Obstet Gynecol. 2018:2796-801.
14. Tura AK, Pijpers O, de Man M, Cleveringa M, Koopmans I, Gure T, et al. Analysis of caesarean sections using Robson 10-group classification system in a university hospital in eastern Ethiopia: a cross-sectional study. BMJ Open. 2018;8(4):e020520. 15. Mbaye M, Gueye M, Gueye MDN, Niang NKS,
Moreau JC. Analysis of cesarean section rate according to Robson’s classification in an urban health centre in Senegal. Int J Reprod Contracept Obstet Gynecol. 2017;4(4):1100-2.
16. Yadav RG, Maitra N. Examining cesarean delivery rates using the Robson’s Ten-group classification. J Obstet Gynaecol India. 2016;66(Suppl 1):1-6. 17. Dhodapkar SB, Bhairavi S, Daniel M, Chauhan NS,
Chauhan RC. Analysis of caesarean sections
according to Robson’s ten group classification system at a tertiary care teaching hospital in South India. Int J Reprod Contracept Obstet Gynecol. 2017;4(3):745-9.
18. Bolognani CV, Reis LB de SM, Dias A, Calderon I de MP. Robson 10-groups classification system to access C-section in two public hospitals of the Federal District/Brazil. PLoS ONE. 2018;13(2):e0192997.
19. Litorp H, Kidanto HL, Nystrom L, Darj E, Essén B. Increasing caesarean section rates among low-risk groups: a panel study classifying deliveries according to Robson at a university hospital in Tanzania. BMC Preg Childbirth. 2013;13:107.
20. Sasikala A, Raghavan S, Mishra N, Khatoon S, Bupathy A, Rani R. Perinatal outcome in relation to mode of delivery in meconium stained amniotic fluid. Indian J Pediatr. 1995;62(1):63-7.
Cite this article as: Jose J, Arumugam SC, Habeebullah S.An audit of caesarean section rate based on Robson’s ten group classification system. Int J Reprod Contracept Obstet Gynecol