Original Research Article
Increasing rates of cesarean section, an upcoming public health
problem: an audit of cesarean section in a tertiary care center of North
India based on Robson classification
Vinita Das, Namrata Kumar*, Varsha Kumari, Anjoo Agarwal, Amita Pandey, Smriti Agrawal
INTRODUCTION
Increasing rates of cesarean section (CS) during last three decades has become a cause of alarm since and a need for ongoing studies. CS is one of the most common major surgical procedures in health care services. The CS epidemic is a reason for immediate concern and deserves serious international attention.
The consensus recommendation is 10- 15% WHO.1 Many
are questioning the recommended optimal CS rate by suggesting that lowering the rate may be dangerous. Efforts to bring down the rate have failed and it is on a steady rise. According to the World Health report there is
no justification for any region to have CS rates higher than 10-15 %.
Various reasons for increased caesarean section rates over the last 40 years which include relatively safer surgical procedure, medico legal litigations, maternal choice, advanced age of women giving birth, obesity and various co-existing medical conditions making pregnancies a high risk one.
Common Indications include fetal distress, prolonged labor, breech presentation, multiple gestations, previous section, and CS on demand. Robson classification is well standardized system of reporting cesarean section and is now universally acceptable.
ABSTRACT
Background: Increasing rates of cesarean section during last three decades has become a cause of alarm since and a need for ongoing studies. Objective of present study was to investigate cesarean section rates as per modified Robsons Criteria and to determine area of concern which requires maximum focus to decrease overall caesarean rate
Methods: This cross sectional study was conducted over a period of one year (From January 2016 to December 2016) in the Department of Obstetrics and Gynecology at King George’s Medical University, Lucknow.
Results: Total number of deliveries for one year was 8526. Out of them, 4275 (50.1%) were vaginal and 4251 (49.9%) were abdominal. Overall maximum caesarean section rate was contributed by group 5 of modified Robsons criteria i.e. previous section, singleton, cephalic, ≥37 weeks (17.7%).
Conclusions: Robson 10 group classification provides easy way in collecting information about Cesarean section rate which obtains good insight into certain birth groups. It is important that efforts to reduce the overall CS rate should focus on reducing the primary CS rate (group 1 and 2) and on increasing vaginal birth after CS (group 5). The caesarean rate is commonest in group 5 that is previous section (17.7%).
Keywords: Cesarean, Robson, Vaginal birth after cesarean
Department of Obstetrics and Gynecology, King George’s Medical University, Lucknow, Uttar Pradesh, India
Received: 23 August 2017 Accepted: 16 September 2017
*Correspondence: Dr.Namrata Kumar,
E-mail: [email protected]
Copyright: © the author(s), publisher and licensee Medip Academy. This is an open-access article distributed under the terms of the Creative Commons Attribution Non-Commercial License, which permits unrestricted non-commercial use, distribution, and reproduction in any medium, provided the original work is properly cited.
Consequences of caesarean sections include recurrent CS, scar rupture, cesarean hysterectomy, maternal and fetal deaths and placental abnormalities including placental abruption, placenta previa, and adherent placentation which often turn into a surgical havoc.
The aim of this study was to investigate cesarean section rates as per modified Robsons Criteria and to determine area of concern which requires maximum focus to decrease overall caesarean rate in the Department of Obstetrics and Gynecology, King George’s Medical University Lucknow, India.
METHODS
As a routine, according to the departmental policy all women who were planned to be taken up for caesarean section have a documentation in the delivery register in which there is a clear documentation of the details of the patient and the indications of the caesarean section along with high risk factors and induction protocols.
This cross sectional study was conducted over a period of one year (From January 2016 to December 2016) as from the hospital records in the Department of Obstetrics and Gynecology at a tertiary care centre. Collected data was classified according to modified Robson’s Criteria for Caesarean section. Relevant obstetric data as parity, mode of previous deliveries, previous caesarean section indications and gestational age was noted.
RESULTS
[image:2.595.311.541.212.745.2]Robson system of classification of CS has been used as a standard method for analysis of CS2 as shown in Table1.
Table 1: The standard Robson criteria.
No. Groups
1. Nulliparous, single cephalic >37 weeks in spontaneous labour
2. nulliparous, single cephalic, >37 week, induced or CS before labour
3. Multiparous (excluding previous CS), single cephalic, >37 week in spontaneous labour
4.
Multiparous (excluding previous CS), single cephalic, >37 week, induced or CS before labour
5. Previous CS, single cephalic, >37 weeks 6. All nulliparous breeches
7. All multiparous breeches (including previous CS) 8. All multiple pregnancies (including previous CS) 9. All abnormal lies (including previous CS)
10. All single cephalic, <36 wks (including previous CS)
All those women who underwent delivery during this period were noted and those who had cesarean section were classified according to modified Robsons criteria
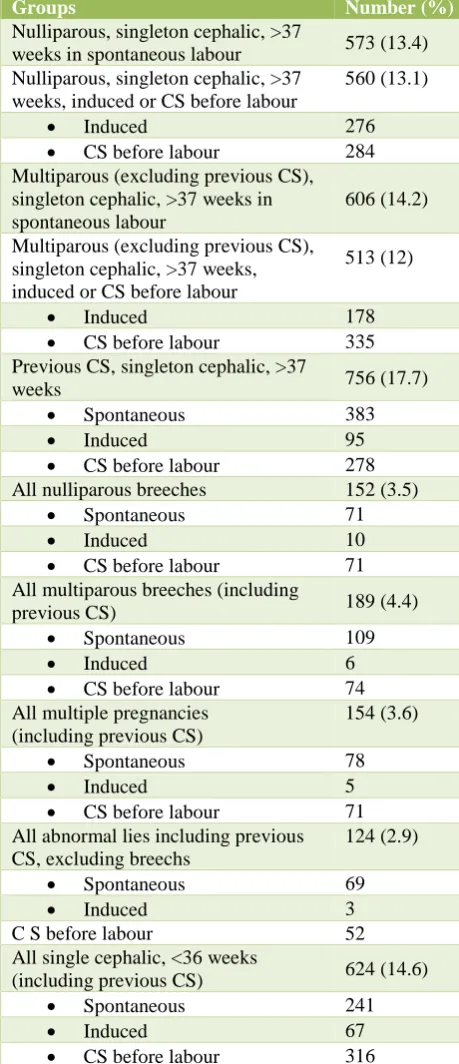
(Table 2). Total number of deliveries during one year was 8526. Out of them, 4275 (50.1%) were vaginal and 4251 (49.9 %) were abdominal. It was then analyzed which group is the lead contributor and where intervention can be done to reduce overall cesarean rates. Overall maximum caesarean section rate was contributed by group 5 of modified Robsons criteria i.e. previous section, singleton, cephalic, ≥37 weeks (17.7%).
Table 2: Classification of caesarean according to Modified Robson’s classification (N = 4251).
Groups Number (%)
Nulliparous, singleton cephalic, >37
weeks in spontaneous labour 573 (13.4) Nulliparous, singleton cephalic, >37
weeks, induced or CS before labour
560 (13.1)
• Induced 276
• CS before labour 284 Multiparous (excluding previous CS), singleton cephalic, >37 weeks in spontaneous labour
606 (14.2)
Multiparous (excluding previous CS), singleton cephalic, >37 weeks, induced or CS before labour
513 (12)
• Induced 178
• CS before labour 335 Previous CS, singleton cephalic, >37
weeks 756 (17.7)
• Spontaneous 383
• Induced 95
• CS before labour 278 All nulliparous breeches 152 (3.5)
• Spontaneous 71
• Induced 10
• CS before labour 71 All multiparous breeches (including
previous CS) 189 (4.4)
• Spontaneous 109
• Induced 6
• CS before labour 74 All multiple pregnancies
(including previous CS)
154 (3.6)
• Spontaneous 78
• Induced 5
• CS before labour 71 All abnormal lies including previous CS, excluding breechs
124 (2.9)
• Spontaneous 69
• Induced 3
C S before labour 52
All single cephalic, <36 weeks
(including previous CS) 624 (14.6)
• Spontaneous 241
• Induced 67
[image:2.595.54.282.509.715.2]DISCUSSION
Cognisance of the increased rates of CS has come in light when rates of complication in form of invasive placentation begun to rise in number.
Long back, in 2001 this well designed classification system was introduced and later became more defined.3-5
Yadav RG et al did examined caesarean delivery rates by using Robsons Ten group Classification system from 2004 to 2013.6 Out of 40,086 deliveries at their centre,
the CS rate was 25.17%. They found that group one had the highest contribution followed by group five while we found that group five had maximal contribution in our study. It reflects the centre to centre variation and also the type of referral the centre faces.
Ono T et al analysed Japanese database for a comparative analysis of caesarean section rates of various centres in Japan.7 They found that group three CS rates were higher
in their comprehensive centre compared to the regional centres. They could then realize the centre variation and hence the type of intervention required.
At our centre, it is a routine policy to have elective CS in IVF conceived women owing to amount of mental and financial burden the patient has undergone which does not provide even a small window of any slightest risk to the baby. However, the principal is not scientifically sound. Tan JK et al studied 215 IVF conceived pregnancies in Japan and found a CS rate of 54.4 %.8 In
their study group of IVF pregnancies, group eight emerged as the single most important contributor of CS (43%) and group two being second. In their control group of non- IVF pregnancies, the most important contributor was group five and group ten. This made an inference that multiple pregnancies are the principal cause of high CS in IVF conception and reducing its incidence might reduce CS rates as well. A motivated step towards single embryo transfer can be thought.
A comparative analysis of international caesarean delivery rates in nine institutional cohorts of different countries by Brennan DJ et al showed that although overall CS rates correlated with CS rates in singleton cephalic nulliparas.9 Once a caesarean, always a
caesarean holds true in our study. McCarthy FP et al also found in their study of 5833 women in Australia and found that women group five were the single greatest contributor to both elective and total CS rates.10
Reasons and indications of going ahead for a CS varies from place to place and time to time but essentially one can intervene if trend appears detrimental. Study by Howell S et al evaluated the trend of caesarean section in Queensland from 1997 to 2006.11 Similar to present study
they found that multiparous women with a previous caesarean section birth (group five) had the greatest contribution. Need of the hour is to reduce first or primary CS and then only we can reduce a repeat CS and
limitation of caesarean section rates in low risk pregnancies is key to lowering the trend of increased abdominal deliveries in long term.
Brennan DJ reported a study which examined contribution by singleton, cephalic, term nulliparous women (group one) over a period of 35 years.12 The
found a significant increase in CS in group one which rose from 2.3% to 7.2%. In present study also, we find a fairly hand some contribution of group one (13%).
Group five was the highest contributor followed by group one in a retrospective study by Chong Cin Singapore.13
Triunfo S et al analysed trend of CS in Italian population from 1999 to 2011, group five again emerged as most significant contributor of CS rate (16.2%) followed by group one and two.14
Similar trend was also reported by Tapia V et al in Peru where the caesarean section rate was 27% and a yearly increase in the overall caesarean section rates from 2000 to 2010 from 23.5% to 30%.15 The caesarean section rates
increased as result of increased CS in groups with spontaneous labor and in-group of multiparas with a scarred uterus.
This reinforces that present policies should be directed at reducing CS in nulliparous women, particularly by reducing the number of elective CS and encouraging vaginal birth after cesarean to reduce repeat CS in multiparous women.
World health Organization conducted a multi country surveyin 21 countries to study the use of the Robson classification to assess caesarean section trends.16
Strategies to reduce the frequency of the procedure should include avoidance of medically unnecessary primary caesarean section. Improved case selection for induction and pre labour caesarean section could also reduce caesarean section rates.
The Eunice Kennedy Shriver National Institute of Child Health and Human Development, the Society for Maternal-Fetal Medicine, and the American College of Obstetricians and Gynecologistsissued key points after a joint workshop to assist with reduction in cesarean delivery rates.17 Adequate time for normal latent and
counselling should include its effect on future reproductive health.
A highly motivated step for avoiding the first CS was reported by Blomberg M using structured organizational and cultural change targeting nulliparous women at term with spontaneous onset of labour and cephalic presentation, they could reduce overall CS rates from 20% to 10% and CS rates in group 1 from 10% in 2006 to 3% in 2015 without any increased neonatal complications and with good patient satisfaction.18
CONCLUSION
Robson 10 group classification provides easy way in collecting information about Cesarean section rate which obtains good insight into certain birth groups. A detailed analysis of 10 groups helps us to detect the causes of increased Cesarean section rates for each group. It is important that efforts to reduce the overall CS rate should focus on reducing the primary CS rate and on increasing vaginal birth after CS. A tertiary care centre receives referrals from all over the state and the adjoining states which accounts for the higher caesarean section rate. The caesarean rate is commonest in group five that is previous section (17.7%). The need of the hour is to reduce the primary caesarean section and a dedicated effort to avoid maximum possible CS in these groups can contribute to decline in overall rates.
A better effort in reducing a relatively preventable primary cesarean indication needs enforcement which include preventing failed inductions by a better induction protocols, avoiding unindicated inductions, practicing more versions in primi breech, improving labour management in nulliparas women, considering adequate labour only if cervix is 6cm dilated, with membranes ruptured, 4 hours or more of adequate contractions or 6 hours or more of inadequate contractions with no cervical change, defining second stage arrest only if no progress for more than 3 hours in nulliparas and 2 hours in multiparas and not doing any cesarean before these time limits in the presence of reassuring maternal and fetal status. Further important measures include practicing partogram, WHO checklist and easy availability of epidural analgesia which can reduce cesarean delivery on maternal request as an indication to skip the process of normal labor. Also, it is important to promote vaginal delivery after cesarean birth at the same time.
Funding: No funding sources Conflict of interest: None declared
Ethical approval: The study was approved by the Institutional Ethics Committee
REFERENCES
1. World Health Organisation. Appropriate technology for birth. Lancet. 1985;2(8452):436-7.
2. Fatusic J, Hudic I, Fatusic Z, Zildzic-Moralic A, Zivkovic M. Cesarean Section Rate Analysis in University Hospital Tuzla-According to Robson’s Classification. Med Arch. 2016 Jun;70(3):213-16. 3. Robson MS. Can we reduce the caesarean section
rate? Best Pract Res Clin Obstet Gynecol. 2001;15(1):179-94.
4. Robson M, Murphy M, Byrne F. Quality assurance: the 10-group Classification system (Robson classification), induction of labor, and cesarean delivery. Int J Gynecol Obstet. 2015;131:S23-S27. 5. Jayot A, Nizard J. Evolution of caesarean categories
in a modified Robson classification in a single centre from 2002 to 2012 due to high rate of maternal pathology. J Obstet Gynecol Res. 2016;42(6):648-54.
6. Yadav RG, Maitra N. Examining Cesarean delivery rates using Robson’s Ten group classification. J Obstet Gynecol India. 2016;66(1):1-6.
7. Ono T, Matsuda Y, Sasaki K, Satoh S, Tsuji S, Kimura F et al. Comparative analysis of caesarean section rates using Robson Ten Group Classification System and Lorenz curve in the main institutions in Japan. J Obstet Gynecol Res. 2016;42(10):1279-85. 8. Tan JK, Tan EL, Kanagalingam D, Yu SL, Tan LK.
Multiple pregnanciesis the leading contributor to caesarean sections in in vitro fertilization pregnancies: An analysis using the Robson 10 group classification system. J Obstet Gynecol Res. 2016;42(9):1141-5.
9. Brennan DJ, Robson MS, Murphy M and O’Herlihy C. Comparitive analysis of international caesarean delivery rates using 10- group classification identifies significant variation in spontaneous labour. Am J Obstet Gynecol. 2009;201(3):308.e1-8. 10. McCarthy FP, Rigg L, Cady L and Cullinane F. A
new way of looking at Caesarean section births. Aust N Z J Obstet Gynecol. 2007;47(4):316-20.
11. Howell S, Johnston T, Macleod SL. Trends and determinants of caesarean sections births in Queensland, 1997-2006. Aust N Z J Obstet Gynecol. 2009;49(6):606-11.
12. Brennan DJ, Robson MS, Murphy M, O’Herlihy C. The singleton, cephalic nulliparous women after 36 weeks of gestation: contribution to overall caesarean and delivery rates. Obstet Gynecol. 2011;117(2):273-9.
13. Chong C, Su LL, Biswas A. Changing trends of caesarean section births by the Robson Ten Group Classification in a tertiary care teaching hospital. Acta Obstet Gynecol Scand. 2012;91(12):1422-7. 14. Triunfo S, Ferrazzani S, Lanzone A, Scambia G.
Identification of Obstetrics targets for reducing caesarean section rate using the Robson Ten Group Classification in a tertiary level hospital. Eur J Obstet Gynecol Reprod Biol. 2015;189:91-5.
16. Vogel JP, Betrán AP, Vindevoghel N, Souza JP, Torloni MR, Zhang J. Use of the Robson classification to assess caesarean section trends in 21 countries: a secondary analysis of two WHO multicountry surveys. Lancet Global Health. 2015;3(5):e260-70.
17. Spong CY, Berghella V, Wenstrom KD, Mercer BM, Saade GR. Preventing the first cesarean delivery: summary of a joint Eunice Kennedy Shriver national institute of child health and human development, society for maternal-fetal medicine, and American college of obstetricians and gynecologists workshop. Obstet Gynecol. 2012 Nov;120(5):1181-93.
18. Blomberg M. Avoiding the first caesarean section – result of structured organizational and cultural changes. Acta Obstet Gynecol Scand. 2016;95(5):580-6.