Volume 8, No. 1, Jan-Feb 2017
International Journal of Advanced Research in Computer Science
RESEARCH PAPER
Available Online at www.ijarcs.info
© 2015-19, IJARCS All Rights Reserved 8
ISSN No. 0976-5697
AN EFFECTIVE THRESHOLD APPROACH FOR MEDICAL IMAGE
COMPRESSION
Dr. G.J. Joyce Mary Research Guide and
PRIST University, Vallam,Thanjavur Tamilnadu, India.
A. Ramachandran
Ph.D Research Scholar and Assistant Professor PRIST University, Thanjavur, Tamilnadu, India and Department of CSE, Srinivasan Engineering College,
Tamilnadu, India.
Abstract: The medical image compression methods aim to compress the image while ensuring that reduce the volume of storage in compression technique produce the good quality level images. The storage and transmission of medical images has made compression be required to digital world. In current research an efficient algorithm to compress and reconstruct the medical images. The newly proposed algorithm extracts edge information of medical images by using edge detector mechanism. Recent image compression techniques have increased the possibility by reducing the bandwidth requirement and cost-effective rescue of medical images for crucial analysis. The medical images are decomposed using Effective Discrete Wavelet Transform (EDWT). The wavelet coefficients are encoded using arithmetic coder. Better visual quality image is producing by newly proposed method at a lower bit rate compared with other standard compression algorithms. The image quality is evaluated by intention of image quality measures. The wavelet coefficients are encoded using Set Partitioning in Hierarchical Trees (SPIHT). The newly proposed algorithm is providing the enhancement function to improve the perceptual quality of the medical image. The newly proposed efficient compression algorithm to manage the increasing demands for image storage, quality and transmission time. Consistent Compression Ratio (CR), quality images are produced by this method compared with JPEG, SPIHT and MICT algorithm. Experimentation has been carried out on different image formats successfully. The proposed system achieved a good compression ratio and considerable test application for the quality of the reconstructed image.
Keywords:Medical Image, SPHIT, DWT, Digital Image, Image Compression, Image Quality.
I. INTRODUCTION
The medical image compression method motivation is reducing the size of image without deprivation in the diagnostic information. The current ongoing challenge in the medical field is efficient compression scheme as well as loss of information may mislead diagnosis. Compression of medical image is reducing their storage and transmission bandwidth requirement is great interest in the implementation of systems such as PACS (picture archival and communication system) and teleradiology. Currently, the subbands or wavelet coding has proven to be a very useful framework for loss compression of medical images [1]. In an image compression two basic transform techniques are spatial domain technique and transform domain technique. Spatial domain technique is directly operated on the pixels of the image combine spatial algorithm and coding method. The transform domain technique image transforms are used to decorrelate the pixels and the information packed coefficients are quantized and coded [2]. The most popular transform techniques are Discrete Cosine Transform (DCT) and Discrete Wavelet Transform (DWT) [3]. The most popular entropy coding techniques are Arithmetic coding technique and Huffman coding technique [4].
The compression is reducing the image devotion, especially when the images are compressed at lower bit rates. The reconstructed images suffer from blocking artifacts and the quality of the image is severely degraded under the circumstances of high compression ratio, which is shown by the JPEG standard. In recent years, much of the
research activities in image coding have been focused on the discrete wavelet transform (DWT) as the overlapping nature of the transform alleviates blocking artifacts, while the multi-resolution character of the wavelet decomposition leads to superior energy compaction and perceptual quality of the decompressed image. Furthermore, the multi-resolution transform domain means that wavelet compression methods degrade much more gracefully than block-DCT methods as the compression ratio increases. As a result, a new International Standard for image coding called JPEG2000. This introduction has meant that for the first time, the discrete wavelet transform is to be used for the decomposition and reconstruction of images together with an efficient coding scheme. The aim of multi-resolution analysis is simultaneous image representation on different resolution level [5]. This kind of representation is well suited to the properties of Human Visual System (HVS).
Wavelet Transforms have been successful in providing high rates of compression while maintaining good image quality and are superior to Discrete Cosine Transform methods. The variety of wavelet based compression methods have been introduced after the introduction of Discrete Wavelet Transform [8]. The Effective Discrete Wavelet Transform methods have been compared with existing method [9].
The Embedded Zero tree Wavelet (EZW) which uses parent-child dependencies between subband coefficients at the same spatial location of wavelet decomposed image [10]. Set Partitioning in Hierarchical Trees (SPIHT) which uses the self similarity between subbands of wavelet decomposed image and JPEG2000 algorithm [11] which uses Embedded Block Coding with Optimized Truncation (EBCOT) are the most popular methods. In teleradiology applications, several research works have been performed to determine the degree of compression that maintains the diagnostic image quality [12]. Effects of JPEG and wavelet compression of spiral low-dose CT images on detection of small lung cancers are proved that there is no loss in diagnostic accuracy for compression ratios up to 9:1[13]. Compression of medical images is vital in achieving a low bit rate [14] in the representation of radiology images in order to reduce the data volume, without loss in diagnostic information [15].
Ultrasound gray scale image compression with JPEG and wavelet techniques are discussed diagnostic accuracy and reported that reconstructed medical images with a compression ratio of 9:1 do not result in visualdegradation [16]. Effects of JPEG and wavelet compression of spiral low-dose CT images on detection of small lung cancers are investigated the effect of JPEG and wavelet compression algorithm on medical images and concluded that compression ratio up to 10:1 is acceptable [17] .Statistical analysis of different image for absolute lossless compression of medical images are proposed a compression technique, which is a hybrid of lossless and lossy techniques using neural network vector quantization and Huffman coding [18] . This high complexity technique is tested for medical images achieving compression ratio of 5 to 10. Chen proposed a new algorithm for medical image compression that is based on SPIHT algorithm [14]. An 8 x 8 FDCT [7] approach is adopted to perform subband decomposition. SPIHT is then employed to organize data. This is block-based technique and more complexity is involved. The author concluded that for application in medical domain some adaptations are needed to remove blocking artifacts. All these type of techniques discussed involve multiple levels of wavelet decomposition resulting in high computational complexity. Higher level of decomposition results in more details that can be thresholded to get high compression ratios but leads to energy loss. Energy retained will be more if the image is decomposed to fewer levels but compression attained is less [19]. The issue is not whether to compress medical images using lossless or lossy techniques, but preferably which type of compression can be used without compromising image quality [20]. This current research is present a new novel type of thresholding to maximize CR without sacrificing analytic information.
II. IMAGE COMPRESSION METHODOLOGY
A. Principle of Image Compression
An ordinary characteristic of most images is that the neighboring pixels are correlated and therefore hold redundant information. The foremost task then is to find out less correlated representation of the image. Two elementary components of compression are redundancy and irrelevancy reduction. Redundancy reduction aims at removing duplication from the signal source image. Irrelevancy reduction omits parts of the signal that is not noticed by the signal receiver, namely the Human Visual System (HVS). In general, three types of redundancy can be identified
• Spatial Redundancy or correlation between neighboring pixel values
• Spectral Redundancy or correlation between different color planes or spectral bands
• Temporal Redundancy or correlation between adjacent frames in a sequence of images especially in video applications.
Image compression research aims at reducing the number of bits needed to represent an image by removing the spatial and spectral redundancies as much as possible [21].
B. Compression Technique
Image compression focuses on the problem of reducing the amount of data required to represent a digital image. The process of image compression is reducing the image size for storage requirements of representation in an image. Compression is obtained by the removal of one or more of the three basic data redundancies: When less than Coding redundancy is optimal code words are used. Inter pixel redundancy results from correlations between the pixels of an image. Psycho visual redundancy is due to data that is ignored by the human visual system. An image compression technique is used to reduce the number of bits required by representing an image and taking advantage of these redundancies [22].
C. Lossless vs. Lossy Compression
The image compression will become fruitful when the superiority of image gets maintained. Wavelets give the better performance for maintaining image quality in image compression. Image compression can be done by any of two types are Lossy Compression and Lossless Compression [14]. Lossless compression technique but the reconstructed image contains degradations relative to the original image or input image. In lossless image compression, the reconstructed image is numerically and visually identical to the original or input image. The level of image compression achieved can be represented by Compression Ratio (CR). The CR achieved for lossless techniques are around 2:1 to 3:1. A lossy compression method is called visually lossless when the loss of information caused by compression method is invisible for an observer [23].
D. Wavelet Coding
© 2015-19, IJARCS All Rights Reserved 10
representing transients, such as percussion sounds in audio, or high-frequency components in two-dimensional images, for example an image of stars on a night sky. This means that the transient elements of a data signal can be represented by a smaller amount of information than would be the case if some other transform, such as the more widespread discrete cosine transform, had been used First a wavelet transform is applied. This produces as many coefficients as there are pixels in the image (i.e.: there is no compression yet since it is only a transform). These coefficients can then be compressed more easily because the information is statistically concentrated in just a few coefficients. This principle is called transform coding. After that, they are quantized and the quantized values are entropy coded and run length coded. JPEG 2000 is a wavelet based coding scheme. In encoding the image and its components are decomposed into rectangular tiles. Wavelet transform is applied on each tile. After quantization sub bands of coefficients are collected into rectangular array of code blocks. Certain ROI is encoded with high image quality. Markers are added in the bit stream to avoid error resilience.
E. Medical Images Analysis
The image content being viewed influences the perception of quality irrespective to technical parameters of the system. There are few modalities of medical images that have been identified in this system, which includes X-Ray, CT scan and MRI. In lossless image compression, the reconstructed image is numerically and visually identical to the original or input image. The level of image compression achieved can be represented by Compression Ratio (CR) [24]. The CR achieved for lossless techniques are around 2:1 to 3:1. Spectral activity of test images is evaluated using DCT applied to the whole image. DCT coefficients as a result of DCT show frequency content of the image.
The distribution of DCT coefficients depends on image content (black dots represent DCT coefficients arrows indicate the increase of horizontal and vertical frequency). We can see that the X-Ray image has the lowest spectral activity compare to CT image with moderate spectral activity and ultrasound image with high spectral activity. From our observation, we realized that different modalities of medical image have different characteristics, i.e., noise, texture, intensity profile, etc. In other words, our test images are with different spatial and frequency characteristics. From the analysis on histogram of the image, we learn more about the dynamic range of each image (also each modality) as well as the type of image. Basically, the histogram of a digital image represents the discrete function of the number of gray level and the number of pixels in an image. The components of the histogram of the CT scan images are concentrated on the low (left) side of the gray scale. This is true since CT scan images are considered dark image. On the contrary, the components of the histogram for MRI images are biased toward the high (right) side of the gray scale because they are bright images. X-ray images cover a broad range of the gray scale compared to the other two modalities. This indicates that X-ray images are high in contrast.
F. Quality Measurements
Two of the quality measurements used to compare the various image compression techniques are the Mean Square
Error (MSE), Root Mean Squared Error (RMSE) and the Peak Signal to Noise Ratio (PSNR) are calculated using equ – (1),(2) and (3) by following formula respectively.The MSE is the cumulative squared error between the compressed and the original image, whereas PSNR is a measure of the peak error. The compression algorithm, when applied to medical images should not affect the visual quality and hence the diagnostic information. This is achieved in this method by considering the Peak Signal to Noise Ratio (PSNR) as the quality parameter for the compression. PSNR which relates Mean Square Error (MSE) to the maximum amplitude of the original image is calculated as given in (1), by comparing original image x(i,j) of size M × N pixels with reconstructed image xR (i,j) of size M × N pixels.
The mathematical formulae is
Error E = Original image – Reconstructe image
PSNR =20log 10 (255/√MSE) (1)
RMSE = √MSE (2)
MSE = 1/ M X N i j (x(i,j) - xR(i,j))2 (3)
In image compression, acceptable values of PSNR are in the range of 30 dB and 50 dB where higher is better [25]. The existing approaches is proved that while comparing reconstructed images with original image, a few visible differences could be noticed for PSNR above 30 dB [26]. The proposed system for yielding best visual quality images with PSNR equal to or greater than 36 dB, as there is no visual degradations in images reconstructed with PSNR greater than 36 dB [27]. A lower value for MSE means lesser error, and as seen from the inverse relation between the MSE and PSNR, this translates to a high value of PSNR. Logically, a higher value of PSNR is good because it means that the ratio of Signal to Noise is higher. Here, the signal is the original image, and the 'noise' is the error in reconstruction. So, a compression scheme having a lower MSE (and a high PSNR), can be recognized as a better one. Wavelet-based coding is more robust under transmission and decoding errors, and also facilitates progressive transmission of images.
III. PROPOSED METHODOLOGY
A. Level of Wavelet Decomposition
The DWT of the image is calculated by passing it through a series of digital filters are two types namely low pass filter and high pass filter. The wavelet transform decomposes the image into different frequency subbands. The low pass filter extracts crude information of the signal and the high pass filter extracts the detail information of the signal. The image is filtered along the row and decimated by two followed by filtering the sub-image along the column and decimated by two which results in four frequency subbands, namely LL, LH, HL and HH respectively. The proposed FMICT technique uses the approximation subband coefficients and detail subband coefficientsobtained in the one level decomposition of EDWT.
B. Fine Adaptive Subband Threshold
image. The threshold for selection of coefficients obtained in the first level of decomposition is computed based on the information content of the image for achieving compression without any observable loss of information. The threshold is determined by examining the number of occurrences of each coefficient as described below. The number of occurrences of each coefficient in subband is initialized to one. When a coefficient is read, the count of that particular coefficient is incremented. The coefficient with maximum count is identified and that coefficient is chosen as initial threshold value. The reason for choosing the coefficient which occurs more number of times is because it contributes more to the image. This process is applied independently on each subband. An each iteration, the procedure of threshold selection is applied on the left over coefficients of the corresponding subbands.
B. Proposed FMICT
The current processing of approximation subband LL, the threshold is determined by examining the occurrences of each coefficient in that particular subband. Initially the threshold is the most frequently occurring approximation coefficient, the contribution of which is high in the decomposed image. The approximation subband coefficients are selected by testing their significance by comparing with the determined threshold. Then the approximation subband coefficients that have a magnitude greater than or equal to the threshold are identified as significant coefficients. The same procedure is applied independently to identify the significant coefficients from the detail subbands LL, LH, HL and HH by comparing with the threshold, which is the coefficient with maximum occurrence in each of the detail subbands. LL, LH, HL and HH coefficients greater than or equal to their respective thresholds are significant coefficients. The remaining coefficients of the subbands are retained. This condition is elected to select the minimal and optimum number of coefficients to achieve compression. This procedure is adopted because the same threshold cannot be used for all the subbands as the information carried or represented by the wavelet coefficients in the subbands differ. As far as medical image is concerned, it is essential to extract the significant information in each of the subbands.
Now, it becomes essential to check whether optimum number of coefficients is selected so that image quality is retained. This is performed as follows. With the chosen significant coefficients by the above procedure, the pixel information is reconstructed by performing inverse Effective Discrete Wavelet Transform (EIDWT). Then PSNR is calculated by comparing original image with reconstructed pixel information. If PSNR is greater than or equal to 36 dB, then the procedure of selection of coefficients is stopped. If the condition is not arrived, the significant coefficients from the remaining coefficients of LL, LH, HL and HH subbands are identified by comparing with their next subsequent threshold i.e. the coefficient with number of occurences lower than the previous threshold and higher than all the remaining ones. The procedure is repeated until the condition of PSNR ≥ 46 dB is satisfied. Then the significant approximation and detail coefficients are arithmetic coded. In the proposed work, arithmetic coding is used as it provides better compression ratios than Huffman coding
The proposed new FMICT encoder showing the identification of the significant approximation and detail subband coefficients.The original image obtained is decomposed using Effective Discrete Wavelet Transform (EDWT) into approximation coefficient values (CV).The zero value significant coefficient matrices (SC and SC1) of original image size are considered as initial values. The Threshold (T) is the approximation coefficient with maximum frequency of occurrence.The current approach is applied separately to remaining detail subbands.After determining process the threshold T of each subband, compare Subband Coefficients Matrix (SCM) with their respective threshold T. The coefficients of CV which are greater than or equal to their subband threshold T are identified and padded to appropriate positions in Subband Coefficients Matrix (SCM1). The current approach is applied separately to remaining detail subbands to identify significant coefficients and moved to appropriate positions in SCM1. The remaining Coefficients Value less than threshold T are retained in CV matrix itself. Then SCM1 having SC of subbands is added to zero value matrixes SCM and the result is stored in SCM. SCM1 is cleared to all zeros. EIDWT is performed on SCM having significant coefficients to reconstruct the pixel information. Then PSNR is calculated by comparing the original image with reconstructed pixel information. If PSNR is equal to or greater than or equal to 36 deciBel (dB), the SCM is encoded to constructing the compressed image. The quality criterion evaluation is repeated, as the following above process.
Algorithm of Newly Proposed
Input: Read Original Image I=READ_IMAGE (file).
SCM and SCM1 initialized equal to image size. Decomposition from I into value of x and y. Calculate the CV.
To apply the SCV identification procedure. To construct I is cropped
CI=I(200:(CroppedSize[0]-1)+200)) CI constructed P*Q pixels P*Q=8*8
SCM selected coefficients from all subbands in high frequency. Find EIDWT to reconstruct the spatial pixel values.
Calculate PSNR by comparing original image with reconstructed pixel values.
If PSNR ≥ 46 dB,Go to go to next step to process the SC. Arithmetic encoded the significant wavelet coefficients and constructs the compressed bitstream.
Decode the compressed bit stream.
Perform EIDWT and reconstruct the original image.
© 2015-19, IJARCS All Rights Reserved 12
structural similarity which compares local patterns of pixel intensities, normalized for luminance and contrast. The MSSIM index an approach is better quality of the image. The newly proposed approach is compared with exiting method.
The X-Ray image is compressing newly proposed FMICT method with comparison of MICT, JPEG and
SPIHT and also the original X-Ray images are reconstructed using MICT, JPEG, SPIHT and the newly proposed FMICT. The visual quality of the reconstructed images obtained with the proposed FMICT is better compared to JPEG, MICT and SPIHT.
Original Image
Compressed Image
Reconstructed JPEG
Reconstructed SPHIT
Reconstructed MICT
Reconstructed FMICT
Figure 1: X-Ray Image Compression and Reconstruction
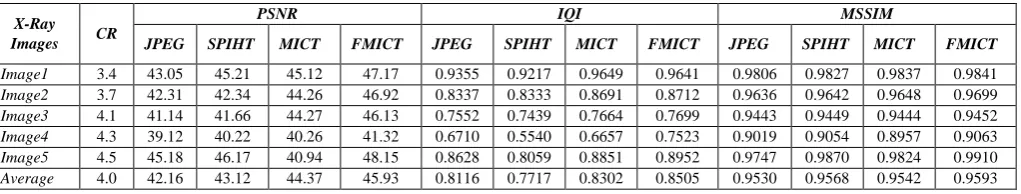
Table 1. X-Ray images Comparison of CR, PSNR, IQI and MSSIM of FMICT with JPEG, SPIHT and MICT
X-Ray Images CR
PSNR IQI MSSIM
JPEG SPIHT MICT FMICT JPEG SPIHT MICT FMICT JPEG SPIHT MICT FMICT
Image1 3.4 43.05 45.21 45.12 47.17 0.9355 0.9217 0.9649 0.9641 0.9806 0.9827 0.9837 0.9841 Image2 3.7 42.31 42.34 44.26 46.92 0.8337 0.8333 0.8691 0.8712 0.9636 0.9642 0.9648 0.9699 Image3 4.1 41.14 41.66 44.27 46.13 0.7552 0.7439 0.7664 0.7699 0.9443 0.9449 0.9444 0.9452 Image4 4.3 39.12 40.22 40.26 41.32 0.6710 0.5540 0.6657 0.7523 0.9019 0.9054 0.8957 0.9063 Image5 4.5 45.18 46.17 40.94 48.15 0.8628 0.8059 0.8851 0.8952 0.9747 0.9870 0.9824 0.9910 Average 4.0 42.16 43.12 44.37 45.93 0.8116 0.7717 0.8302 0.8505 0.9530 0.9568 0.9542 0.9593
The MRI image is compressing newly proposed FMICT method with comparison of MICT, JPEG and SPIHT and also the original MRI images are reconstructed using MICT, JPEG, SPIHT and the newly proposed FMICT. The visual quality of the reconstructed images obtained with the proposed FMICT is better compared to JPEG, MICT and SPIHT.
Original Image
Compressed Image
Reconstructed JPEG
Reconstructed SPHIT
Reconstructed MICT
Reconstructed FMICT
Figure 2. MRI Image Compression and Reconstruction
Table II. MRI images Comparison of CR, PSNR, IQI and MSSIM of FMICT with JPEG, SPIHT and MICT
MRI
Images CR
PSNR IQI MSSIM
JPEG SPIHT MICT FMICT JPEG SPIHT MICT FMICT JPEG SPIHT MICT FMICT
Image1 3.4 44.05 46.21 46.92 47.17 0.9455 0.9217 0.9649 0.9741 0.9806 0.9826 0.9837 0.9845 Image2 3.8 42.30 43.34 46.60 47.92 0.8331 0.8333 0.8690 0.8710 0.9636 0.9647 0.9648 0.9698 Image3 4.2 42.14 41.66 45.27 46.10 0.7550 0.7434 0.7964 0.7694 0.9446 0.9449 0.9443 0.9448 Image4 4.3 38.12 40.22 40.26 41.32 0.6710 0.5540 0.6657 0.7523 0.9019 0.9054 0.8957 0.9063 Image5 4.4 44.80 46.27 48.94 49.15 0.8626 0.8059 0.8805 0.8952 0.9741 0.9868 0.9824 0.9901 Average 4.0 42.82 43.54 45.59 46.33 0.8134 0.7716 0.8353 0.8524 0.9529 0.9568 0.9541 0.9591
V. Results and Discussion
The newly proposed FMICT algorithm has discussed for X-Ray, MRI, CT and US images of sizes 512 × 512 pixels with 8 bits per pixel. The medical images from various body organs like chest, abdomen, leg and head are considered. Different image formats like bmp, png and tif are used for testing and their PSNR, RMSE and MSE are compared. The newly proposed method has achieved greater
compression than that of existing method. The quality of reconstructed image is measured using parameters: PSNR, IQI and MSSIM. Table 1 and table 2 reveal that the measurement of PSNR, IQI and MSSIM for newly proposed method is acceptable.
clear that the proposed method gives better performance than MICT, JPEG and SPIHT in terms of PSNR for the same CR.
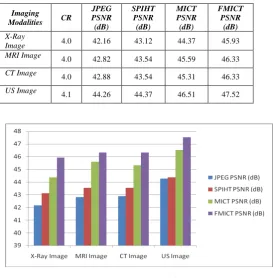
Calculate the average CR and PSNR comparison of FMICT with other compression algorithms for different imaging modalities.
Table III. Proposed Method CR
Imaging Modalities CR
JPEG PSNR (dB)
SPIHT PSNR (dB)
MICT PSNR (dB)
FMICT PSNR
(dB) X-Ray
Image 4.0 42.16 43.12 44.37 45.93
MRI Image 4.0 42.82 43.54 45.59 46.33
CT Image 4.0 42.88 43.54 45.31 46.33
US Image 4.1 44.26 44.37 46.51 47.52
Figure 3. Proposed Method CR
In graphical representation system is calculating the building CR, PSNR with JPEG, SPIHT, MICT and FMICT value of image compression comparison of existing with proposed system. In this existing system PSNR value is newly proposed algorithm is considerably reduced.
VI. CONCLUSION
The current FMICT algorithm is proposed in this article uses the threshold to detect the coefficients it has more influence on the image. The proposed algorithms differ in the method of identification of significant coefficients. The proposed algorithm works on one level wavelet decomposed image, threshold and coded with arithmetic coding. The newly proposed Compare to MICT, JPEG and SPIHT coding algorithm, the proposed FMICT algorithm yields better subjective quality images for the same CR. The performance is evaluated by testing images of various modalities. It has proved with the help of PSNR, IQI and MSSIM index that more information is conserved for the medical images compressed with the proposed FMICT than MICT, JPEG and SPIHT. The experimental comparison shows that the proposed FMICT algorithm has better performance than other compression standards.
VII. REFERENCES
[1] Gupta, N., Swamy, M. N. S., & Plotkin, E. (2005). Despeckling of medical ultrasound images using data and rate adaptive lossy compression. IEEE Trans. Med. Imaging, 24(6), 743-754.
[2] Sikora T. 2005 “Trends and perspectives in image and video Coding,” Proc. IEEE 93 (1) 6-17.
[3] Khalid Sayood 2006 Introduction to data compression Morgan Kaufmann Publications.
[4] Singla V. , Singla R. , Gupta S. 2008 “Data compression modeling: Huffman and Arithmetic,” International Journal of The Computer, The Internet and Management 16 (3) 64- 68.
[5] Jayant, N., Johnson, J. & Safranek, R. (1993). Signal Compression Based on Models of Human Perception. Proc.IEEE, 81, 1385–1422.
[6] Soman K. P & Ramachandran K. I. (2004). Insight into Wavelets from Theory to Practice. Prentice Hall of India, New Delhi.
[7] Dr. G.J. Joyce Mary, A. Ramachandran, “Quality Improvement in Color Image Compression Using New FDCT and FIDCT”, International Journal of Computer Applications, Vol.123, Issue. No.8, pp.12-17,Aug’2015. [8] Rehna V.J. , Jeya Kumar M.K. 2012 “Wavelet based image coding schemes: A recent survey,” International Journal on Soft Computing 3 (3).
[9] Dr. G.J. Joyce Mary, A. Ramachandran, “An Effective Analysis of Image Based Compression in Digital Image” International Journal of Innovative Research in Computer and Communication Engineering Vol. 4, Issue 3, March 2016 pp3563-70.
[10] Taubman D.S. 2000 “High performance scalable image compression with EBCOT,” IEEE Trans. Image Process. 9 (7) 1158 – 1170.
[11] Taubman D.S. Marcellin M.W. 2002 JPEG2000: Image compression fundamentals, standards and practice Kluwer Academic Publishers Boston, USA.
[12] Koff D.A. Shulman H. 2006 “An overview of digital compression of medical images: Can we use lossy image compression in Radiology,” Can. Assoc. Radiol. J. 57 (4) 211 – 217
[13] Sone S. , Takashima S. , Kiyono K. , Yang Z.G. , Hasegawa M. , Kawakami S. , Saito A. , Hanamura K. , Asakura K. 2001 “Effects of JPEG and wavelet compression of spiral low-dose CT images on detection of small lung cancers,” Acta Radiol. 42 (2) 156 – 160.
[14] Chen Y.Y. 2007 “Medical image compression using DCT-based subband decomposition and modified SPIHT data organization,” Int. J. Med. Informat. 76 (10) 717 – 725. [15] Choong M.K. , Logeswaran R. , Bister M. 2007 “Cost-effective handling of digital medical images in the telemedicine environment,” Int. J. Med. Informat. 26 (9) 646 – 654
[16] Persons K.R. , Palisson P.M. , Manduca A. , Charboneau W.J. , James E.M. , Charboneau N.T. , Hangiandreou N.J. , Erickson B.J. 2000 “Ultrasound gray scale image compression with JPEG and wavelet techniques,” J. Digit. Imag. 13(1) 25 - 32
[17] Li F. , Sone S. , Takashima S. , Kiyono K. , Yang Z.G. , Hasegawa M. , Kawakami S. , Saito A. , Hanamura K. , Asakura K. 2001 “Effects of JPEG and wavelet compression of spiral low-dose CT images on detection of small lung cancers,” Acta Radiol. 42 (2) 156 - 160
© 2015-19, IJARCS All Rights Reserved 14
[19] Tahoces P.G. , Varela J.R. , Lado M. J. , Souto M. 2008 “Image compression: Maxshift ROI encoding options in JPEG2000,” Comput. Vis. Image Understand. 109 139 – 145
[20] Dragan D. , Ivetic D. 2009 “A comprehensive quality evaluation system for PACS,” UBICC journal 4 (3) 642 – 650.
[21] Dr. G.J. Joyce Mary, A. Ramachandran, “Analysis of Digital Image Compression under Various Image Compression Techniques: A Survey”, IJAERT, ISSN No.:2348-8190, PP.448-454, Mar’2014.
[22] Birendra Kumar Patel, Prof. Suyash Agrawal, “Image Compression Techniques Using Artificial Neural Network”, International Journal of Advanced Research in Computer Engineering & Technology (IJARCET) Vol.2, Issue. No10, Oct’2013.
[23] Sudeep D.Thepade, Shwetali Erandole, “Extended Performance Comparison of Filing Based Image Compression Using Wavelet Transform And Hybrid
Wavelet Transforms”, Proc of 2013 IEEE Conf on Information and Communication Technologies, IEEE 2013. [24] Grgic, S., Grgic, M. L. & Zovko-Cihlar, B. (2001). Performance Analysis of Image Compression Using Wavelets. IEEE Trans, on industrial Electronics, 48(3), 682–695.
[25] Kafri N. , Sulieman H.Y. 2009 “Bit-4 of frequency domain-DCT stenography technique,” Proc. IEEE Int. Conf. on Networked Digital Technologies 286 – 291.
[26] Russakoff D.B. , Rohlfing T. , Mori K. , Rueckert D. , Ho A. , Adler J.R. , Maurer C.R. 2005 “Fast generation of digitally reconstructed radiographs using attenuation fields with application to 2D-3D image registration,” IEEE Trans. Med. Imag. 24 (11) 1441 – 1454.