Scholarship at UWindsor
Scholarship at UWindsor
Electronic Theses and Dissertations Theses, Dissertations, and Major Papers
1-1-1971
Turbulent, single-phase velocity distributions for parallel flow in
Turbulent, single-phase velocity distributions for parallel flow in
rod bundle assemblies.
rod bundle assemblies.
Joseph F. Martyniuk
University of Windsor
Follow this and additional works at: https://scholar.uwindsor.ca/etd
Recommended Citation Recommended Citation
Martyniuk, Joseph F., "Turbulent, single-phase velocity distributions for parallel flow in rod bundle assemblies." (1971). Electronic Theses and Dissertations. 6692.
https://scholar.uwindsor.ca/etd/6692
TURBULENT, SINGLE-PHASE VELOCITY
DISTRIBUTIONS FOR PARALLEL FLOW IN
ROD BUNDLE ASSEMBLIES
by
Joseph F. Martyniuk
A Thesi s
Submitted to the F acu lty o f Graduate Studies through the Department o f Chemical Engineering in P a rtia l F u lfillm e n t of
the Requirements fo r the Degree o f Master o f Applied Science a t the
U n iv e rs ity o f Windsor
Windsor, Ontario
INFORMATION TO USERS
The quality of this reproduction is dependent upon the quality of the copy submitted. Broken or indistinct print, colored or poor quality illustrations and photographs, print bleed-through, substandard margins, and improper alignment can adversely affect reproduction.
In the unlikely event that the author did not send a complete manuscript and there are missing pages, these will be noted. Also, if unauthorized copyright material had to be removed, a note will indicate the deletion.
®
UMI
UMI Microform EC53095 Copyright 2009 by ProQuest LLC.
All rights reserved. This microform edition is protected against unauthorized copying under Title 17, United States Code.
ProQuest LLC
789 E. Eisenhower Parkway PO Box 1346
A knowledge of the velocity distribution in nuclear reactor fuel
rod bundles is essential for the accurate prediction of critical heat
flux. In this study, a mathematical computer model was developed based
upon Deissler and Taylor's [1] work for axial flow between banks of rods
and tubes. Flow split predictions for a triangular-square array were
determined over a Reynolds number range of 2 x 10^ to 10"*, and at pitch/
rod diameter ratios from 1 to 2. Variations of shear stress and
cross-sectional average velocities with circumferential direction were also pre
dicted for an infinite triangular array. It was found that friction
factor and the variation of shear stress and cross-sectional average
velocities were in good agreement with earlier models. The mass flux
ratio for triangular/square subchannels increased with gap spacing and
was weakly dependent on Reynolds number. In conclusion, no satisfactory
mathematical model has yet been developed to predict flow and temperature
distributions in fuel rod clusters as all the previous mathematical
models ignored secondary flow effects.
ACKNOWLEDGEMENTS
The author wishes to express his g ra titu d e to Dr. C. C. S t. P ie rre
fo r his guidance and advice throughout the study.
Thanks are also due Mr. K. Singh and Mr. K. Petrunik who gave con
s tru c tiv e comments and c ritic is m s when confronted fo r advice. Special
thanks go to Mr. D. Candido fo r his many e f f o r t s , e s p e c ia lly the drawings
and graphical p lots appearing in th is th e s is .
The fin a n c ia l support provided by the National Research Council o f
P iS i
ABSTRACT i i i
ACKNOWLEDGEMENTS iv
TABLE OF CONTENTS V
LIST OF FIGURES v i i
LIST OF TABLES ix
I INTRODUCTION 1
I I LITERATURE SURVEY 5
A. D eissler and Taylor 5
B. Rapier and Redman 8
C. Bender and S w itick 10
D. N ijs in g , Gargantini and E if l e r 14
E. E if l e r and N ijs in g 17
F. Launder and Spalding 19
I I I PROGRAM DOCUMENTATION 21
A. Basic D e fin itio n s 21
B. Evaluation o f y+ 23
C. F ric tio n Factor C alcu latio n s 25
++ ++
D. Determination o f u , r , dp/dx 25
E. C alculatio n o f Sectional Areas (An) 26
F. C alcu latio n o f Wall Shear Stress (t ) 26
G. C alculatio n o f Maximum Dimensionless
Distance from Wall (ym+ ) 28
Page
H. C alcu latio n o f Maximum Dimensionless
-J.
V e lo c ity in each Sector (u^ ] 28
I . C alcu latio n o f Local V e lo c itie s (u) and
Distances from the Wall (y) 29
J . Subchannel Bulk V e lo c ity C alculatio n s 30
K. Conclusion o f Ite r a tio n Procedure 31
L. Determ ination o f Flow S p lit in a T ria n g u la
r-Square Array (Gt /G s ) 31
M. Output 31
IV RESULTS AND DISCUSSION 33
V CONCLUSIONS 47
NOMENCLATURE 48
REFERENCES 50
APPENDIX I : Program Input and Sample Output 53
APPENDIX I I : Flow S p lit P red ictio n Using F ric tio n 70
Factor C o rrelatio n s fo r Pipe Flow
VITA AUCTORIS
F ig u re
Page
1. Cross-section o f ty p ic a l rod bundle 2
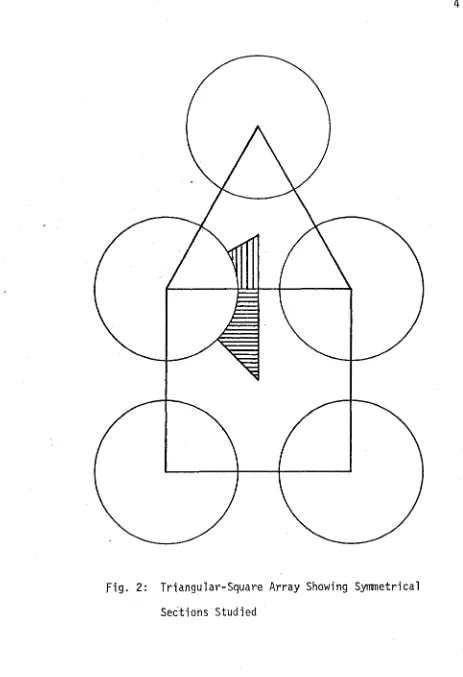
2. Triang ular-square arra y showing symmetrical sections
studied 4
3. Generalized v e lo c ity d is tr ib u tio n fo r a d ia b a tic
tu rb u le n t flo w . 7
4. Nodal representation o f Bender and S w itick 13
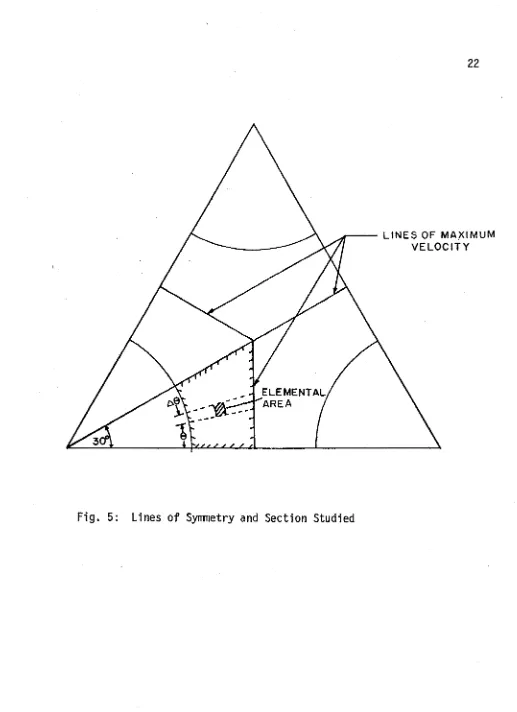
5. Lines o f symmetry and section studied 22
6. Generalized v e lo c ity d is tr ib u tio n fo r ad ia b a tic
tu rb u le n t flow 24
7. Determ ination o f areas in a tria n g u la r a rra y 27
8. Elemental area and determ ination o f cross-section al
average v e lo c ity 27
9. T ria n g u la r-a rra y Fanning f r ic t i o n fa c to r vs
Reynolds number 35
10. Square-array Fanning f r ic t io n fa c to r vs
Reynolds number 36
11. T ria n g u la r-a rra y Fanning f r ic t io n fa c to r vs
p itc h /ro d diameter r a tio 38
12. V a ria tio n o f shear stress w ith 0 39
F ig u re
Page
14. Comparison o f shear stress v a ria tio n w ith 0 44
15. Flow s p li t p red ictio n s fo r varying p itc h /ro d diameter
TABLE Page
I . Computer re s u lts a t various Re 3*f
I I . 1 Summary o f flow s p l i t p redictio ns using f r ic t io n fa c to r
I. INTRODUCTION
For reasons of nuclear-physical and technological nature, the
fuel element geometry in nuclear reactors often differs greatly from
simple geometries like the circular duct. A fuel element geometry
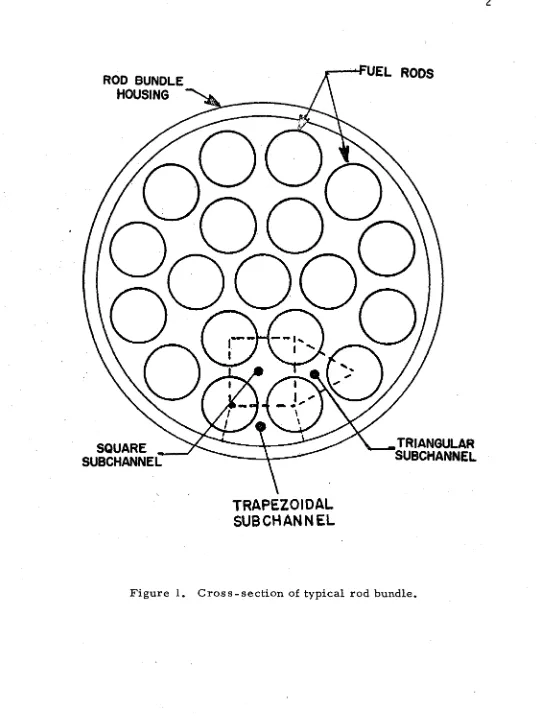
often used is the rod bundle (Fig. 1). It consists of a number of
parallel rods from which the heat generated by nuclear fission is re
moved by an axial flow of coolant. The design of such fuel elements
requires the solution of important problems pertaining to fluid flow
and heajt transfer. Only in some cases has reactor thermal analysis
quantitatively accounted for the mixing of coolant between the bundle
subchannels (Fig. 1).
For both heavy and light moderated water reactors the interest in
improved subchannel property definitions centers on the problem of
critical heat flux (CHF) predictions. Significant improvements in the
correlation of experimental CHF data from rod bundles should be possible
by considering the local coolant and heat flux conditions at the
ob-ser|j|d critical location rather than bundle averaged conditions. The
turbulent cooling flow in any subchannel mixes with that in neighbouring
channels on its journey through the core and transfers energy from the
hotter to the cooler subchannels thus affecting CHF predictions.
Ob-viously, improved definition mixing of parameters within and between
subchannels would provide an improvement in the prediction of fuel bundle
conditions. This relates to an increase in the net electrical output,
removal of heat for power generation purposes, and maintaining the tem
perature within tolerable limits. It thus becomes
1
f u e l r o d s
ROD BUNDLE
HOUSING
*
u
.TRIANGULAR
SUBCHANNEL
SQUARE „
SUBCHANNEL
TRAPEZOIDAL
SUBCHANNEL
obvious th a t a knowledge o f the v e lo c ity p r o file must be known before a
temperature p r o f ile may be estab lish ed .
The primary purpose o f th is study was to t h e o r e tic a lly p re d ic t the
natural flo w s p lits in various tria n g u la r-s q u a re arrays in rod bundles
(F ig . 2 ) ; th a t is determining the r a tio o f the mass flu x in a t r i
angular array to the mass flu x in a square arra y as a function o f the
Reynolds number ( Re) w ith a r a tio o f p itch to rod diameter (p /d ) as a
4 4 5
parameter. Reynolds numbers o f 2 x 10 , 5 x 10 and 10 were studied
over a p/d range o f 1 . 0 0 to 2 . 0 0 which corresponded to a gap width range
o f 0.000" to 0.750". Theo retical p redictio ns o f f r ic t i o n fa c to r , local
and cross-sectional average v e lo c it ie s , and the v e lo c ity and shear stress
v a ria tio n in the c irc u m fe re n tia l d ire c tio n were also studied . This re p o rt
H LITERATURE SURVEY
A DEISSLER AND TAYLOR [1 ]
D e is sle r and Taylor [ 1 ] have in vestig ated a x ia l flow between rods
or tubes as configuration s which may have been advantageous fo r remov
ing heat from nuclear re a c to rs . A basic assumption was th a t expressions
for fully developed velocity and temperature profiles in circular
tubes apply along lines normal to a wall. Further assumptions were:
1) constant f lu id prop erties
2) equal eddy d i f f u s i v i t ie s fo r momentum and heat
3) along lin e s normal to a w a ll, the v a ria tio n o f the
shear stress and heat tra n s fe r per u n it area have a
n e g lig ib le e f f e c t on the v e lo c ity and temperature
d is trib u tio n s
4) in the region away from the w a ll, molecular d i f f u s iv it ie s
are n e g lig ib le in comparison to the eddy v is c o s ity and
eddy c o n d u c tiv ity .
D e is s le r's [ 2 ] universal v e lo c ity d is tr ib u tio n curve fo r smooth
c ir c u la r tubes was used to c a lc u la te the v e lo c ity d is tr ib u tio n in each
sector o f the flow area. An it e r a t iv e procedure was used as v e lo c ity
grad ien t lin e s were unknown a t the o u tset. F i r s t ly , lin e s o f maximum
v e lo c ity and assumed v e lo c ity grad ien t lin e s were drawn. Using these
assumed v e lo c ity gradient lin e s , lin e s o f constant v e lo c ity were c a l
c u lated . Then a more accurate set of v e lo c ity g rad ien t lin e s was drawn
normal to the constant v e lo c ity lin e s . This procedure was repeated u n til
In order to c a lc u la te these constant v e lo c ity lin e s , the fo llo w in g
v e lo c ity parameters were defined:
u = ^ t 3/p ( 2 . 1 )
u+ = u /u * ( 2 . 2 )
u = u/ /-rg(dp/dx)/p
(2 .3 )
4*4*
where u was preferred fo r useage in c a lc u la tin g lin e s o f constant
-J*
v e lo c ity because the shear stress in the d e fin itio n o f u va ries w ith
p o s itio n .
++
A tube radius parameter r was defined as
r = /-rg(dp/dx)/p r /v ( 2 . 4 )
which is a kind o f Re.
The dimensionless distance from the wall
y+ = u* y /v (2 .5 )
was s u bstitu ted w ith ®d. 2 .4 in to eq. 2 .3 to give
u++
= u+ j r ym+ ( 2 . 6 )+ + —
r y
where r was the radius o f the rod
r ++ was assigned an a r b itr a r y value
y was the maximum distance from the w all and was calculated m
dependent on the geometry o f the subchannel a rra y .
Note th a t u+ and y+ were re la te d through D e is s le r's generalized v e lo c ity
d is tr ib u tio n fo r a d ia b a tic tu rb u le n t flow ( F ig .3 ).
7
in in
o
o
o
o
o
ID
OJ
3 >> II h
>>
OJ OJ
CO
CD
n/n = n
* +
G
e
ne
ra
liz
e
d
V
e
lo
c
it
y
D
is
tr
ib
u
ti
o
n
fo
r
A
d
ia
b
a
tic
Tu
rbu
len
t
T0 = - AA d£ (2 .7 ) Ai ax
where tq was the shear force acting on an arc length (a&) and (dp/dx) was the pressure grad ient acting over the faces o f the element. There
were no shear forces acting on the v e lo c ity gradient lin e s because the
normal v e lo c ity d e riv a tiv e s were zero along these lin e s .
S u b stitu tio n o f eg* 2.7 in to 2 .5 gave
ym+ =
AA/r
(A£) ym r ++/ r (2 .8 )By specifying r ++ and considering a given lin e normal to the su rface,
the value o f y/ym fo r a given u++ was calcu lated by using eqs 2 . 8 , 2 . 6
and D e is s le r's universal v e lo c ity p r o f ile in th a t order. The same c a l
c u la tio n a t constant u++ was c a rrie d out fo r various lin e s normal to
the surface and lin e s o f constant v e lo c ity (constant u++) were obtained.
New and more accurate v e lo c ity grad ien t lin e s were drawn and the tech
nique was repeated u n til the v e lo c ity and grad ient lin e s converged.
D e is sle r and Taylor [1 ] determined v e lo c ity d is trib u tio n s fo r both
tria n g u la r and square a rra y subchannels a t p/d r a tio s o f 1 . 0 , 1 . 0 2 , 1 . 1 ,
and 2 . 0 , and found th a t the v e lo c ity lin e s near the center o f the pass
age form closed lin e s about the po int o f maximum v e lo c ity , whereas those
close to the wall formed closed lin e s around the tubes.
B RAPIER AND REDMAN [31
A refinem ent to D eis sle r and T a y lo r's [1 ] method fo r c a lc u la tin g
v e lo c ity d is trib u tio n s in rod c lu s te r flow was made by Rapier and Redman
[ 3 ] . T h eir method was n o n -ite r a tiv e , a p p licab le to both rough and smooth
passages, and used a modified universal v e lo c ity p r o f ile which did not
9
The basic assumptions used were:
7) constant physical prop erties
2) A0 (angle o f increm ent) approached zero in the l i m i t
A
3) y was the average distance from the w all to the surface
o f no shear
4) pressure forces acted on a surface area estimated by the
d iffe re n c e between two sectors
5) the v e lo c ity p r o f ile fo r c ir c u la r pipes and between
p a r a lle l planes was used fo r n o n -c irc u la r passages
Since th e ir o rig in a l force balance on a element included shear
stress in the c irc u m fe re n tia l d ir e c tio n , fu rth e r s im p lify in g assumptions
were made:
6) the momentum d i f f u s i v i t y (and also the shear s tre s s ) in the
c irc u m fe re n tia l d ire c tio n was independent o f r . Rapier [4 ]
approximated e as
dropped, thus in cu rrin g a 12.5% e rro r in c a lc u la tio n s .
This assumption was made in conjunction w ith the former to
c a lc u la te a t 1 in the c irc u m fe re n tia l d ire c tio n independent
o f r .
The shear stress equation to be solved reduced to
(2 .9 ) e = u y/ 1 0
7 ) since u+ = 20, a constant value o f 2 .5 added to u+ was
U = 2Y (1 + Y) + | r : }
(
2.
1 0)
1 + Y 5 3G
where U = t q / r ( d p / d x ) ii r , + \ 2 or U = (u /u )
(2.11)
which is D eissler and T a y lo r's [ 1 ] term inology, and Y = y /d (2 .1 3 )
This equation fo r U was num erically solved by computer fo r both a t r i
angular and square arra y a t p/d ra tio s o f 1 .0 0 , 1 .0 5 , 1 .1 2 5 , 1.250 and
1.5 0 . T h e ir re s u lts a t a constant u+ o f 10,20 and 30 compared favour
ably with those o f D eissler and Taylor [1 ] and the shear stress d is
tr ib u tio n changed very l i t t l e w ith tube roughness.
Rapier and Redman fu rth e r proceeded to develop a v e lo c ity d is t r ib u
tio n based on a d if f u s i v i t y p r o f ile consistent w ith the universal v e lo c ity
A
p r o file up to y = y/ 2 and w ith non-zero d i f f u s iv it y a t a surface o f no
shear. Assuming a lin e a r v a ria tio n in shear stress fo r c lu s te r passages:
1iGa) *
t/ t q = 1 - y /y (2 .1 4 )
they proceeded to derive v e lo c ity p r o file s fo r two regions o f flow
o < y < y /2 (2 .1 5 )
and y/ 2 < y < y (2 .1 6 )
T h e ir re s u lts showed th a t agreement between experimental and th e o re tic a l
v e lo c ity d is trib u tio n s was f a i r l y good [ 1 , 4 , 5 ] .
C BENDER AND SWITICK T6l
Bender and S w itick [ 6] presented a model fo r determining the
two-dimensional v e lo c ity d is tr ib u tio n fo r tu rb u le n t, constant p ro p erty,
sin g le phase flow through an i n f i n i t e tria n g u la r rod bundle. The tim
e-average tu rb u le n t momentum equation was in teg rated on a nodal basis by
developing expressions fo r hydraulic resistance between nodes due to a
change in v e lo c ity caused by the molecular and eddy v is c o s itie s .
Eddy d i f f u s iv it ie s were defined in terms o f the lo cal v e lo c ity
-duced the c a p a b ility o f describing tu rb u le n t momentum tra n s fe r in both
the ra d ia l and circum ferential directions a t each po int in the flo w f i e l d .
By balancing pressure forces w ith viscous forces on each node, a set of
lin e a r , simultaneous alg eb raic equations resu lted fo r the v e lo c ity .
The follo w in g assumptions were made
1) constant physical pro p erties
2) f u l l y developed, sing le-phase, s te a d y -s ta te ,
tu rb u le n t flow '
3) no momentum flu x across the boundaries o f the channel
4) temperature d i f f e r e n t ia ls in the coolant cross-section
were not severe, so th a t m a terial p ro p erties could be
evaluated a t the bulk f lu id temperature and considered
constant across the flow cro ss-section .
Applying the c o n tin u ity equation and reducing the momentum equations,
the governing flow equation became the z-component o f the momentum
equation:
where u ( r ,e ) = uz ( r , e )
In th is equation,Emr and £m0 were the eddy d if f u s i v i t i e s o f momentum
in the ra d ia l and c irc u m fere n tia l d ire c tio n s re s p e c tiv e ly and were defined
by the shear stress and v e lo c ity gradients in the coolant: p
U + ( v + e ) 3U
- r r v mr'
T = _£. ( v + e ) — (2 .1 8 )
r g mrJ 9r
_ p / * \ 9 U
t q - ( v + e m Q ) — C 2 i l 9 )
g r 30
N ext, an a r b itr a r y segment o f f lu id was considered a t some point
in the flo w f ie l d to give the force per u n it length a t the face a t r as
F = (rA 0 )x r (2 .2 0 )
S u b stitu tin g eq. 2.18 in to 2 .2 0 , rearranging and in te g ra tin g , gave
A u
p/g m{>2 / r p/ *Q<v + Emr)
(2
.
21)which i s analogous in c i r c u i t th e o ry to
I = E/R (2 .2 2 )
where au = a p o t e n t ia l f l u x
^ = a r e s u l t in g f l u x p/g
and the hydraulic resistance is
l n ( r 0/ r \ )
R -2, (2 .2 3 )
40 (v + cm r )
The same analysis was used in obtaining a hydraulic resistance to a c i r
cum ferential change in v e lo c ity as
R = ..AQ- .(r.)--- ( 2. 24 )
A r ( v + emQ)
A nodal admittance (Y) was defined as the recip ro cal o f the re sista n c e .
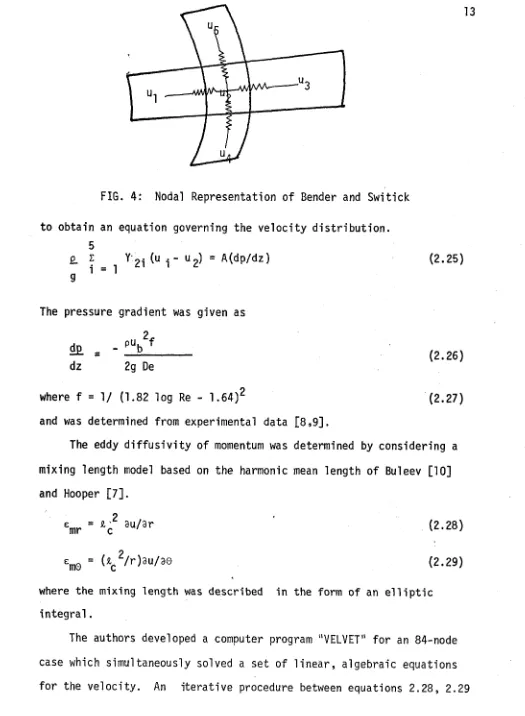
A force balance on the center node with fo ur adjacent nodes (F ig . 4)
13
FIG. 4: Nodal Representation o f Bender and S w itick
to obtain an equation governing the v e lo c ity d is tr ib u tio n .
5
£_ I Y ?i (u , - u ?) = A (dp/dz)
g i - i
(2 .2 5 )
The pressure gradient was given as
d£ . - PUb2 f
(2 -2 6 )
(2 .2 7 )
dz 2g De
where f = 1 / (1.82 log Re - 1.64)^
and was determined from experimental data [ 8 , 9] .
The eddy d i f f u s iv it y o f momentum was determined by considering a
mixing length model based on the harmonic mean length o f Buleev [1 0 ]
and Hooper [ 7 ] .
emr ’ *-c 3u/3r
/ r ) 3 u / 3 0
(2 .2 8 )
(2 .2 9 ) "me ' c
where the mixing length was described in the form o f an e l l i p t i c
in te g r a l.
The authors developed a computer program "VELVET" fo r an 84-node
case which simultaneously solved a set o f lin e a r , alg eb raic equations
and 2.25 was continued u n til the eddy e f fe c t and the v e lo c ity p r o f ile
converged to w ith in a desired l i m i t .
Comparison o f t h e ir re s u lts w ith experimental data [3 ,1 1 ] in dicated
th a t the model overpredicted the c irc u m fe re n tia l v a ria tio n in v e lo c ity ,
suggesting th a t too low a value o f peripheral d i f f u s iv it y was used.
D NIJSING, GARGANTINI AND EIFLER [1 2 ]
N ijs in g , Gargantini and E if l e r [1 2 ] presented a th e o re tic a l
t r e a tis e to evaluate the d is tr ib u tio n o f lo cal coolant v e lo c ity , shear
stress and temperature in a tria n g u la r arra y o f p a r a lle l heat generating
rods. T h eir analysis was s im ila r to th a t o f D eis sle r and Taylor [1 ]
but n o n -ite ra tiv e and included the tu rb u le n t d iffu s io n o f momentum and
heat tra n s fe r around the rod periphery. The assumptions made were:
1) constant physical p ro p erties
2) f u l l y developed flow conditions
3) incompressible f lu id
4 ) Prandtl number g re a te r than u n ity
5) m olecular and eddy d i f f u s i v i t y were a d d itiv e
The momentum equation in c y lin d r ic a l co-ordinates became:
1 = ( v + j A + ( — I f r P ) M + ( U L f e r j A (2>30)
p ar^ r 3r r^ 30^
The s o lu tio n o f the energy equation required a knowledge o f the
f lu id v e lo c ity d is tr ib u tio n which must be found from the momentum
equation. Since no exact s o lu tio n was known from eq. 2 .3 0 when e was
a function or r and 0 , the authors looked fo r an approximate s o lu tio n .
The f i r s t two terms o f eq. 2.30 accounted fo r tra n s fe r o f momentum
distance away from the wall and soon became gre a ter than molecular
d i f f u s i v i t i e s . Consequently the ra te o f ra d ia l heat tra n s fe r was
m ainly determined by conditions in the immediate v ic in i t y o f the rod
surface.
The th ird term accounted fo r the tra n s fe r o f momentum around the
rod periphery. In the central p a rt o f the flo w , m olecular d if f u s iv it ie s
can be disregarded in comparison w ith the corresponding eddy d i f f u s i v i
t ie s . The ra te o f peripheral tra n s fe r then became a fun ctio n o f the
distance from the rod surface ( y ) . Since the ra d ia l v e lo c ity v a ria tio n
is decreased by periph eral momentum tra n s p o rt, a sin g le o v e ra ll e f f e c t
ive eddy d if f u s i v i t y % was assumed. T h eir an alysis employed a non
isotropic nodel which allowed fo r periph eral and ra d ia l tra n s fe r o f momen
turn. The fo llo w in g assumptions were added:
6) the flow was f u l l y tu rb u le n t a t a l l peripheral
positions around the rod.
7) only the mean flow p ro p erties were considered in an
element dA by employing a lo cal v e lo c ity u^ Q
8) the process o f peripheral tu rb u le n t momentum d iffu s io n
was described in terms o f a sin g le distance parameter.
A momentum balance on the element dA and a lo cal eq u ivalen t hydraul
ic diameter defined as
4 dA
(2 .3 1 ) ye =
-r do
gave the expression fo r the lo cal shear stress TQas:
(2 .3 2 )
terms o f local flow and geometry parameters.
Based on E ld e r's [1 3 ] work, the o v e ra ll e ffe c tiv e d i f f u s i v it y fo r
periph eral momentum tra n s fe r was re la te d to the lo cal Re as
Assuming also th a t the local shear stress was re la te d to the lo cal
mean v e lo c ity by the B la s iu s 1 equation
Equation 2 .3 6 , being an in te g r o -d iffe r e n tia l equatio n, was numer
ic a ll y solved to provide the dimensionless v e lo c ity (n) and the periph eral
shear stress ( t 0/ t q av) d is tr ib u tio n s . Th eir re s u lts in dicated th a t the
periph eral momentum tra n s fe r diminished the v a ria tio n in shear stress and
v e lo c ity . A comparison with D eissler and T a y lo r's [ 1 ] re s u lts gave f a i r
agreement fo r an assumption o f zero peripheral momentum tr a n s fe r.
D eissler and Taylor [1 ] found n higher near 0= 0 and lower near 0 = n/6.
Eg/v = 0.0115n(ye/De)Re7 /8 (2 .3 3 )
(2 .3 4 ) where n = ua J u
(2 .3 5 )
gave:
(De/ye) - ( y e /D e ) ( 6/n ) 1' 7 5 (D e/ye)O ,25d0
= 0.287 Re°*1 25(D e/p r) d ^m ^ dr. (2 .3 6 )
de De r d0
subject to the boundary conditions
dn
— = O at the gap and 6 = tt/6 (2 .3 7 )
For decreased rod spacing, the peripheral v e lo c ity v a ria tio n
increased but the momentum tra n s fe r became r e la t iv e ly less im portant.
The in fluence o f Re on the peripheral v e lo c ity d is tr ib u tio n was com
p a ra tiv e ly small due to the fa c t th a t a l l three momentum tra n s fe r terms
increased p ro p o rtio n a lly w ith the periph eral momentum tra n s fe r s lig h t ly
dominant.
E EIFLER AND WIJSING [1 4 ]
This work was based on E i f l e r 's [1 5 ] e a r l ie r work on concentric .
annul i and extended the in v e s tig a tio n o f N ijs in g , G argantini and E if l e r
[ 12] so th a t the secondary e ffe c ts were included in terms o f an increased
c irc u m fe re n tia l eddy d i f f u s iv it y re la te d to th a t in the ra d ia l d ire c tio n .
A lo cal law fo r xQwas formulated in which t q was dependent on ra d ia l co
ordinates so th a t:
The an isotro p ic fa c to r was assumed to be independent o f p o s itio n .
The ra d ia l components o f e and u from an inner concentric annuli
an alysis [1 5 ] were su b stitu ted in to eq. 2.39 assuming th a t the c i r
cum ferential momentum tran sp o rt had a n e g lig ib le e ff e c t on the ra d ia l
components. Equations fo r er and u as a function o f xr and K (a local
geometry parameter which was a function o f 0 ) were s ub stitu ted in to
2.39 and w ith the w all shear stress known, then t q was also known. An o rdinary second order d i f f e r e n t ia l equation o f the form
(2 .3 8 )
where n was an a n iso tro p ic fa c to r. Then
T
0
nper 3u (2 .3 9 )
r 30
L = 0 (— ,x , 0 )
d0 r
was then solved w ith the boundary c o n d itio n s :
a t 0 = o , t q = o
( 2 . 4 1 )
0 = A9 ; T q — o (2 .4 2 )
where A0 was the c i r c u m f e r e n t i a l l y symmetrical known angle f o r the rod
c l u s t e r ; i . e . ,
AO = n /6 f o r a t r i a n g u l a r a r r a y ,
A0 = n /4 f o r a square a r r a y
and w ith physical c o m p a t i b i l i t y c o n d itio n s :
a t 0 = o or A0 , ^ r = o (2 .4 3 )
Equations 2 .4 3 , 2.44 and 2.45 implied th a t the momentum flo w must
be zero normal to the lin e o f constant v e lo c ity and along lin e s of
symmetry, and th a t the average ra d ia l momentum flow on the wetted wall
equalled the a x ia l momentum flow defined by the pressure g ra d ie n t.
Equation 2.40 was solved num erically by the Runge-Kutta-Nijstrom
method to determine the v e lo c ity f i e l d . By comparing t h e ir th e o re tic a l
so lu tio n to experimental data [1 5 ] fo r a p/d ra tio , o f 1.08 and various
Re, i t was concluded th a t n should be equal to 10 and be independent o f
Re fo r a tria n g u la r a rra y . The wall shear stress and v e lo c ity v a ria
tio n in the c irc u m fe re n tia l d ire c tio n was g re a ter fo r the rectangular
array compared to the tria n g u la r a rra y and the d iffe re n c e increased as
p/d increased. They concluded th a t more experimental work was needed (2 .4 4 )
to v e r if y th a t n was indeed an a n tis tro p ic fa c to r.
F LAUNDER AND SPALDING [16]
Launder and Spalding [1 6 ] ch ro n o lo g ic ally reviewed various t u r
bulence models as they re la te d to the p re d ic tio n o f in te rn a l flow s.
The models were assessed from an engineer's point o f view to give the
turbulence model o f s u f f ic ie n t accuracy o f p re d ic tio n w ith the minimum
o f computational expense. Viewed from th e ir stan d po in t, the fo llo w in g
were the most important featu res a t the tim e:
1) "For a large number o f boundary layers where the turbulence
s tru c tu re changes slow ly in the d ire c tio n o f flow (in clu d in g flows in
j e t s , wakes, d iffu s io n flames and non-separated flows in pipes and
channels), a version o f the Prandtl mixing length model is most to be
recommended. The necessary em pirical constants w i ll be v a lid only fo r
a r e s tr ic te d class o f phenomena; but an engineer who is concerned w ith
a lim ite d range o f problems can endure th is r e s tr ic tio n w ith complacence;
2) For boundary la y e r flows where the boundary conditions enforce
rapid streamwise v a ria tio n s o f the turbulence p ro p erties and fo r almost
a l l separated flo w s , i t seems to be necessary to employ a model in which
a t le a s t two d if f e r e n t ia l equations are solved fo r prop erties o f the t u r
bulence; fo r convection and d iffu s io n o f turbulence energy are u su ally
s ig n ific a n t fo r such flow s; and the geometries are too various fo r the
length scale to be obtainable from g e n e ra lly - v a lid alg eb raic formulae.
A ll the two equation models employ the Boussinesq formula fo r e v a lu a t
ing the shear stresses.
T ~ "ye f f — ( 2 - 46)
3) There are some flows o f engineering importance fo r which the
Boussinesq formula is inadequate. For example, "the p re d ic tio n of
v e lo c ity d is tr ib u tio n fo r p a r a lle l flow on rod bundle geometry . . . " I f
these flows are to be computed r e a l i s t i c a l l y , a three equation model
must be employed. The v a riab le s might well be the turbulence energy,
the e nerg y-d issip atio n r a te , and the shear stress i t s e l f .
4) As two- and three equation models become re fin e d through
extensive t r i a l and development, the need fo r models having gre a ter
numbers o f equations w ill become apparent, demonstrated by the incom
p le te u n iv e r s a lity o f the simple models. However, th is s itu a tio n has
not y e t a rriv e d ; a t present, none o f the more complex models has been
developed to the point a t which i t is superior in performance to the
I l l PROGRAM DOCUMENTATION
Before the energy equation could be solved to give a temperature
p r o f ile in any subchannel a rra y , the v e lo c ity p r o f ile had to be d e te r
mined. To c a lc u la te the v e lo c ity d is tr ib u tio n in banks o f rods or tubes
under the conditions o f a x ia l, tu rb u le n t flo w , a modified version o f
D e is s le r and T a y lo r's [ 1 ] model was adopted to a computer s o lu tio n . The
it e r a t iv e procedure which was developed in a computer program LOOP
(Appendix I ) to solve the equations o f change is documented here. An
i n f i n i t e tria n g u la r arra y o f smooth rods was i n i t i a l l y analyzed. Due
to symmetry, only a 30° increment had to be considered and th is sector
was divided in to t h i r t y - 1° sections from the gap to the lin e o f
symmetry a t e = 30° ( F ig .5 ) . For an i n f in i t e square a rra y o f fu e l rods,
a 45° increment was analyzed. The gap width and Re were allowed to
v a ry , and the program was w ritte n so th a t any physical p ro p erties may
be va ried .
A BASIC DEFINITIONS
The p itch to rod diameter r a tio is the distance between rod centers
The equivalent diameter is defined as fou r times the flow area over
the wetted perim eter. For a tria n g u la r array
p/d = 1 + b /2 r ( 3 .1 )
De = 2r f t O L - (p /d )2 - 1] (3 .2 )
n
and fo r a square arra y
De = 2r [ — Cp/d}2 - 1] (3 .3 )
L IN E S OF M A X IM U M V E L O C IT Y
E L E M E N T A L A R E A
23
The to ta l area under consideration fo r a tr ia n g u la r arra y is
At = 0 / 1 2 ) l 4 r 2 Cp/d)2 sin(2nX) - n r2] (3 .4 )
where n = 30
X = ne/180 to convert degrees to radians (3 .5 )
For the square array
As - i-2[ ( p / d ) 2/2 - n /8 ] (3 .6 )
The arc length is given by
Ai, = rX (3 .7 )
Other basic dimensionless v a riab le s are the dimensionless v e lo c ity
u+ = u /u * = u / A Qg/p (3 .8 )
and the dimensionless distance from the wall
y+ = u *y /v (3 .9 )
B EVALUATION OF y *
From the universal v e lo c ity p r o f ile [2 ] ( F ig .6) i t is evident th a t
"f* 4* 4*
fo r y > 26, a s tra ig h t lin e re la tio n s h ip e x is ts between u and y . For
. +
any given u
y+ = e x p [0.36(u + - 3 .8 ) ] (3 .1 0 )
However, fo r y+ < 26 the fo llo w in g equation is used:
0.109u+
+ 2 +
exp(-0.0059 u ) du_______ (3 11)
+2 exp(-0 .0 0 5 9 u )
Equation 3.11 was developed by D eis sle r [1 7 ] and the in te g ra l is
o
O 'o
o
o
3 >>
<3
CVJ
io
cn
CVJ CVJ
n/n
Ge
ne
ra
liz
e
d
V
e
lo
c
it
y
D
is
tr
ib
u
ti
o
n
fo
r
A
d
ia
b
a
tic
Tu
rb
u
le
n
t
Fl
C FRICTION FACTOR CALCULATIONS
To s t a r t the it e r a t io n , a Fanning f r ic t io n fa c to r ( f ) was req uired.
This was calcu lated by assuming a Re and using the Colebrook equation
] _ = - 4 log + L 2 6 ) 5 Re > 2000 (3 .1 2 )
^ 3,7 R e / T
f = 16/Re Re < 2000 (3 .1 3 )
From Knudsen & Katz [1 8 ]
' - De (-g dp/dx) (3 .1 4 )
^pUb ,av
D DETERMINATION OF u++, r ++, dp/dx
I f a dimensionless v e lo c ity parameter is defined as:
u “ u /,/-rg (dp/dx )/p (3 .1 5 )
then, by using eq. 3 .1 4 , the dimensionless cro ss-section al average
v e lo c ity is
ub,av = 1/,72 f(r /D e ) ^3 ' 16^
A dimensionless Re is defined as
++
/-r = /
rg (d p /d x) / p r /v (3 .1 7 )
per unit length may be written:
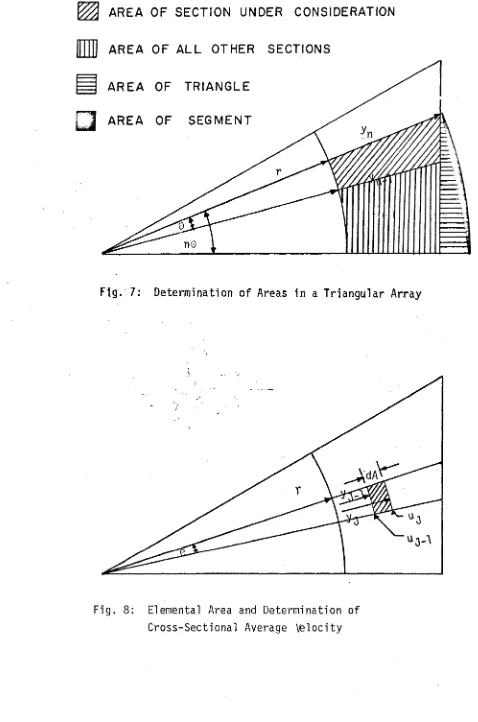
E CALCULATION OF SECTIONAL AREAS (A )
The elemental areas comprising the to ta l subchannel flow area were
found as in Fig. 7:
A = area o f large sector ( r + ymax) area o f rod sector ( r )
-area o f segment - -area o f tr ia n g le - I other calcu lated areas
where n = number o f angle increments
0 = angle increment
F CALCULATION OF WALL SHEAR STRESS (tq )
The forces on an element (F ig .8 ) in the flow are the shear force
acting on an arc length (aji) and the pressure forces actin g on the faces
o f the element. There are no shear forces acting on the v e lo c ity grad
ie n t lin e s (assumed to be the ra d ia l lin e s as a f i r s t assumption) because
the normal v e lo c ity d e riv a tiv e s are zero along these 1in e s .W ritin g a force
balance on the element gives
The r a tio o f shear stress to average shear stress is e a s ily c a l
culated from
(.3*19)
dx rg r
(3 .2 0 )
360
T
27
^ A R E A OF S E C T I O N U N D E R C ONSI DERATI ON
A R E A O F A L L O T H E R S E C T I O N S
A R E A OF T R I A N G L E
A R E A OF S E G M E N T
F ig. 7: Determ ination o f Areas in a T ria n g u la r Array
F ig . 8: Elemental Area and Determ ination of
To _ AA A _ „ aA
t AA At At ^3 - 22)
0 3 V t t
6 CALCULATION OF MAXIMUM- DIMENSIONLESS DISTANCE FROM MALL (.ym* )
In order to c a lc u la te the maximum dimensionless distance from the
w all (ym+ ) ,e q s . 3.19 and 3.21 were s u bstitu ted in to eq . 3 .9 to give
ym " ^ 1 aA r ^ (3 .2 3 )
ym
r aa r
A lso, by trigonom etry
ym = r(l-c o s n e + b /2 ) (3 24)
cos rB
The average dimensionless distance from the wall was found by
averaging two adjacent distances:
1 , e , » ym £V tyn ,n + ym ,n - l ) / 2 (3 .2 5 )
+ / + +
, = (ym „ I I I j I I " I J / C * i
+ ,
H CALCULATION OF MAXIMUM DIMENSIONLESS VELOCITY IN EACH SECTOR (u )
To c a lc u la te the maximum dimensionless v e lo c ity in any one s e c to r,
i t was only necessary to reverse equations 3.10 and 3 .1 1 . This was re
la t iv e ly simple fo re q . 3 .1 0 :
um+ = 2 .7 8 ln y m+ + 3 .8 fo r y * > 26 (3 .2 6 )
29
dy+ +
fo r y < 26 (3 .2 7 )
o 1 + n 2 u+y+£ l-e x p (-n 2u+y+ ^}
where n = 0 .1 2 4
To solve eq. 3 .2 7 , two subroutines SIMPU and SIMPL, which in co r
porated t h e N e w t o n - R a p h s o n technique, were w r itte n . I f we set the
expression a f t e r the in te g ra l sign in eq.3*27 equal to f ( u + ) so th a t
f ( u + ) = --- (3 .2 8 )
1 + n2u+y +[ l - e x p (- n 2u+y + ) ]
then the Newton-Raphson procedure f o r an i n i t i a l u j is
f ( u + ) (3 .3 0 )
u+ = u t - f ( u + ) / f (u+ ) ^ + (3 .2 9 )
where f (u+ ) = - f ( u + ) = 1 - —
+
3U 3U /
/ °
which was solved employing the L ie b n itz formula.
I CALCULATION OF LOCAL VELOCITIES (u) AND DISTANCES FROM THE WALL (y)
The lo cal v e lo c ity as a fun ctio n o f the distance from the w all was
found from equations 3 .8 and 3 .9 as
+ * (3 .3 1 )
u = u u J
y = y+v /u * (3 .3 2 )
Since lin e s o f constant v e lo c ity are to be c a lc u la te d , a v e lo c ity
values o f u and y are found fo r every p o sitio n J a t which a v e lo c ity
has been c a lc u la te d . This procedure is repeated fo r every section and
lin e s o f constant v e lo c ity may be found by comparing output in each o f
the sections.
■1 siirchannel bulk v e l o c i t y c al cu l at io ns
By d e f in it io n , the cro ss-sectio n al average v e lo c ity is calcu lated
by in te g ra tin g over the section
An incremental area ( F ig .8) was approxim ately the d iffe re n c e between two
sectors o f radius r + y (J ) and r + y ( J - l ) . The v e lo c ity o f th is element
is the average o f the predetermined v e lo c itie s a t (J ) and ( J - l ) .
By summing over the e n tir e incremental a rea , the average v e lo c ity is de
termined. Then, by summing these cross-section al average v e lo c itie s in
each s e c tio n , the bulk v e lo c ity (u, ,,,) was determined fo r the sub-D j a v
channel.
r
AAJo ub dA
(3 .3 3 )
o
dA
u = u (J ) + u ( J - l )
2
(3 .3 4 )
dA = s a [ ( r + y ( j) ) 2 - ( r + y ( J - l ) ) 2] (3 .3 5 )
31
K CONCLUSION OF ITERATION PROCEDURE
Knowing the average bulk v e lo c ity , a new Fanning f r ic t io n fa c to r
( eq. 3 .1 4 ) is c a lc u la te d . With th is revised f , a new ub ay++ is d e te r
mined ( e q. 3 .1 6 ) and consequently a revised Re is c a lcu lated by re
arranging eq. 3.18:
Re = r++ub,av++/ t r /D e ) (3 *36)
I f th is Re agreed w ith th a t desired the it e r a t io n was term inated. I f
n o t, the ite r a tio n continued from e q . 3.17 u n til a desired convergence
was obtained.
L DETERMINATION OF FLOW SPLIT IN A TRIANGULAR-SQUARE ARRAY (G./G 1
w 3
The flo w s p l i t was defined as the r a tio o f the mass flu x fo r a
tria n g u la r channel to the mass flu x fo r a square channel, where
G = pub,av (3 - 37)
For constant physical p ro p e rtie s , the flo w s p l i t became the r a tio o f
cro ss-sectio n al average v e lo c itie s . To determine th is r a t i o , the average
cro ss-section al v e lo c ity fo r a tria n g u la r arra y was found by the method
ju s t described a t a p a r tic u la r Re. Since the pressure drop must be
uniform in each channel, the dp/dx calcu lated from the tria n g u la r array
- must be the value fo r the square a rra y . This value was used as a con
s ta n t.to determine the cross-sectional average v e lo c ity fo r the square
a rra y . No ite r a tio n s were required fo r th is case.
M OUTPUT
Enough data was prin ted to show the v a ria tio n o f f r i c t io n fa c to r
spacing parameter; and the v a ria tio n o f shear stress on the rod w ith
angle 0 fo r various values o f the spacing parameter fo r both arrays.
More im p o rta n tly, however, s u f fic ie n t values o f the v e lo c ity a t
a po int in each section were c a lcu lated so as to give a p re d ic tio n o f
the v e lo c ity d is tr ib u tio n between tubes fo r d if fe r e n t gap widths and Re.
The section studied was expanded (100 - 175 tim es) w ith a SCALE fa c to r
so th a t meaningful p lo ts could be drawn and studied.
These plots also served the purpose o f determining more accurate
v e lo c ity g rad ien t lin e s (as opposed to our i n i t i a l assumption o f using
the ra d ia l lin e s as a v e lo c ity g ra d ie n t). By using a planim eter to re
c a lc u la te the new area and subm itting these in to a s im ila r program as
the one developed, a second t r i a l w ith more accurate constant v e lo c ity
lin e s may be drawn. Once the v e lo c ity gradient lin e s and lin e s o f con
s ta n t v e lo c ity have repeated themselves, no more t r i a l s need be done
iy RESULTS AND DISCUSSION
In the lit e r a t u r e survey, i t was made evident th a t the method of
D eis sle r and Taylor I I ] was a common model fo r determining v e lo c ity d is
trib u tio n s in banks o f rods or tubes. For th is reason, a basic computer
model was made of th e ir analysis to which changes could be made in the
fu tu re . A computer program LOOP was developed to determine the flo w
-s p l i t in an i n f i n i t e a rra y o f tria n g u la r--s q u a re -subchannel-s. In ad d itio n
th is program calcu lated local and cross-section al average v e lo c it ie s ,
f r ic t io n fa c to rs , and w all shear stress fo r both arrays. A re p resen tative
input and output o f the program, which corresponds to the program do
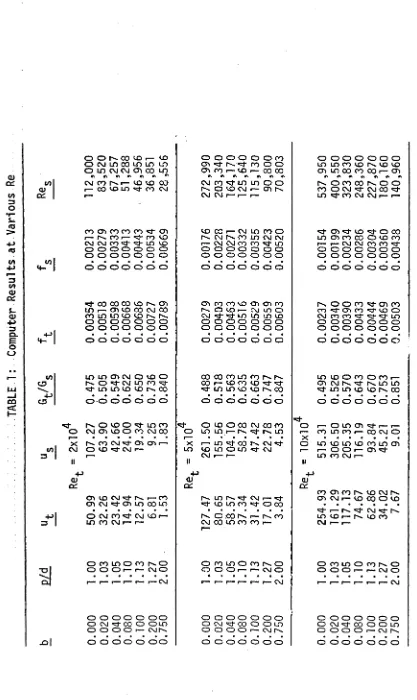
cumentation, is given in Appendix I . In ta b le 1 are summarized the pre
d icted f r ic t io n fa c to r , lo cal v e lo c ity , e tc . fo r a tria n g u la r a rra y a t
Re o f 2 x 10^, 5 x 10^ and 1 .0 x 10^ fo r a range o f p/d r a tio s .
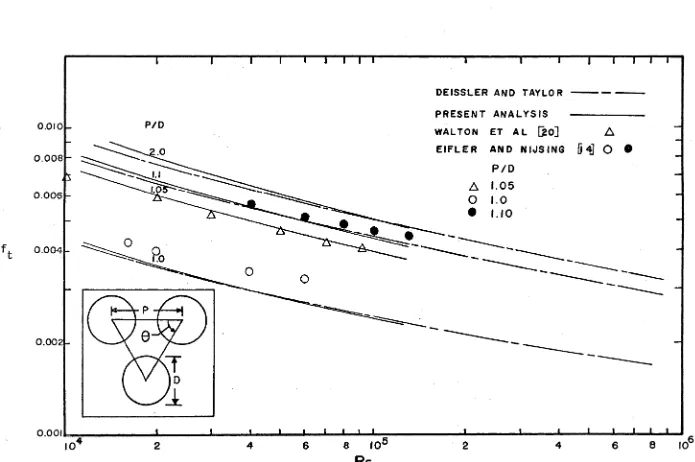
Figure 9 illu s t r a te d th a t f r ic t io n fa c to r p redictio n s fo r a t r i
-angular a rra y o f rods were in good agreement w ith those o f D eis sle r and
T a y lo r. Experimental data o f E if l e r and N ijs in g [1 4 ] a t a p/d o f 1 .0
and 1.1 were higher than predicted f r ic t io n fa c to rs , but the experimental
data o f Walton e t al [2 0 ] a t a p/d o f 1.05 were in good agreement. F r ic
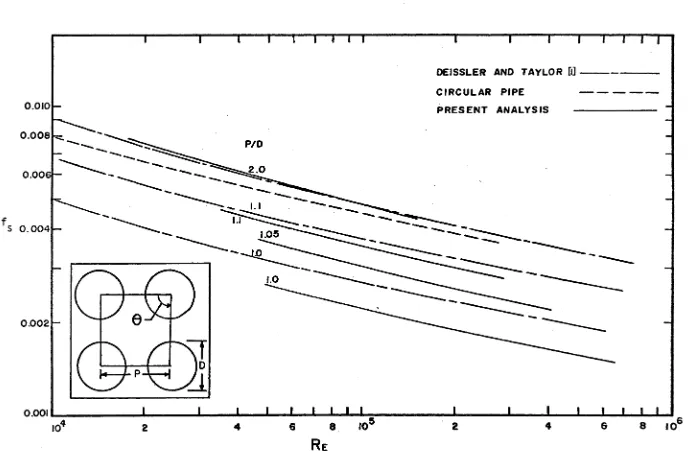
tio n fa c to rs fo r a square arra y are compared w ith those o f D eis sle r and
Taylor in Figure 10 where, a t a p/d o f 1 .0 , the present an alysis pre
d icted f r ic t io n fa c to rs appreciably lower than those o f D e is sle r and
T aylo r. However, a t a p/d o f 1 .1 , the agreement was g re a tly improved,
and a t a p/d o f 2 .0 the comparison was e x c e lle n t. These discrepancies
are a ttrib u te d to : i ) the increased accuracy obtainable w ith a computer
as compared to the hand c a lc u la tio n o f D eis sle r and T a y lo r, and i i )
TA
B
LE
1:
C
o
m
p
u
te
r
R
e
s
u
lt
s
at
V
a
ri
o
u
s
R
e
O O 1—. CO ID co o o o o o o co O o o o o o o o cm in co in LO in cd ■3- *3- co o o LO in oo LO r>. in LO O LO CM CM CD CO in CD CO i— CD 0 0 00 OV in co 00 0 0 i— CD
A A A A A c* ** A A A A #k It #t AC AC »c r. it *\
t/) CM CO IN r — CO co CO CVJ co in LO o o o CO CO r - , o o O) i— co c o in m- co CVJ O CO CM i—- cr> co O CM •3- CM 0 0
<3-c <3-c \ r— CVJ CM I— r— p— LO *3- co CM CM
co ct> co co oo <vt- CD LO 0 0 1— CM LO CO o CTC «3" in O CO ■— CO r— "M- CO CO cm r-^ co LO CM CM LO CD CO CO O ID co CM CM CO «=d- "3- LO co p— CM CM CO CO <3- in r— 1— CM CM CO CO '3 ' o o o o o o o o o o o O o o O O O o O O O o o o o o o o o o o o O o o o o o o o o O
CO a • • • • • • • • • • • • • • • • • • • •
^ \ o o o o o o o o o o o o o o o o o o o o o
*3- CO 0 0 CO CO 1"- <T> cr> co co co CD CD CO r-s o o CO 'S - O i 00 i n 1— CD ID 0 0 CM CO O ID 1— CVJ LO O CO •3 - CD CO •5J- ID o c o l o c n if l co r^s. c-- CM «3- *3- m LO LO LO CM oo oo ■M" ^ "5f LO o o o o o o o o O O o O O O o o o o o o o o o o o o o o o o o o o O O o o o o o o o
-p a • a • a • • • • « • • • • a • • • • • «
M - o o o o o o o o o o o o o o o o o o o o o
10 m t n c jicm o co o 00 0 0 CO LO CO t '- r -- LO in o CO O CO CD n o M -c m l o r o 0 0 r— LO CO co 'd - «3- CD cm r-~ rv . in in
M - i n c o co n co <3- LO LO LO co r-'. oo in in LO id 00
+J • • • • • • • • • • • • • • • • • • • • a
CD 0 - 0 o o o o o o o o o o o o o o o o o o o
In O CD O O ' LO CO o CO O 00 CM CO CO o p— o in CD 1— ,—
o CM O l CD O CO CM CO o in L D i - l s <3- in I— * CO in co r — CO CM o
1--- « ■ « • • • • r — • a • • • • a X » a a • • • a
X r-«. co cvi *5^* 0">c d P—» X r—^ in *3- oo 1^. CM "5j- o LO LO LO LO co in CD to CM O U D ^ C V J r ' LO LO w o w *3" CM r— r —• O O r— CD
*d-3 r—* CVJ p— r " LO CO CVJ r—•
II II II
4 -> -P -p
Ol <D <D
o c CC OC
CO CD CO ID CM
c d t o csj CO L D C .^ - CM i— CD CV1 r— LO0 0 o LO
CD cvj c d m 0 0 LO co in co *3" O CO • • •
• • • • • • • • • • • • • • i— CM
*3-•P O CVJ 0 0 *3* CVJ LO r—• O CO N I— co LO LO r— Dn. ID CO
3 1 Lf) CO CVJ r— r— CVJ co in co 00 p * CVJ r— i—
O 0 0 LO O CO r ^ o o co in o co o o CO LO o co r^. o " O l O O O r— r - CVJ O o O O i— r— CVJ o o o o r— r— CM o
SsJ • • • • • • • • • • • • * • • • • • • • a
r— r — r— r— r — CVJ r— i—- 1—~ i— r— CVJ r— r “m r i— i— CVJ
o o o o o o o O CD O O O O O o o o o o o o
O N ^ T C O O O L D O CM <3- CO O O LO o CVJ CO o o LO O O O O I— c v ir^ O o o o r— CVJ Ds. o o o o r— CMD s .
a a • • a • • • • • • • • • • • • • a « a
R
ep
ro
du
ced
w
ith
pe
rm
is
si
o
n
of
th
e
co
py
ri
gh
t
o
w
ne
r.
Fu
rthe
r
re
production
p
ro
h
ib
it
e
d
w
ith
ou
t
p
e
rm
is
s
io
n
.
DEISSLER AND TAYLOR
PRESENT ANALYSIS
WALTON ET AL & 0 ]
E IF L E R AND N IJ S IN i
P /D
O . O I O
0 .0 0 8
P / D
1.05 0.006
i . i o
0 .0 0 4
1.0
0.002
1 J I L
1 1
ro
du
ced
w
ith
pe
rm
is
si
o
n
of
th
e
co
py
ri
gh
t
o
w
ne
r.
Fu
rthe
r
re
production
p
ro
h
ib
it
e
d
w
ith
ou
t
p
e
rm
is
s
io
n
.
DEISSLER AND TAYLOR M
CIRCULAR PIPE
O.OIO PRESENT ANALYSIS
0.008
P/D
2 .0
0.000
f
s 0.004 1.05
1.0
0.002
0.001
37
only one ite r a tio n (ra d ia l lin e s as y e lo c ity gradien t lin e s ] was in
corporated in to the computer model w hile D eis sle r and Taylor used an
it e r a t iv e technique to update v e lo c ity gradient lin e s . The v a ria tio n
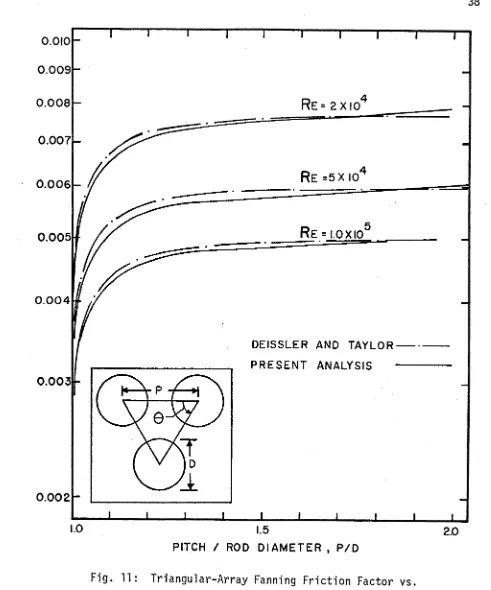
o f f r ic t io n fa c to r w ith p/d fo r a tria n g u la r arra y is shown in Figure 11
w ith Re as a parameter. This fig u re demonstrates the rapid increase o f
f r ic t io n fa c to r a t low p/d ra tio s and the excellent'agreem ent w ith the
analysis o f D eissler and Taylor £ 1 ].
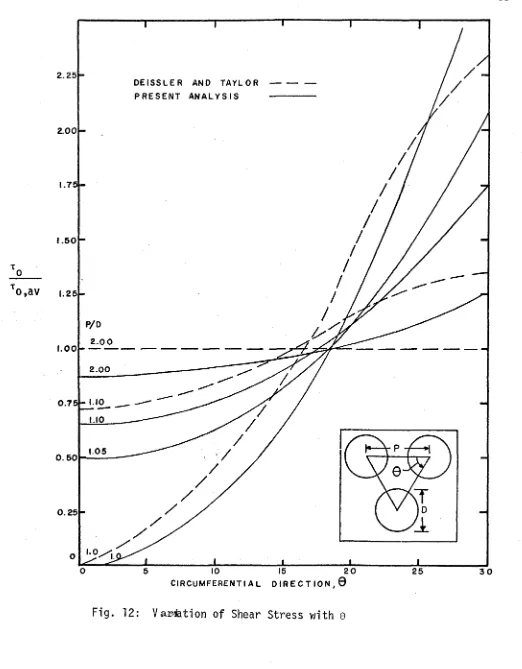
Shear stress v a ria tio n s , (tq/ t0 ay) , in the c irc u m fe re n tia l d ire c tio n
fo r a tria n g u la r arra y are compared in Figure 12. The re s u lts o f D eissler
and Taylor were c o n s is te n tly higher a t any p/d r a t i o , except in the upper
c irc u m fe re n tia l sections where the present analysis co n stan tly overpre
d icted the shear stress v a ria tio n . However, in both models, the shear
stress was lowest in the regions where the rods were clo sest together
and approached zero as p/d approached u n ity , i . e . where the rods touched.
A s im ila r comparison was made in Figure 13 w ith u^/u^ ay being the
dependent v a ria b le . Again the re s u lts o f D eissler and T aylo r were con
s is te n tly higher except fo r angles g re a ter than 20° where the present
analysis d iffe re d markedly. Both fig u re s 12 and 13 demonstrate the in
crease in shear stress and v e lo c ity w ith rod spacing and w ith distance
from the gap region.
As previously mentioned, one attempt was assumed to be accurate
enough in the computer model to give a reasonably f a i r agreement with
the model o f D eissler and T aylo r. Thus lin e s normal to the rod surface
were the v e lo c ity gradient lin e s used in determining the v e lo c ity d is
0.010
0 .0 0 9
0 .0 0 8
0 .0 0 7
0 .0 0 6
R
e= i.o x io
0 .0 0 5
0 .0 0 4
D E I S S L E R AND T A Y L OR
P R E S E N T ANALYSI S
0 .0 0 3
0.002
1.0 1.5 2.0
PITCH / ROD D I A M E T E R , P / D
Fig. 11: T ria n g u la r-A rra y Fanning F ric tio n Factor vs.