DESIGN AND DEVELOPMENT OF AN
AUTOMATIC FINGERPRINT VERIFICATION SYSTEM
(REKABENTUK DAN PEMBANGUNAN SISTEM PENGECAMAN
DAN VERIFIKASI CAP JARI)
GHAZALI BIN SULONG
FAKULTI SAINS KOMPUTER DAN SISTEM MAKLUMAT
UNIVERSITI TEKNOLOGI MALAYSIA
v
ABSTRACT
Data security is an important part of internetworking. It prevents fraudulent
users from accessing an individual personal data. Biometrics is one such
authentication method used in a wide range of application domains such as
e-commerce and automated banking. Biometrics is more reliable and more capable of
differentiating between an authorised person and a fraudulent impostor than
traditional methods such as passwords and PIN numbers. There are a number of
biometrics technologies being researched and under development such as fingerprint
identification, face recognition, iris recognition, etc. However, fingerprint
identification is one of the most reliable biometrics technologies. Generally, there are
two approaches to fingerprint identification, namely conventional and bypass. In the
former approach, fingerprint images have to go through several processes including
noise removal, segmentation, thinning and finally minutiae extraction. Whereas, in
the latter approach, the minutiae are directly extracted from a greyscale image and
bypassing all the above processes. However, the minutiae extraction is an error prone
process, depending on quality of the fingerprint images. A low quality image will
generate many false minutiae that eventually lead to errors in fingerprint
identification. This research focuses on design and development of an automatic
fingerprint verification system that capable of handling a wide variety of fingerprints.
Here, the biggest challenge is to develop a technique that can enhance or improve a
low quality image which contains scars, sweat spots and broken ridges. Our proposed
framework is started with noise removal, and followed by image enhancement,
directional image computation, fingerprint reconstruction, segmentation, thinning,
minutiae extraction, and finally fingerprint matching. In this study, 500 fingerprints
were tested and the percentage of successful matches was 91 percent. This
achievement was directly attributable to our new enhancement technique’s excellent
performance in the fingerprint reconstruction.
ABSTRAK
Keselamatan data merupakan isu yang amat penting dalam jaringan rangkaian
komputer. Ia dapat membendung pencerobohan terhadap data individu. Biometrik
merupakan satu daripada kaedah pengesahan identiti yang digunakan secara meluas
dalam pelbagai bidang seperti e-dagang dan e-bank. Kaedah biometrik ini amat diyakini
dan berkemampuan untuk membezakan kesahihan identiti seorang individu dengan
penyamarnya. Ia adalah lebih baik daripada kaedah tradisional yang menggunakan
katalaluan dan nombor PIN. Kini, terdapat beberapa teknologi biometrik yang sedang
giat dikaji dan dibangunkan, termasuklah sistem pengecaman cap jari, pengecaman
muka, pengecaman mata dan lain-lain. Walaubagaimanapun, pengecaman cap jari adalah
lebih diyakini. Lazimnya, terdapat dua pendekatan pengecaman cap jari, iaitu kaedah
konvensional dan kaedah pintas. Dalam kaedah konvensional, imej cap jari terlebih
dahulu diproses melalui penghapusan hingar, dikuti oleh segmentasi, penipisan, dan
akhirnya proses pengekstrakan minutiae. Sementara itu, bagi kaedah pintas, munitiae
diekstrak secara langsung daripada imej cap jari berskala kelabu tanpa perlu melalui
proses-proses diatas. Walaubagaimanapun, pengekstrakan minutiae adalah satu proses yang amat sensitif yang sering kali menghasilkan ralat, dan sangat bergantung kepada
kualiti imej cap jari. Bagi imej berkualiti rendah, ianya mudah terdorong kepada
penghasilan ralat dan seterusnya mengakibatkan kesilapan dalam pengecaman cap jari.
Penyelidikan ini memfokus kepada rekabentuk dan pembangunan satu sistem verifikasi
cap jari automatik yang berkeupayaan untuk mengendalikan pelbagai rupa bentuk cap
jari. Disini, cabaran terbesar adalah untuk menghasilkan satu teknik yang mampu untuk
memperbaiki dan mempertingkatkan mutu imej berkualiti rendah yang mengandungi
parut, liang peluh dan batas terputus Rangkakerja yang dicadangkan adalah dimulai
dengan penghapusan hingar, diikuti oleh pembaikan imej, penjanaan imej terarah,
pembangunan semula imej cap jari, segmentasi, penipisan, pengekstrakan minutiae, and akhirnya pemadanan cap jari. Dalam kajian ini, sebanyak 500 cap jari telah diuji dengan
ketepadan padanan yang terhasil adalah 91 peratus. Pencapaian ini adalah ekoran
vii
TABLE OF CONTENTS
CHAPTER TITLE PAGE
DECLARATION ii
DEDICATION iii
ACKNOWLEDGMENT iv
ABSTRACT v
ABSTRAK vi
TABLE OF CONTENTS vii
LIST OF TABLES xii
LIST OF FIGURES xiv
LIST OF APPENDICES xix
1 INTRODUCTION 1
1.1 Overview 1
1.2 Background of the Problem 2
1.3 Statement of Problem 2
1.4 Objectives of the Study 3
1.5 Scope 3
1.6 Previous Framework 4
1.7 Proposed Framework 5
1.8 Biometric: An Overview 7
2 LITERATURE REVIEW 9
2.1 Overview 9
2.2 Fingerprint History 10
2.3 Fingerprint Analysis 13
2.5 Automated Fingerprint Identification System 15
2.6 Image Pre-Processing and Enhancement 17
2.6.1 Spatial Domains Approach 18
2.6.2 Frequency Domains Approach 19
2.7 Directional Image 20
2.7.1 Mehtre 21
2.7.2 Iterated Least Mean Square
Orientation Estimation Algorithm 21
2.7.3 Directional Mask 22
2.8 Segmentation 23
2.8.1 Global Thresholding 24
2.8.2 Regional Average Thresholding 24
2.8.3 Histogram Based Thresholding 24
2.8.4 Niblack Binarization 25
2.9 Thinning 25
2.9.1 Safe Point Thinning Algorithm 26
2.9.2 Two-way Pass 27
2.9.3 Fast Thinning Algorithm 27
2.9.4 Ridge Line Following Algorithm 28
2.10 Minutiae Extraction 28
2.10.1 Crossing Number 29
2.10.2 Template 29
2.11 Matching 29
2.11.1 Template Matching 30
2.11.2 Alignment Based Algorithm 30
2.11.3 Flexible Matching Algorithm (The
Matcher) 31
3 METHODOLOGY 32
3.1 Overview 32
3.2 Fingerprint Pre-Processing and Enhancement 32
ix
3.2.2 Sharpening Filter 39
3.2.3 Histogram Equalization 41
3.3 Directional Image 46
3.3.1 Mehtre 47
3.3.2 Iterated Least Mean Square
Orientation Estimation Algorithm 54
3.4 Fingerprint Reconstruction 58
3.4.1 Directional Fourier Filtering 58
3.4.1.1 Frequency
Transformation 58
3.4.2 Frequency Filter 60
3.4.2.1 Directional Filter 60
3.4.3 Reconstructing Fingerprint Image 61
3.5 Fingerprint Segmentation 63
3.5.1 Global Thresholding 64
3.5.2 Regional Average Thresholding 65
3.5.3 Histogram Based Thresholding 68
3.5.3.1 Histogram Peak
Technique 69
3.5.3.2 Histogram Valley
Technique 71
3.5.3.3 Histogram Adaptive
Technique 71
3.6 Fingerprint Thinning 74
3.6.1 Two Way Pass 75
3.6.2 Fast Thinning Algorithm 77
3.6.2.1 Delimitation of the
Contour of the Image 78
3.6.2.2 Deletion of the Contour
of the Image 79
3.6.2.3 Noise Verification 82
3.6.2.4 Verify Connectivity 83
3.6.3 Ridge Line Following Algorithm 87
3.7 Fingerprint Feature Extraction 93
3.7.1 Crossing Number 93
3.7.2 Template 96
3.7.3
Proposed Block Template
Extraction
97
3.8 Fingerprint Matching 99
3.8.1 Template Matching 102
3.8.2
Proposed Block Template
Matching
105
4 RESULTS AND DISCUSSION 106
4.1 Overview 106
4.2 Dataset 106
4.3 Experiment 108
4.4 Results 109
4.4.1
Fingerprint Pre-Processing and
Enhancement 110
4.4.2 Directional Image 113
4.4.3 Fingerprint Reconstruction 114
4.4.3.1 Mehtre Based as
Directional Image 115
4.4.3.2 Least Mean Square
Orientation Estimation
as Directional Image 121
4.4.4 Fingerprint Segmentation 123
4.4.5 Fingerprint Thinning 125
4.4.6 Fingerprint Feature Extraction 127
4.4.7 Fingerprint Matching 131
4.5 Discussion 136
xi
5.1 Overview 141
5.1 Conclusion and Research Discovery 141
5.3 Contribution 142
5.4 Future Work 143
5.4.1 Fingerprint Matching 143
REFERENCES 145
LIST OF APPENDICES
APPENDIX TITLE PAGE
A Result from Arch Class 149
B Result from Left Loop Class 158
C Result from Right Loop Class 167
D Result from Tented Class 176
xi
LIST OF TABLES
NO. TITLE PAGE
3.1 Histogram of image 43
3.2 Histogram equalized values 44
3.3 Histogram of the histogram equalized image 45
3.4 Characteristics of Crossing Number. 94
4.1 Results of fingerprint reconstruction using Mehtre Based and
Least Square Estimation as directional image 123
4.2 Average minutiae successful extracted from dataset using
Template Matching Technique 132
4.3 Average minutiae successful extracted from dataset using
LIST OF FIGURES
FIGURE NO. TITLE PAGE
1.1 Conventional frameworks in fingerprint identification system 5
1.2 Proposed frameworks in fingerprint identification system 6
2.1 Fingerprints illustration drawn by Grew (Cummins et al,
1961) 10
2.2 Mayer’s drawing of fingerprints (Moenssens, 1971) 11
2.3 Trademarks of Thomas Bewick (Chapel, 1971) 11
2.4 Nine patterns illustrated in Purkinje’s thesis (Moenssens,
1971) 12
2.5 Fingerprints ridges and furrows 14
2.6 Fingerprint’s minutiae 14
2.7 Basic processes involved in the Automated Fingerprint
Identification System (AFIS) 17
2.8 Direction masks. Each number represents an angle. (a)
8-way direction mask. (b) 4-8-way direction mask 23
3.1 Original fingerprint image 33
3.2 Original pixel values before averaging filter 34
3.3 New pixels values and the new fingerprint image after the
average value is obtained 35
3.4 Pixel values and the new fingerprint image after median
xiii
3.5 Pixel values and the new fingerprint image after minimum
filtering 37
3.6 Pixel values and the new fingerprint image after maximum
filtering 37
3.7 Low-Pass filter masks 38
3.8
Pixel values and the new fingerprint image after Low-Pass
filtering 39
3.9 High-Pass spatial mask filter 40
3.10 Fingerprint image after applying the High Pass filter 40
3.11 High Boost spatial filter 41
3.12 Fingerprint image after applied High Boost Filter where c=9 41
3.13 (a) Histogram of dark image; (b) histogram of bright image;
(c) histogram of an image containing two regions with
different distributions 43
3.14 Histogram of original image 44
3.15 Histogram of the histogram equalized image 45
3.16 OriginalHistogram 45
3.17 Histogram after histogram equalization 46
3.18 Fingerprint image after histogram equalization 46
3.19 Directional image generation graphically summarized 48
3.20 Direction computations in 8 directions 49
3.21 Original fingerprint image after pre-processing and
enhancement stage 50
3.22 Pixel wise directional image of the original fingerprint image 50
3.23 Noisy block directional image. (a)4x4 region, (b)8x8 region,
(c) 16x16 region, and (d)32x32 region 51
3.24 Block directional image after block filtering. (a)4x4 region,
(b)8x8 region, (c) 16x16 region, and (d)32x32 region 52
filtering and (b) after block filtering 52
3.26 Directional mapping on original images. (a) None block
filtering, (b) Median Filtering, (c) Maximum Filtering,
(d) Minimum Filtering, (e) Average Filtering, (f) Low-Pass
Filtering, (g) High-Pass Filtering 54
3.27 (a) Block directional image, (b) Local ridge orientation in 4
directions without smoothing 57
3.28 Local ridge orientation in with smoothing, (a) 4 direction,
(b) 8 direction 57
3.29 Ridges and furrows represents frequency component. 59
3.30 Image transformations in spatial domain into frequency
domain using FFT 59
3.31 Directional filter developed by Ikonomopolous 61
3.32 Fingerprint image reconstruction process 62
3.33 New fingerprint image after fingerprint reconstruction 64
3.34 Fingerprint image after Global Thresholding 65
3.35 Operation of thresholding for 8 x 4 regions 67
3.36 Fingerprint images after Regional Average Thresholding, (a)
16x16, (b) 16x8, (c) 8x8 and (d) 8x4 regions 68
3.37 Histogram of nine gray level images 69
3.38 A histogram in which highest peak does not correspond to
the background 70
3.39 Fingerprint image after Histogram Peak Technique 70
3.40 Fingerprint image after Histogram Valley Technique 71
3.41 Fingerprint image after Histogram Adaptive Technique 72
3.42 Fingerprint image after Niblack Binarization, (a) 32x32, (b)
16x16, (c) 8x8, (d) 4x4 regions. 73
3.43 Binaryfingerprint image as input image 74
xv
South boundary; (c) North-West corner point. 76
3.45 Central window pixels belonging to: (a) North boundary;
(b) West boundary; (c) South-East corner 77
3.46 Fingerprint image after Two-Way Thinning Algorithm 77
3.47 Chain codes of 8 directions 78
3.48 Templates utilized in the verification of the disposition of the
pixel-on marked with the value 2 and their pixel-on
neighbours 80
3.49 Templates utilized in the verification of the disposition of the
pixel-on marked with the value 2 and their pixels-on
neighbours 80
3.50 Pixel-on marked with value 2 and its 2 adjacent pixels-on
neighbours 83
3.51 Analysis carried out during the deviation verification stage 86
3.52 Case example of pixel-on marked with the value 2 moved to
the position found 87
3.53 Thinnedfingerprint image using Fast Thinning Algorithm 87
3.54 RMP and REP of ridges and the thinned points 88
3.55 RCP candidates for left side following 89
3.56 RCP candidates for right side following 90
3.57 Example for Ridge Continuity Point (RCP). 90
3.58 Changes of ridge spacing at a bifurcation. 91
3.59 Pseudo code for thinning algorithm. 92
3.60 Thinned fingerprint image using Ridge Line Following 92
3.61 Thinned fingerprint image as input 93
3.62 3 x 3 mask 94
3.63 Thinned fingerprint image 95
3.65 Pseudo code for minutiae extraction 96
3.66 Three possibilities in minutiae extraction process. 97
3.67 Divided thinned fingerprint image using (a) 64 x 64
(b) 32 x 32 (c) 16 x 16 window blocks 98
3.68 Extracted minutiae in various blocks; (a) 64 x 64 (b) 32 x 32
(c) 16 x 16 window blocks 99
4.1 Fingerprint image for each class, (a) whorl, (b) arch, (c) left
loop, (d) right loop and (e) tented 107
4.2 Fingerprint image qualities, (a) low quality, (b) high quality 108
4.3 Original fingerprint images before pre-processing and
enhancement 110
4.4 Filtered fingerprint images. (a) Averaging filter, (b)
Minimum filter, (c) Median filter, (d) Maximum filter, (e)
Low-Pass filter, (f) Hexagonal Grid filter, (g) Histogram
Equalization 111
4.5 Filtered fingerprint images; (a) Pass filter, (b)
High-Boost filter 112
4.6 i) Using Mehtre based concept, ii) Using Least Mean Square
Estimation 114
4.7 8 set pre-filtered fingerprint images , a) Original image, b)
Directional image using Mehtre based, c) 00, d) 22.50,
e) 450, f) 67.50, g) 900, h) 112.50, i) 1350, j) 157.50 116
4.8 Reconstructed fingerprint image obtains from 8 set
pre-filtered fingerprint images 117
4.9 Successful fingerprint image reconstruction 118
4.10 Fingerprint image contains vertical scars 119
4.11 Fingerprint image contains horizontal scars 119
4.12 Fingerprint image contains both vertical and horizontal scars 120
4.13 Clear fingerprint images 120
xvii
4.15 New reconstructed fingerprint image using Least Square
Orientation Estimation Algorithm, (a) Original fingerprint
image, (b) Directional Image, (c) Fingerprint image
reconstruction 122
4.16 Wrong elements in directional image reconstruct new
fingerprint image with wrong elements 123
4.17 Fingerprint segmentation. Original image produced from
image reconstruction; (b) Global Thresholding; (c) Regional
Average Thresholding; (d) Histogram Peak Thresholding; (e)
Histogram Valley Thresholding; (f) Histogram Adaptive
Thresholding; (g) Niblack Binarization 125
4.18 Thinned fingerprint image, (a) Original image after
segmentation, (b) Two-Way Pass Thinning, (c) Fast
Thinning Algorithm, (d) Ridge Line Following Thinning 126
4.19 Fingerprint thinned image 128
4.20 Ridge ending extraction using manual technique 128
4.21 Ridge bifurcation extraction using manual techniques 128
4.22 Ridge ending extraction using Crossing Number 129
4.23 Ridge bifurcation extraction using Crossing Number 129
4.24 Ridge ending extraction using Template 129
4.25 Ridge bifurcation extraction using Template 130
4.26 Ridge ending extraction using Proposed Block Template
Extraction 130
4.27 Ridge bifurcation extraction using Proposed Block Template
Extraction 130
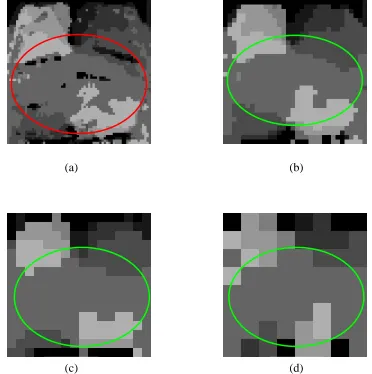
4.28 Matched fingerprint image which has different translation
and rotation. (a) and (b) fingerprint from same fingerprint
image, (c) and (d) thinned fingerprint image, (e) and (f)
extracted minutiae superimposed in thinned fingerprint
4.29 Matching result of four fingerprint rotation, 0°, 90°, 180°,
270°, (a)-(d) thinned fingerprint image, (e)-(h)extracted
minutiae super
imposed on thinned image and (i)-(l) extracted minutiae on
3 x 3 windows 136
4.30 Fingerprint contains pore on ridges 138
4.31 Low quality of fingerprint image, (a) very light, (b) very
dark 138
ii
We declare that this report entitled “Design and development of an automatic fingerprint verification system” is the result from our own research except as cited in the references.
Signature :
Name : Prof. Dr. Ghazali bin Sulong
To all my fellow researchers,
"I give greater respect to knowledge rather than to people, for it is they who are in need of the knowledge and it is they who should seek it."
iv
ACKNOWLEDGEMENTS
I wish to express my deep and lasting appreciation to my friends and associates who have
assisted me and involved in this research, especially Mohamad Khairulli Othman;
Dzulkifli Mohammed, PhD.; Jumail Taliba; Mohd Sufian Jusoh; Leong Chung Ern; Siti
Masrina Sulong; and Ra Delina Patail.
I would also like to thank the Universiti Teknologi Malaysia (UTM); The Ministry of
Science, Technology and Innovation (MOSTI); Research Management Centre (RMC);
Fakulti Sains Komputer & Sistem Maklumat (FSKSM); Abdul Hanan Abdullah, PhD;
Siti Mariam Shamsudin, PhD.; Naomie Salim, PhD.; Rose Alinda Alia, PhD.; Safaai
Deris, PhD.; and Daut Daman, without whom a project of this scope could never have
INTRODUCTION
1.1. Overview
This chapter discusses each of the topics below:
1. Background of the Problem
2. Statement of Problem
3. Objective of research
4. Scope of research
Previous and proposed framework of research will also be discussed. In the biometric
sub-topic, the biometric technology based on physical characteristic and behavioural
2
1.2. Background of the Problem
Today, fingerprints are widely used as identification in many types of
applications. The fingerprint identification system matches two fingerprint based on
their macro-features, which are commonly recognized as fingerprint minutiae. Most
of the time, these minutiae are corrupted during the scanning process and would
produce false minutiae. The fingerprint can be corrupted in two ways: first, during
the fingerprint scanning process; and second, fingerprints may contain scars. During
the scanning process, a few factors can influence the quality of the image. These
factors are pressure, moisture and the scanner quality. The corrupted fingerprint
image can produce false minutiaes and probably lead to a wrong identification
match.
This situation has led us to belief that using a fingerprint reconstruction
technique to create a new image of higher quality without removing an original
feature will lead to correct identification of individual.
1.3. Statement of Problem
This research looks into fingerprint reconstruction from original image to
remove the noise during scanning process and reconstruct scar to perfect ridges and
furrows. This research will also cover fingerprint pre-processing, directional image,
segmentation, thinning, features extraction and fingerprint matching technique to
1.4. Objectives of the Study
This research covers various existing methodology or algorithm in each stage
of the fingerprint identification system. The research starts from fingerprint
pre-processing, enhancement, directional image, segmentation, thinning, feature
extraction and then matching.
In this research, experiments on all stages and a comparative study with
several methods in each stage were carried out.
The objectives of the study are to find the best method and suggestions based
on the results of the experiments and comparative study. An automated fingerprint
identification prototype from suggested techniques will also be developed.
1.5. Scope
This thesis focuses on using greyscale fingerprint images obtained through an
optical scanner. The dataset will consist of 500 fingerprint images in various classes
and noise.
This research involves the complete process of fingerprint identification
starting from the image acquisition, pre-processing, segmentation, thinning, feature
extraction and matching them with the records in the database. A one-to-many
4
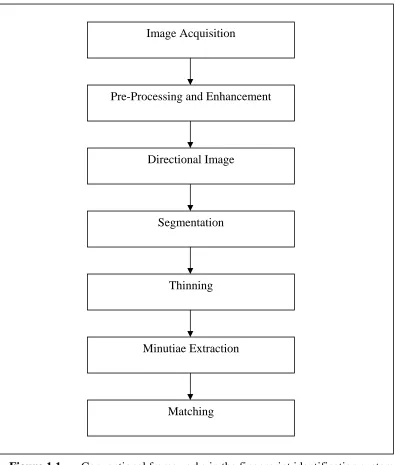
1.6. Framework of Previous Studies
Figure 1.1 below shows a flow-chart of summarized framework using the
traditional method in developing the fingerprint identification system. The traditional
method of fingerprint identification system consists of seven major stages. The
process starts by obtaining the fingerprint images using inked or inked-less device.
The obtained fingerprint image normally contains noise, which needs to be
discarded. The fingerprint quality will be enhanced during pre-processing and
enhancement stage.
The identification system generates directional image from the enhanced
image. Using directional image, the greyscale image is then converted into a binary
image. The binary image is divided into foreground, which consists of ridges and
background that consists of furrows. The binary image is then converted into
skeleton images during the thinning process. Fingerprint feature extraction from the
skeleton image happens during the minutiae extraction stage. Using the extracted
Figure 1.1 Conventional frameworks in the fingerprint identification system.
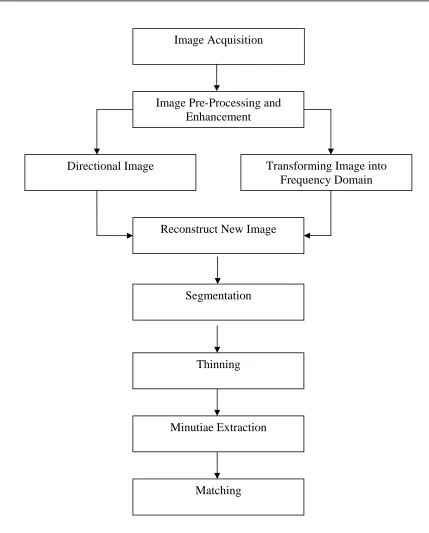
1.7. Proposed Framework
Figure 1.2 below graphically shows the framework of this research. It has ten
major stages. This framework is based on the conventional framework. In this
framework, three stages are added, namely: transforming original images into
frequency domain, fingerprint reconstruction and median filtering. The reconstructed Image Acquisition
Pre-Processing and Enhancement
Directional Image
Segmentation
Thinning
Minutiae Extraction
6
image is free from noise and is better than the original image, ensuring a better
fingerprint identification system.
Figure 1.2 Proposed frameworks in fingerprint identification system.
Figure 1.2: Proposed frameworks in fingerprint identification system. Image Acquisition
Image Pre-Processing and Enhancement
Directional Image Transforming Image into
Frequency Domain
Reconstruct New Image
Segmentation
Thinning
Minutiae Extraction
1.8 Biometric: An Overview
Biometric is a science in which physical characteristics and behaviours are
used to identify an individual or to verify a human identity. In other words, biometric
is a unique identification, which can be used to identify a person automatically.
With biometric technology, we can verify the owner attendant when
transaction occurs. Today, biometric technology spreads parallel with information
technology. Biometric technologies are very important in security to control illegal
transactions.
Biometric technology can be divided into two categories: i) based on physical
characteristics such as face, fingerprint, iris, and DNA, or ii) based on behavioural
aspects such as voice and signature.
The fingerprint method has already been used in human identification for a
century. It has been successfully implemented in forensic, administrative, banking
and in commerce sectors. Fingerprint contains unique feature called minutiae and it
is different for every each individual.
The generated wave frequency of human voice system is unique and different
for every individual. With this unique characteristic, a voice recognition system is
developed. This technology is widely used in text processing and has the potential to
be used in many fields. Unfortunately, when the number of samples increases, it is
very hard to differentiate the frequencies because the voice frequency is very
8
Deoxyribose Nucleic Acid (DNA) provides unique genetic information of the
human cell. Linus Pauling and Robert Corey first introduced DNA in 1951. Because
of the uniqueness, it has been widely used in forensic science to solve criminal cases.
DNA recognition is very different from other biometric technologies. It needs true
physical samples for making a comparison. To create DNA profile for each
individual is very difficult and takes time. Usually DNA profiling uses hair, bone,
blood or human tissue as the DNA sample. This technology is very accurate but
costly and hard to used widely in commerce and security fields.
Another method of identification of individuals is through iris recognition.
Iris recognition method is based on identifying the unique features of the tissues (iris)
of the eyes of individual. There is usually a brown, black or blue small circle shape
in the human eyes called iris. It is built from small tissues, which controls the
entrance of light into the human eye. This process is similar to the aperture function
in cameras. Iris map is obtained using special infrared camera. Although, this
technology has high accuracy rate, it is not very practical to be used widely.
Face recognition is a process to identify unique features on human face such
as the distance between the two eyes, the location of the mouth, ears, eyes, nose and
face sizes. This biometric technology has a very big potential in the commercial
security system. Unfortunately, to develop this system is a very difficult task. Even
today, scientists are still trying to explore how the human brain identifies human. The
development task becomes even more complex when dealing with natural mutable
features such as moustache, hair and beard.
The acceptance of human signature as an identification system has been
accepted for a long time, even though the signature technology is new and its
reputation does not equal the manual signature. Recognition process is very complex
because the stroke or signature shape is mutable. The accuracy of using this
LITERATURE REVIEW
2.1 Overview
This literature review covers the fingerprint history, fingerprint identification
system and fingerprint analysis. In the fingerprint identification system, previous
methods and methodology of research are discussed briefly. Different methods for
each stage of the fingerprint identification system are also reviewed in this literature
review section. The stages are:
1. Fingerprint pre-processing and enhancement
2. Directional image
3. Fingerprint reconstruction
4. Fingerprint segmentation
5. Fingerprint thinning
6. Minutiae extraction
7. Fingerprint matching
10
2.2 Fingerprint History
Humans have used fingerprints for a very long period of time (Lee et al,
1991). Human fingerprints have been discovered on a large number of archaeological
artefacts and historical items. These historical artefacts provide sufficient evidence to
show that ancient people used fingerprint such as in Babylon and Assyria.
In 1684, Dr. Nehemiah Grew (in Cummins et al, 1961) published a scientific
paper report regarding his study on the ridge, furrow and pore structure in
fingerprints. He described fingerprints structure based on his illustration. Figure 2.1
shows his illustration.
Figure 2.1 Fingerprints illustration drawn by Grew (Cummins et al, 1961)
Since then, a large number of researchers have invested a huge amount of effort on
the studies of fingerprint. In 1788, a detailed description of anatomical formations of
fingerprints was made by Mayer (Moenssens, 1971) in which a number of
Figure 2.2 Mayer’s drawing of fingerprints (Moenssens, 1971)
Starting in 1809, Thomas Bewick (Chapel, 1971) began to use his fingerprints as his
trademark, which is believed to be one of the most important milestones of the
scientific study of fingerprint identification. Figure 2.3 show Thomas’s trademark.
Figure 2.3 Trademarks of Thomas Bewick (Chapel, 1971)
In 1823, Purkinje (Moenssens, 1971) proposed the first fingerprint classification
scheme. He classified the fingerprints into nine categories according to the ridge
12
Figure 2.4 The nine patterns illustrated in Purkinje’s thesis (Moenssens, 1971)
In 1880, Henry Fauld (in Lee et. al, 1991) first scientifically suggested the
individuality of fingerprints based on his observation. At the same time, Herschel ( )
asserted that he had practiced fingerprint identification for about 20 years. This
discovery established the foundation of modern fingerprint identification. In the late
19th century, Sir Francis Galton (1961) conducted an extensive study of fingerprints.
In 1888, he introduced the minutiae features for single fingerprint classification. In
his work on fingerprinting, he named ridges characteristic known as Galton Details,
which are ridge endings, bifurcations, lakes, independent ridges or islands, spurs and
crossovers. He proved that every human being has different fingerprints.
Sir Edward Richard Henry (in Newham, 1995) who proposed the Henry
System of Classification made an important advancement in fingerprint identification
in 1899. The principles of this system are still in use today.
By the early 20th century, researchers started to understand the fingerprint
formations. The biological principles for fingerprints are as follows:
1. Individual epidermal ridges and furrows have different characteristics for
different fingerprints.
2. The configuration types are individually varied, but they vary within limits,
3. The configurations and minutiae details of individual ridges and furrows are
permanent and unchanging.
2.3 Fingerprint Analysis
The literature on the works of fingerprint features and characteristics have
previously been presented in the references of Galton (1961), Henry (1905), Cherrill
(1954) and the Federal Bureau of Investigation (1984).
Sir Francis Galton was the first person who undertook a substantial study of
the features of fingerprints. In fact, most people refer to the features of fingerprints as
Galton Details in honour of his contributions to fingerprint research. Galton defined
fingerprints with their ridge endings, bifurcations, lakes, independent ridges, spurs
and crossovers.
In fingerprints, there are singular points called deltas and cores. These
features are very important in fingerprints classification and counting ridges.
Fingerprints can be divided into several categories. The classifying system which is
widely known as the Henry System who was first devised and attempted by Sir
Edward Richard Henry is still being used today.
2.4 Fingerprint Features
Fingerprints contain ridges and furrows. There are two major attributes of the
14
cores and deltas are used for fingerprint classification. The local attributes extract
fingerprint ridges information known as minutiae and are used in fingerprint
identification (Kasei et al. 1997). Figure 2.5 shows the fingerprint ridges and
furrows.
Figure 2.5 Fingerprints ridges and furrows
Figure 2.6 Fingerprint’s minutiae
Ridges
Furrows
Bifurcation
Lake
Island
Ridge Ending
The different features of a fingerprint consist of bifurcation, lake, island, ridge
ending and short ridge. A bifurcation is a ridge divided or forked into two or more
parallel ridges. A lake is the joining of two bifurcations where one forms the left side
and the other forms the right side. An island is a very short and independent ridge. A
ridgeending is where a ridge begins and ends abruptly. A shortridge is a short and
independent ridge, but not shorter than an island. From the Figure 2.6, all minutiaes
are derived from a basic minutiae, ridge ending and bifurcation.
2.5 Automated Fingerprint Identification System
One of the fingerprint identification systems available is the Automated
Fingerprint Identification System (AFIS). AFIS remains as one of the most
prominent and reliable biometric identification method. AFIS determines whether
two fingerprints are from the same finger.
There are two types of AFIS; the first type is one-to-one matching (1-1) and
the second type is one-to-many matching (1-M). In a one-to-one matching
environment, the person has a token such as PIN number, identity card or smart card
for accessing the system. The system will match the live fingerprint with a copy
within the existing database interactively. This method is faster compared to the
one-to-many method.
In a one-to-many environment, the user does not have any token to identify
himself. In this case, the processing time is slower because the system needs to find
16
AFIS is already in use in several law enforcement applications. However, the
technology is still developing and there are still many unresolved research issues.
Automatic and reliable extraction of minutiae from a digital fingerprint image
is an extremely difficult task. The performance of a current available minutiae
extraction algorithm depends heavily on the quality of digital fingerprint images.
Figure 2.7 Basic processes involved in the Automated Fingerprint Identification
System (AFIS)
2.6 Image Pre-Processing and Enhancement
Noise always exists in digital images. Noise verification technique in a
digital image is not always accurate because of its random behaviour. Noise can
damage structures. This could lead to a failure or a false minutiae extraction. There
are two approaches to remove the noise and enhance the fingerprint image. They are
the spatial domain approach and frequency domain approach. Image Pre-Processing and
Enhancement
Directional Image
Segmentation
Thinning
Minutiae Extraction
18
2.6.1 Spatial Domain Approach
The term spatial domain refers to the aggregate of pixels in composing an
image. Spatial domain methods are procedures that operate directly on these pixels.
The three elements in the spatial domain approach are smoothing filter, sharpening
filter and histogram modelling.
Smoothing filter is used for blurring and reducing noise. Blurring is a
common pre-processing step to remove small details in an image. Examples of
smoothing filter technique are average, minimum and maximum filter.
Sharpening filter is used to highlight fine details or to enhance the details of
fingerprint images. A sharpening filter seeks to emphasize changes to the original
images. The example of sharpening filter is high-pass and high boost filter.
Low-contrast images occur often due to poor or non-uniform lighting
conditions or non-linearity or small dynamic range of the imaging sensor. One way
to resolve this is to use Histogram Modelling. The histogram of an image represents
the relative frequency of occurrence of the various grey levels in the image.
Histogram Modelling is a technique to modify an image so that the histogram has a
desired shape. This is useful in stretching the low-contrast level of images with
narrow histograms (Fundamental of Digital Image Processing). Histogram
equalization and histogram stretching are two techniques based on histogram
modelling.
Gonzales and Woods (1992) describe the process of enhancement in
frequency domain involves the following steps: i) the Fourier transformation of
image is obtained, ii) the result of transformation by a filter function is multiplied,
and iii) the inverse transformation to produce the enhanced image is taken. In this
domain, three methods are reviewed, namely are i) Local Fast Fourier
Transformation, ii) Directional Fourier Filtering and iii) Fast Enhancement
Fingerprint Algorithm.
DeLaRue Printrak Inc. (Printrak, 1985) developed a fingerprint
pre-processing filter using local Fast Fourier Transform (FFT) technique. In this
technique, the fingerprint image is divided into 32 by 32 tiles starting from the upper
left hand corner and each tile is subsequently processed by the filter. Once a tile is
processed, the filter shifts right 24 pixels to obtain the next 32 by 32 tile. In the new
tile, the first 8 columns of the tiles become the last 8 columns of the previous tiles.
After reaching the right side of the image, the filter shifts down 24 pixels. In the new
tiles, the first 8 rows of tiles become the last 8 rows of the previous vertically
adjacent tiles. The process continues until the whole image is processed in this
manner. Each tile is filtered individually by an FFT. The FFT of each tile is
computed, and very low and very high spatial frequencies are set to zero. Then the
power spectrum of the FFT is computed as:
2 2
jk jk jk
P = X +Y
where X2jk is the real part of the FFT and Yjk2 is the imaginary part of the FFT. The
elements of P are raised to a power of αand multiplied by FFT elements X +iYto obtain new elements U+iV as follows:
, V
jk jk jk jk jk jk
20
To obtain the filtered tile, the inverse FFT of U+iV is computed. The real part is used to reconstruct the filtered tiles. In an image reconstruction, the center 24 x 24
pixels is saved and the outer 4 rows and columns are discarded from each filtered
32 x 32 pixel tile.
Sherlock et al (1994) first defined fingerprint enhancement by directional
Fourier filtering. Sherlock used a combination of a spatial filter and a directional
filter, which multiplies the spatial and the directional filters together. Sherlock
defined the filter expression asH( , )ρ φ =Hspatial( ) *ρ Hangle( )φ . Ikonomopoulo et al
(1984, 1985) and Kunt et. al (1985) introduced a directional filtering approach for
texture discrimination. In their work, they isolated the edge information belonging to
a limited number of directions using a directional filter such that its frequency
response covers a set of frequencies, which are within a directional range. They used
*
i i
G =H W as directional filter.
Hong (1998) introduced a fast fingerprint enhancement algorithm, which can
improve the clarity of ridge and furrow structures of input fingerprint images based
on the estimated local ridge orientation and frequency. A grey level fingerprint
image, I, is defined as N x N matrix, where I (i, j) represents the intensity of the pixel at the ith row and jth column. It is assumed that all the images are scanned at a resolution of 500 dots per inch (dpi), recommended by FBI.
2.7 Directional Image
The directional image describes the basic shape of the fingerprint and
represents an intrinsic nature of the fingerprint images. It defines the local orientation
of the ridge-valley structures. The directional image takes into account the locations
particularly important for fingerprint images as they consist of ridges and valleys. In
a fingerprint directional image, each pixel represents the local orientation of the
ridges. Here, we review Mehtre based algorithm, Iterated Least Square and
Directional Image.
2.7.1 Mehtre
Mehtre and Murthy (1987) introduced the concept of directional image for
fingerprints. They also investigated other images that consist of only background and
foreground. In their research, they developed a segmentation method for directional
images. They concluded that the directional image is an image transformation, where
each pixel of the image represents the directions of the local grey level uniformity.
The directional image is a transformed image of the original. It represents the local
orientations of the ridges.
2.7.2 Iterated Least Mean Square Orientation Estimation Algorithm
The orientation field of a fingerprint image represents an intrinsic nature of
the fingerprint image and defines invariant coordinates for ridges and furrows around
each local neighbourhood, which plays a very important role in fingerprint image
analysis. Hong (1998) introduced the iterated least mean square orientation
estimation by viewing the fingerprint image as an oriented texture. An orientation
image,O defined as N x N image, where O i j( , )represents the local ridge orientation
22
every pixel: an image is divided into a set of w x w non-overlapping blocks and a single local ridge orientation is defined for each block.
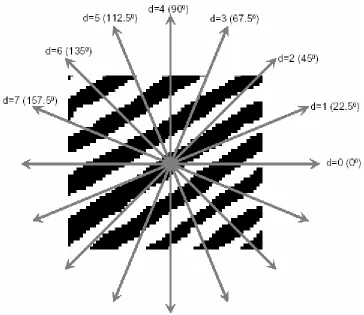
2.7.3 Directional Mask
Stock and Swonger (1969) originally proposed the algorithm, which initially
was used to change a grey scale image to a binary image, which has been converted
into a detector of ridge orientation at each pixel. Approaches that utilise a scheme
similar to Stock and Swonger’s (1969) algorithm include Candela et al. (1995), Karu and Jain (1996), and Capelli et al. (1998).
Figure 2.8(a) shows an example of a direction mask used in Candela et al. (1995), which has a size of 9 × 9, centred at C. This mask can estimate eight directions for each pixel. The slit sums for each pixel in an image si, i = 1…8 are
computed as in the example provided. Each si is the sum of the value of the slit of
four pixels labelled i in the figure. Let 0≤ p q, ≤7 be indices such that:
0...7 0...7 min , max . p i i q i i s s s s = = = =
The direction at a pixel defined to be p if the centre pixel is located on a ridge (dark area) and q if the centre pixel is located in a valley. If the centre pixel has C value, then its direction is given by:
(
)
3 78 0
4
.
p q i i
p if C s s s
d
q otherwise
=
⎧ + + >
⎪ = ⎨ ⎪⎩
Figure 2.8 Direction masks. Each number represents an angle. (a) 8-way
direction mask. (b) 4-way direction mask
2.8 Segmentation
Fingerprint segmentation is a process to separate the foreground image
(ridges) from the background image (furrows) and to produce a binary image from
the grey scale image. Segmentation also removes noise in the process. Segmentation
is defined as a process to identify and group pixels with the same attributes in a
region or block. There are a few methods to produce segmentation, such as statistical
classification, thresholding, edge detection and region detection. The simplest and
most recognized method of segmentation is thresholding. Thresholding involves
looking at each pixel and deciding whether it should be converted into black or white
pixel. This decision is made by comparing each pixel value with a constant called a
threshold level or threshold value. If the pixel value is less than the threshold value,
4 3 2
1 1
2 3 4
C
(a) (b)
2 3 4 5 6
1 2 3 4 5 6 7
1 7
0 0 0 0
7 1
7 6 5 4 3 2 1
6 5 4 3 2
24
the pixel is set to black; otherwise, it is set to white. Four techniques will be
reviewed here, which are i) Global Thresholding, ii) Regional Average Thresholding,
iii) Histogram Based Thresholding and iv) Niblack Binarization.
2.8.1 Global Thresholding
Global Thresholding technique is also known as Simple Thresholding. This
technique is the easiest compared to the other existing techniques. It is based on one
single and permanent threshold value, which is applied to all the pixels in an image.
For example, if the threshold value is set to 128, then any pixel value that is less than
128 will be converted into black (or white).
2.8.2 Regional Average Thresholding
The Regional Average Thresholding (Emiroglu, 1997) divides the original
image into any one of the 16 x 16, 16 x 8, 8 x 8, 8 x 4, 4 x 4 or 4 x 2 regions of
windows sizes. The Regional Average Thresholding is applied on each region by
using the grey level average of the related region as a threshold value.
2.8.3 Histogram-based Thresholding
Histogram-based image thresholding or segmentation is one of the simplest
and most often used segmentation techniques. Histogram based segmentation
depends on the histogram of the image. It uses the histogram to select the grey levels
for grouping pixels into regions. There are two entities in a simple image: the
background and the object. The background is generally one grey level and occupies
The object or subject of the image forms another grey level, which shapes a smaller
peak in the histogram. Therefore, the histogram must be designed first.
2.8.4 Niblack Binarization
Niblack Binarization algorithm is a robust thresholding in the presence of
shadows and other image defects (D. Trier, 1997). The idea of this method is to vary
the threshold values over the image based on local mean and standard deviation. The
local mean and standard deviation are calculated and then added to the product of
predefined weight constant and the standard deviation.
2.9 Thinning
An effective edge thinning algorithm is very important in an image
segmentation and object identification. It increases the possibility of success by
detecting the objects in the image and saves the processing time in the subsequent
steps such as labelling and image transformation. The aim of the thinning algorithm
is to make the fingerprint image much simpler in feature extraction. The thinning
algorithm produces an image where all ridges are one pixel wide (known as
skeletons). This process acquires a binary image as input. One major advantage of
the thinning process is the reduction of memory space required for storing the
essential structural information presented in a pattern. Moreover, it simplifies the
data structure required in a pattern analysis. There are four techniques for thinning
algorithm, namely are i) Safe Point Thinning Algorithm, ii) Two-Way Pass, iii) Fast
Thinning Algorithm and iv) Ridge Line Following Thinning Algorithm.
Connectivity is an important property that must be preserved in the thinned
object. Border pixels are removed in such a way that the object connectivity is still
26
1. They maintain connectivity at iteration. They do not remove border pixels
that may cause discontinuities.
2. They do not shorten the end of thinned shape limbs.
2.9.1 Safe Point Thinning Algorithm
Nachacce and Shinggal (1984) proposed the Safe Point Thinning Algorithm
(SPTA) technique, which consists of executing many passes over the pattern, where
in each pass, a few dark points are flagged. A flagged point is an edge-point, but not
an end-point, nor a break--point and nor must its deletion cause excessive erosion in
the pattern. Edge-point is a dark point that has at least one white 4-neighbour. On the
other hand, end-point is a dark point that has at most one dark 8-neighbour.
Break-point is a dark Break-point, where the deletion which would break the connectivity of the
original pattern.
SPTA technique must satisfy the different conditions in order to delete certain
points. This depends on the following conditions:
1. an edge-point,
2. an end-point, and
3. it satisfies the pre-defined template match windows (break-point).
SPTA has a few steps as follows:
1. Test whether a point is an edge-point or not.
2. Test whether an edge-point is an end-point or not,
3. Test whether its deletion will cause disconnectedness or not (if not, flag
it).
4. At the end of each pass, delete all flagged points.
For step one, SPTA tries to identify an edge-point as one or more of the following
four types:
2. A right edge-point having a white right neighbour,
3. A bottom edge-point having a white bottom neighbour,
4. A top edge-point having a white top neighbour.
Here, an edge-point can be more than one type. A pass in the SPTA consists of two
scans instead of one single scan for each pass, where a scan examines every point in
the pattern. In the first scan, all left edge-points and all right edge-points that are not
respectively left safe-points and right safe-points are flagged. Similarly, in the second
scan, the corresponding top edge-points and bottom edge-points are also flagged.
2.9.2 Two-way Pass
The Two-way Pass technique requires two successive iterative passes which
are described in Zha and Gon (in Gonzalez, 1992). In step 1, a logical rule P1 is
applied locally in a 3x3 neighbourhood to flag border pixels that can be deleted.
These pixels are only flagged, and not deleted, until the entire image is scanned.
Deletion of all flagged pixels is performed afterwards. In Step 2, another logical rule
2
P is applied locally in a 3x3 window to flag border pixels for deletion. After the
entire image has been scanned, the flagged pixels are then deleted. This procedure is
applied iteratively, until no more thinning can be performed.
2.9.3 Fast Thinning Algorithm
The main objective of using the Fast Thinning Algorithm (FTA) is to obtain
the skeleton of an image. There are two main steps in the FTA that are repeated until
28
contour of the image is marked. The contour of an image is formed by a pixel that is
found in the innermost and most distant position of this image. In the second step, the
marked contour is analyzed to verify which pixels belonging to this contour that
should be deleted.
2.9.4 Ridge Line Following Algorithm
Emiroglu (1998) proposed the thinning algorithm based on the Ridge Line
Following Algorithm, which is used only on threshold fingerprint images. The
algorithm uses black pixels as the ridges of the fingerprints. The thinning algorithm
presented here is designed particularly for fingerprint images. Before the thinning
operation starts, it is necessary to obtain a block directional image which produces
the direction of each pixel value in a fingerprint image. The aim of the thinning
algorithm is to remove redundant black pixels in the image and to produce a thinned
image.
2.10 Minutiae Extraction
Fingerprint feature extraction is also known as minutiae extraction. In this
stage, the minutiae are extracted from the thinned fingerprint images. In this minutiae
extraction stage, only the bifurcations and ridge endings known as basic or primitives
from thinned images. Other minutiae such as lakes, pores and hooks are disregarded
since they are essentially a combination of these basic minutiae. Each extracted
minutiae have four attributes, which are i) x-coordinate, ii) y-coordinate, iii) minutiae
direction and iv) minutiae type. There are two methods mainly used for fingerprint
2.10.1 Crossing Number
The Crossing Number (CN) determines the ridge ending and ridge bifurcation
using the equation below (Mehtre, 1993).
8
1 9 1
1
0.5 i i ,
i
CN p p+ p p
=
=
∑
− =These technique works on a 3x3 regions. With the value of CN, the property of CN is
determined. CN has three major properties: i) ridge ending, ii) ridge bifurcation, and
iii) connecting ridges.
2.10.2 Template
Emiroglu (1998) and Hong (1998) used a template in minutiae extraction.
Using template or mask window of size 3x3 pixels centered at the black pixel, the
algorithm finds the number of pixels, N, within the window. The value N will determine the features of the minutiae.
2.11 Matching
Given two minutiae patterns, an input and a template, the minutiae matching
algorithm determines whether they are from the impressions of the same finger.
There are three approaches for this purpose, which are Template Matching,
30
2.11.1 Template Matching
The template matching algorithm attempts to match a set of minutiae
obtained from a scanned fingerprint with a previously stored template. In this
algorithm, the classic ridge counting is not performed as this also increases the
possibility of false rejection without seriously affecting the false acceptance rate. The
matching is based on the minutiae features (Sun et al, 1996).
2.11.2 Alignment Based Algorithm
Hong (1998) developed an alignment-based matching algorithm, which is
simple in theory, efficient in discrimination and fast in speed. The algorithm
decomposes the minutiae matching into two stages: (i) alignment stage and (ii)
matching stage. In the alignment stage, an alignment hypothesis, including
translation and rotation between the input and the template are first generated and the
input minutiae are aligned with the template minutiae according to the hypothesis. In
the matching stage, the input minutiae and the template minutiae are first converted
to a string representation in the polar coordinate system. An elastic string matching
algorithm is used to evaluate the similarity between the two strings. The hypothesis
that results in the largest similarity value is determined as the optimal alignment. The
2.11.3 The Flexible Matching Algorithm (The Matcher)
A flexible matching algorithm approach was described by Akhan and
Emiroglu (1995a, 1995b). This matching algorithm allows the adjustment of the
degree of matches. The extracted features from the fingerprint image, such as
location and angle are allowed to deviate by user definable margins. The algorithm
offers likely matches to the extracted features of the compressed database using
CHAPTER 3
METHODOLOGY
3.1 Overview
This chapter provides detailed discussion and explanation of selected
methods from the literature review. In this chapter, the discussion goes through each
stage of the fingerprint identification process. The discussion involves fingerprint
pre-processing and enhancement, directional image, fingerprint reconstruction,
fingerprint segmentation, fingerprint thinning, fingerprint minutiae extraction and
fingerprint matching.
3.2 Fingerprint Pre-Processing and Enhancement
Noise effect always exists in digital images. The noise in digital images
cannot be verified 100% because of its random behaviour. In fingerprint images,
Noise damages the structures of images, which could lead to a failure or false
minutiae extraction.
Filter processing is used to remove the noise and enhance the fingerprint
images. In this stage, fingerprint images are filtered using the spatial domain
technique. The use of spatial mask for image processing is usually called spatial
filtering. The mask itself is called spatial filter. There are a few techniques to remove
noise, such as sharpening filter, smoothing filter and histogram modelling. Figure 3.1
shows the original fingerprint image that is used for fingerprint pre-processing and
enhancement.
Figure 3.1 Original fingerprint image
3.2.1 Smoothing Filter
Smoothing filter is used for blurring and noise reduction. Blurring is a
common pre-processing step to remove small details when the aim is the location of
a large object. The smoothing filter technique involves:
1. Averaging
34
3. Median
4. Maximum
5. Low Pass
6. Hexagonal Grid
In averaging filtering, centered pixels in spatial mask are replaced with the average
value of spatial mask. The sizes of spatial mask are usually 3x3, 5x5 and 9x9. Figure
3.2 shows the original pixel values before averaging filter.
64 64 64
64 255 255
64 64 255
Figure 3.2 Original pixel values before averaging filter
The new value obtained for the center pixel using 3x3 average filters is:
(64+64+64+64+255+255+64+64+255)/9=128
Figure 3.3 shows the new pixel value and new fingerprint image after the average
64 64 64
64 128 255
64 64 255
Figure 3.3 New pixels values and new fingerprint image after the average value
is obtained.
Median Filter may be used when the aim is to achieve noise reduction with a
minimum amount of blurring. This means that the grey level of each pixel is replaced
by the median of the grey levels in a neighbourhood of that pixel, instead of by
averaging. Median Filter method is particularly effective when the noise pattern
consists of strong and spike like components and the characteristic to be preserved is
edge sharpness. In order to perform median filtering in a neighbourhood of a pixel,
the values of the pixel and its neighbours are sorted first, the median is determined,
and the value to the pixel is assigned. For example in a 3x3 neighbourhood, the
median is the 5th largest value; while in a 5x5 neighbourhood, the median is the 13th
largest value, and so on. In Figure 5.2, the 3x3 neighbourhood has a value of 64, 64,
64, 64, 255, 255, 64, 64, and 255. These values are sorted as 64, 64, 64, 64, 64, 64,
255, 255, 255, which result in a median of 64. Figure 3.4 shows the pixel values and
36
4 64 64
64 64 255
64 64 255
Figure 3.4 Pixel values and the new fingerprint image after median filtering
Minimum filtering has the same process as median filtering. Median filter determines
the median value within a neighbourhood while the minimum filter determines the
first value in the neighbourhood. For example, in Figure 3.2, the 3x3 neighbourhood
has a value of (64, 64, 64, 64, 255, 255, 64, 64, 255) and after sorting, this
neighbourhood has a value of (64, 64, 64, 64, 64, 64, 255, 255, 255) and the
minimum value is 64 (Figure 3.5). Maximum filtering will also go through the
similar process. However, this technique only determines the last value in the
neighbourhood. For example, the sorted 3x3 neighbourhood, the maximum value is
64 64 64
64 64 255
64 64 255
Figure 3.5 Pixel values and the new fingerprint image after minimum filtering
64 64 64
64 255 255
64 64 255
Figure 3.6 Pixel values and the new fingerprint image after maximum filtering
Low-Pass filtering allows low spatial frequency to pass unchanged but high
38
obscure fine details. Low-Pass is suitable for images where the noise has strong high
frequency component. Figure 3.7 shows the mask filter for Low-Pass filtering.
1 2 1
2 4 2
1 2 1
Figure 3.7 Low-Pass filter masks
For example, filter 3x3-neighbourhood value (64, 64, 64, 64, 255, 255, 64, 64, and
255) with Low-Pass mask:
64*1+64*2+64*1+64*2+255*4+255*2+64*1+64*2+255*1=144
Figure 3.8 shows the pixel values and the new fingerprint image after Low-Pass
filtering.
64 64 64
64 144 255
64 64 255
Figure 3.8 Pixel values and the new fingerprint image after Low-Pass filtering
3.2.2 Sharpening Filter
Sharpening filter is used for highlighting fine details or enhancing the
details of a fingerprint image. A sharpening filter seeks to emphasize changes. The
sharpening techniques are:
1. High Pass
2. High Boost
High pass filtering is accomplished using a kernel containing a mixture of positive
and negative coefficients. An omni-directional high pass filter, specifically one
whose response is the same in whatever the direction in which grey level varies,
should have positive coefficients near its centre and negative coefficients in the
periphery of the kernel. Figure 3.9 shows the classic implementation of 3x3
40
-1 -1 -1
-1 8 -1
-1 -1 -1
Figure 3.9 A High-Pass spatial mask filter
Note that the sum of the coefficients is 0. This means that when the kernel is over an
area of constant or slowly varying grey level, the result of convolution is zero or
some very small number. However, when the grey level varies rapidly within the
neighbourhood, the result of convolution can be a large number. This number can be
positive or negative, because the kernel contains both positive and negative
coefficients. Figure 3.10 shows the fingerprint image after High Pass filter.
Figure 3.10 Fingerprint image after applying the High Pass filter
Using a high boost approach, we can compute a weighted sum of the original image
and the output from a high pass filter. The result is an image in which high spatial
frequencies are emphasised relative to lower frequencies. The degree of emphasis
achieved depends on the weight given to the original andhigh pass filtered images.
This high boost filter can be used to sharpen an image. Be informed that high boost
filtering in a single convolution operation can be performed using the kernel shown
in Figure 3.11.
1 1 1
1 1 (c > 8)
1 1 1
c
− − −
⎡ ⎤
⎢− − ⎥
⎢ ⎥
⎢− − − ⎥
⎣ ⎦
Figure 3.11 A High Boost spatial filter
When the central coefficient c is large, the convolution will have little effect on an image. As c gets closer to 8, the degree of sharpness increases. If c = 8, the kernel becomes the high pass filter as described earlier in Figure 3.9. Figure 3.12 shows the
fingerprint image after applying the High-Boost filter where c=9.
Figure 3.12 Fingerprint image after applying High Boost Filter where c=9
3.2.3 Histogram Equalization
Histogram Equalization is a technique to modify an image so that its
histogram has a desired shape. This is useful in stretching the low-contrast levels of
images with narrow histograms.
A useful approach to digital image processing is to consider image
42
(pdf)p ff( ). Pdf image carries valuable global information about image content. However, the pdf is generally not available and must be estimated from the image
itself by using the empirical pdf, usually called the histogram. Let us assume that a
digital image has L discrete grey levels (usually from 0 to 255) and that
, 0,..., 1
k
n k= L− is the number of pixels having kintensity. The histogram ˆ ( )p ff is given by the equation below:
ˆ ( )f nk
p f n
= k=0,1,...,L−1
(Equation 3.1)
where n is the total number of image pixels. The image histogram can be calculated
easily, as can be seen in Equation 3.1.
The image histogram carries important information about the image
content. If its pixel values are concentrated in the low image intensities, as in Figure
3.13(a), the image is dark. A bright image has a histogram that can concentrate in the high image intensities, shown in Figure 3.13(b). The histogram of Figure 3.13(c)
reveals that the image contains two objects with different intensities (or possibly one
object being clearly distinguished from its background). If the image histogram is
concentrated on a small intensity region, the image contrast is poor and the
subjective image quality is low. Image quality can be enhanced by modifying its