University of Windsor University of Windsor
Scholarship at UWindsor
Scholarship at UWindsor
Electronic Theses and Dissertations Theses, Dissertations, and Major Papers
2012
ELEVATED TEMPERATURE LUBRICATED WEAR OF Al-Si ALLOYS
ELEVATED TEMPERATURE LUBRICATED WEAR OF Al-Si ALLOYS
Sanjib Dey
University of Windsor
Follow this and additional works at: https://scholar.uwindsor.ca/etd
Recommended Citation Recommended Citation
Dey, Sanjib, "ELEVATED TEMPERATURE LUBRICATED WEAR OF Al-Si ALLOYS" (2012). Electronic Theses and Dissertations. 457.
https://scholar.uwindsor.ca/etd/457
This online database contains the full-text of PhD dissertations and Masters’ theses of University of Windsor students from 1954 forward. These documents are made available for personal study and research purposes only, in accordance with the Canadian Copyright Act and the Creative Commons license—CC BY-NC-ND (Attribution, Non-Commercial, No Derivative Works). Under this license, works must always be attributed to the copyright holder (original author), cannot be used for any commercial purposes, and may not be altered. Any other use would require the permission of the copyright holder. Students may inquire about withdrawing their dissertation and/or thesis from this database. For additional inquiries, please contact the repository administrator via email
ELEVATED TEMPERATURE LUBRICATED WEAR
OF Al-Si ALLOYS
SANJIB K. DEY
A Dissertation
Submitted to the Faculty of Graduate Studies
through Engineering Materials
in Partial Fulfillment of the Requirements for
the Degree of Doctor of Philosophy at the
University of Windsor
Windsor, Ontario, Canada
2011
Elevated Temperature Lubricated Wear of Al-Si Alloys
By
Sanjib K. Dey
APPROVED BY
Zoheir Farhat, External Examiner
Materials Engineering, Dalhousie University
Niharendu Biswas, Outside Program Reader
Civil and Environmental Engineering
William J. Altenhof, Program Reader
Mechanical, Automotive and Materials Engineering
Afsaneh Edrisy, Program Reader
Mechanical, Automotive and Materials Engineering
Ahmet T. Alpas, Advisor
Mechanical, Automotive and Materials Engineering
Behnam Shahrrava, Chair of Defense
Electrical and Computer Engineering
Page | iii
DECLARATION OF CO-AUTHORSHIP/PREVIOUS PUBLICATION
Co-authorship declaration
I hereby declare that this dissertation incorporates documentation of research work
performed by the author under the supervision of Prof. A. T. Alpas. The numerical simulation
work was performed under the guidance of Dr. W. J Altenhof and Prof. A. T. Alpas. The
collection of electron images using transmission electron microscope was performed jointly by
Dr. X. Meng-Burany, Michael P. Balogh and the author at General Motors Global Research and
Development. The interpretation of these images was performed by the author. Dr. T.A. Perry
and Dr. M. J. Lukitsch assisted with the provision of sample and brought an industrial
perspective during the discussions of the results analysed by the author.
Declaration of previous publications
This dissertation includes material from two original peer reviewed journal articles that
have already been published and one more journal article to be submitted for publication in
peer reviewed journal.
Thesis Chapter Publication title/ full citation Publication Status
Chapter 4 Micromechanisms of low load wear in an Al-18.5% Si alloy Published
Chapter 5 Ultra-mild wear mechanisms of Al–12.6 wt.% Si alloys at elevated temperature Published
Chapter 7 Numerical Simulation of UMW mechanisms in Al-Si alloys To be submitted
I certify that I have obtained a written permission from the copyright owner(s) to
include the above published material(s) in my thesis. I certify that the above material describes
Page | iv I declare that, to the best of my knowledge, my dissertation does not infringe upon
anyone’s copyright nor violate any proprietary rights and that any ideas, techniques, quotations,
or any other material from the work of other people included in my dissertation, published or
otherwise, are fully acknowledged in accordance with the standard referencing practices.
Furthermore, to the extent that I have included copyrighted material that surpasses the bounds
of fair dealing within the meaning of the Canada Copyright Act, I certify that I have obtained a
written permission from the copyright owner(s) to include such material(s) in my thesis.
I declare that this is a true copy of my dissertation, including any final revisions, as
approved by my thesis committee and the Graduate Studies office, and that this thesis has not
Page | v
ABSTRACT
Cast hypereutectic Al-Si alloys made monolithic engine blocks is an outcome of the
global drive towards lightweight vehicles. Eutectic alloys provide cost effective alternative to
those expensive hypereutectic alloys. However, the tribological performances of the eutectic
alloys needed rigorous evaluation and the objectives of this dissertation were to investigate the
ultra-mild wear (UMW) mechanisms of eutectic Al-12.6%Si alloys, chemical and mechanical
properties of tribolayers and their long term stability at elevated temperatures under boundary
lubricated conditions.
Sliding experiments were conducted using 5W30 engine oil on three etched Al-Si alloys
containing 12-25% silicon at temperatures between 25 °C and 160 °C for sliding cycles up to
6×10⁶ revolutions. Statistical measurements based on optical profilometer were carried out to
quantify UMW damage parameters and volumetric loss. A criterion to asses UMW damage was
then developed. Numerical models containing single- and multi-particle were developed to
conduct a parametric study investigating the effect of different matrix yield strength and strain
hardening characteristics, and the tribofilm formation on UMW damage parameters.
UMW in Al-18.5%Si alloy lasted up to 104 cycles at 5.0 N load. In the eutectic alloy, three
stages of UMW were identified at 25 and 100 °C at 2.0 N load, and UMW performance at 100 °C
was found to be superior to that at 25 °C. At elevated temperatures, island-like tribofilm
formation on silicon particles and the composition of oil-residue layer were the characteristic
differences compared to 25 °C. The island like-tribofilm consisted of zinc sulphide and short
chain zinc pyrophosphate, and the ORL was formed by mixing of tribofilm with aluminum
Page | vi the effectiveness of it in maintaining UMW. Findings from the numerical study were in good
agreement with experimental observations. The parametric study showed that higher yield
strength and strain hardening exponent of the matrix, and presence of tribofilm on silicon were
beneficial in prolonging UMW and delayed the transition of UMW-I to UMW-II stage. The
experimental findings suggested that the eutectic alloy can be used as a cost effective
Page | vii
DEDICATION
Page | viii
ACKNOWLEDGMENTS
I would like to take this opportunity to express my sincere gratitude to my advisor
Prof. Ahmet T. Alpas for accepting me as a student under his guidance and spending his valuable
time and effort for steering me to conduct scientific research. I am very thankful for his
encouragement, support and patience throughout my tenure as a graduate student at
University of Windsor. I also would like to thank Dr. William J. Altenhof for his valuable time and
effort in teaching me to conduct numerical simulations. I am grateful for the opportunity of
studying and conducting research under their guidance.
I wish to thank my committee members: Dr. Afsaneh Edrisy and Prof. Niharendu Biswas
for their time and invaluable suggestions. I acknowledge Dr. Xianying Meng-Burany for taking
TEM images used in this dissertation. I would like to acknowledge Dr. Anil Sachdev, Dr. Michael
J. Lukitsch and Dr. Thomas A. Perry from General Motors Global Research and Development for
their support, guidance and many insightful discussions. I would also like to thank Nicholash
Irish, Michael P. Balogh and Daad Haddad from General Motors Global Research and
Development for their assistance in XPS, TEM and nanoindentation characterization. I would
also like to thank Dr. S. Reyntjens of FEI for carrying out EDS maps and FIB milling.
I would like to thank Mr. P. Seguin, Mr. Robinson, Mr. Gang Li and the members of the
technical support centre at the University of Windsor for their technical support during the
course of the research work. I also want to thank Ms. B. Tattersall for her administrative
Page | ix I wish to express thanks to all the past and current fellow researchers of the
NSERC/General Motors of Canada Industrial Research Chair in Tribology of Lightweight Materials
for their help and friendship.
I would like to acknowledge financial support from Natural Science and Engineering
Council (NSERC) and General Motors of Canada through the Industrial Research Chair program
at the University of Windsor. I am also thankful for the financial assistance from Ontario
Government and University of Windsor through Ontario Graduate Scholarship in Science and
Technology (OGSST) awards and In-Program Doctoral Tuition Scholarship awards.
I would also like to thank my parents, Mr. S. L. Dey and Mrs. G. Dey, my parents-in-law,
Mr. S.C. Das, and R. Das for their love and affection. I am thankful to my brother, Santosh, my
sister, Soma, my brother-in-law, Arindam and my sister-in-law, Gopa for taking care of many of
my responsibilities which allowed me to concentrate on my study and research far away from
home. Finally, there are no words to thank enough my dear wife Sarmistha for her love,
Page | x
TABLE OF CONTENTS
DECLARATION OF CO-AUTHORSHIP/PREVIOUS PUBLICATION... iii
ABSTRACT ... v
DEDICATION ... vii
ACKNOWLEDGMENTS ... viii
LIST OF TABLES ... xvi
LIST OF FIGURES ... xvii
LIST OF APPENDICES ... xxvi
NOMENCLATURE... xxvii
1. CHAPTER 1– INTRODUCTION ... 1
1.1 Overview ... 1
1.2 Objectives of this research ... 3
1.3 Organization of the dissertation ... 4
2. CHAPTER 2 – LITERATURE REVIEW ... 6
2.1 Introduction ... 6
2.1.1 Al-Si alloys as an engine block material ... 6
2.1.1.1 Microstructure and properties of cast 3xx series alloys ... 7
2.1.1.2 Effect of alloying additions in Al-Si alloys ... 8
2.1.2 Dry sliding wear of Al-Si alloys ... 9
2.1.2.1 Tribological behaviour of Al-Si alloys in dry sliding ... 9
2.1.2.2 Effects of silicon content on dry sliding of Al-Si alloys ... 12
2.1.2.3 Effects of silicon particle morphology... 14
2.1.3 Tribo-layers in dry sliding of Al-Si alloys ... 15
2.1.4 Lubrication in automotive engines ... 17
2.1.4.1 Lubrication regimes ... 17
2.1.4.2 Lubricants and additives ... 19
2.1.5 Lubricated sliding of Al-Si alloys ... 20
2.1.5.1 Tribological behaviour of Al-Si alloys in lubricated sliding... 20
2.1.5.2 Tribolayer formation and characterization in lubricated sliding ... 23
Page | xi
2.1.6 Ultra-mild wear (UMW) ... 28
2.1.6.1 Laboratory studies ... 29
2.1.6.2 Engine dynamometer studies ... 32
2.1.7 Summary of UMW in Al-Si alloys at room temperature ... 34
3. CHAPTER 3 – MATERIALS AND EXPERIMENTAL METHODS ... 55
3.1 Introduction ... 55
3.2 Al-Si alloys used in the study... 55
3.2.1 Sample preparation to observe and quantify the microstructure ... 55
3.2.1.1 Microstructure of Al-12.6% Si alloy ... 56
3.2.1.2 Microstructure of Al-18.5% Si alloy ... 56
3.2.1.3 Microstructure of Al-25.0% Si alloy ... 57
3.2.2 Hardness of the alloys ... 57
3.3 Lubricated wear testing method ... 58
3.3.1 Surface preparation of Al-Si alloys ... 58
3.3.2 Lubricated wear testing ... 59
3.3.3 Static counterface material and surface preparation ... 59
3.3.4 Lubrication method and lubricant ... 60
3.4 Surface and subsurface damage observation and characterisation ... 62
3.4.1 Optical methods based surface characterisation ... 62
3.4.1.1 Optical microscopy ... 62
3.4.1.2 White-light based interferometry ... 63
3.4.2 Analytical electron and x-ray based surface characterisation ... 63
3.4.2.1 Scanning electron microscopy and energy dispersive x-ray spectroscopy ... 64
3.4.2.2 X-ray photoelectron spectroscopy ... 64
3.4.2.3 X-ray absorption near edge structure spectroscopy ... 65
3.4.3 Subsurface microstructure observation and characterisation ... 66
3.4.3.1 Focused ion-beam milling ... 66
3.4.3.2 Transmission electron microscopy ... 66
3.5 Quantification of surface damage parameters ... 67
3.5.1 Statistical measure of silicon particle height after etching ... 68
3.5.1.1 Particle height in Al-12.6% Si alloys ... 68
Page | xii
3.5.1.3 Particle height in Al-25.0%Si alloys ... 69
3.5.2 Silicon particle and aluminum pile-up height measurement after wear test ... 69
3.5.3 Aluminum matrix wear loss measurement ... 70
3.6 Numerical Model Development ... 71
3.6.1 Geometry of silicon particle(s) and aluminum matrix ... 71
3.6.1.1 Single-particle model ... 71
3.6.1.1.1 Modeling of the silicon particle ... 72
3.6.1.1.2 Modeling of the aluminum matrix ... 72
3.6.1.2 Multi-particle model ... 73
3.6.1.2.1 Acquiring 2D parallel images ... 74
3.6.1.2.2 Image processing ... 74
3.6.1.2.3 Generation of surface and volume mesh ... 75
3.6.1.2.4 Discretized microstructure of the multi-particle model ... 75
3.6.2 Pile-up and sink-in simulation procedure ... 76
3.6.2.1 Single-particle model ... 76
3.6.2.2 Multi-particle model ... 78
3.6.2.3 Choice of integration method ... 79
3.6.3 Material and material model for the aluminum matrix... 79
3.6.4 Material Model Validation ... 80
3.6.4.1 Tensile Testing ... 80
3.6.4.2 Compression Testing ... 81
3.6.5 Energy balance ... 81
3.6.6 Assumptions in finite element simulation ... 82
4. CHAPTER 4 – REALM OF UMW IN HYPEREUTECTIC Al-Si ALLOY ... 108
4.1 Introduction ... 108
4.2 UMW and MW characteristics – surface damage ... 108
4.2.1 Silicon particle height decrease ... 108
4.2.2 Fracture and fragmentation of silicon particles ... 109
4.2.3 Microstructural evolution of worn surfaces ... 111
4.2.4 Volumetric wear loss ... 113
4.3 Counterface damage ... 113
Page | xiii
4.4.1 Micromechanisms of wear ... 114
4.4.2 Mechanics of wear: contact pressure applied to silicon particles ... 115
4.4.3 Chapter summary... 118
5. CHAPTER 5 – ELEVATED TEMPERATURE UMW OF Al-12.6% Si ALLOY ... 134
5.1 Introduction ... 134
5.2 UMW-I and UMW-II stages ... 135
5.2.1 Change in exposure height of silicon particles ... 135
5.2.2 Aluminum pile-up formation ... 136
5.3 UMW-III – Wear of the aluminum matrix ... 136
5.4 Electron microscopy of worn surfaces – microstructure evolution... 137
5.5 Formation of island-like tribofilm and oil-residue layer (ORL) ... 138
5.5.1 Island-like tribofilm on silicon particles ... 139
5.5.1.1 EDS of island-like tribofilms ... 139
5.5.1.2 Cross section imaging and HRTEM analysis of island-like tribofilms ... 140
5.5.1.3 XANES spectroscopy of island-like tribofilm ... 141
5.5.1.4 Nanomechanical properties of the tribofilm ... 142
5.5.2 Oil-residue layer (ORL) ... 143
5.5.2.1 EDS of ORL ... 143
5.5.2.2 XPS comparative analysis of ORL at 100 °C and 25 °C ... 144
5.5.2.3 Cross-sectional images and STEM characterization of ORL ... 144
5.5.2.4 Nanomechanical properties of the ORL ... 145
5.6 UMW mechanics and mechanisms of Al-12.6% Si alloy ... 145
5.6.1 Formation of island-like tribofilm and ORL ... 145
5.6.2 Effect of island-like tribofilm ... 148
5.6.2.1 Change in composite contact modulus and reduction in particle fracture ... 148
5.6.2.2 Energy absorbing entity ... 149
5.6.3 Summary of micromechanisms of Al-12.6% Si alloy ... 150
6. CHAPTER 6 – EFFECT OF TEMPERATURE ON UMW AND LONG TERM DURABILITY OF ORL 173 6.1 Introduction ... 173
6.2 Effect of different temperatures ... 174
6.2.1 Coefficient of friction ... 175
Page | xiv
6.2.3 Morphology and surface chemistry of the worn surface ... 176
6.2.3.1 Alloy sample surfaces ... 176
6.2.3.2 Counterface surfaces ... 177
6.2.4 Volumetric wear loss ... 178
6.2.4.1 Wear loss of the matrix ... 178
6.2.4.2 Wear loss of the counterface ... 178
6.2.5 Discussion and summary... 179
6.3 Long-term durability of ORL ... 180
6.3.1 Coefficient of friction ... 180
6.3.2 Morphology of the worn surfaces and the counterfaces ... 181
6.3.3 Surface chemistry of the ORL at 6×10⁶ sliding cycles ... 183
6.3.4 Volumetric wear loss ... 184
6.3.5 Discussion and summary... 185
7. CHAPTER 7 – SIMULATIONS OF UMW MECHANISMS IN UMW-I AND -II STAGES ... 211
7.1 Introduction ... 211
7.2 Single particle model... 213
7.2.1 Particle sinking-in ... 213
7.2.1.1 Stress-strain analysis ... 213
7.2.1.2 Pile-up height ... 214
7.2.1.3 Failure of the interface ... 215
7.2.2 Pile-up formation – A parametric study ... 215
7.2.2.1 Stress distribution and plastic zone size ... 216
7.2.2.2 Effect of yield strength of the aluminum matrix... 216
7.2.2.3 Effect of strain hardening exponent of the aluminum matrix ... 218
7.2.3 Effect of island-like tribofilm on top of silicon particles ... 218
7.3 Multi-particle model ... 220
7.3.1 Pile-up formation – A parametric study ... 220
7.3.1.1 Effect of yield strength of the aluminum matrix... 221
7.3.1.2 Effect of strain hardening exponent of the aluminum matrix ... 222
7.3.2 Al-Si interface failure ... 223
7.3.3 Effect of tribofilm: estimation of silicon particle fracture ... 223
Page | xv
7.5 Summary ... 227
8. CHAPTER 8 – GENERAL DISCUSSION ... 249
8.1 Effect of heat treatment ... 249
8.2 Simulation of UMW mechanisms ... 251
8.2.1 Effect of particle distribution ... 251
8.2.2 Fracture of silicon particles and decohesion of Al-Si interface ... 252
8.2.3 Energy dissipation mechanism ... 253
9. CHAPTER 9 – SUMMARY & CONCLUSIONS ... 255
9.1 Significance of the research findings ... 259
9.2 Suggestions for future work... 260
REFERENCES ... 261
APPENDICES ... 269
Appendix A1 – SEM images to generate multi-particle model ... 269
Appendix A2 – Sample input for single-particle model ... 271
Appendix A3 – Copyright releases from publications ... 278
Page | xvi
LIST OF TABLES
Table 2. 1: Typical chemical composition in (wt.%) of selected commercial Al-SI alloys [26]. ... 36
Table 2. 2: Typical mechanical and physical properties of selected commercial Al-Si alloys [26]. 36
Table 3. 1: Typical chemical composition (in wt. %) of the Al-SI alloys used in the study... 83
Table 3. 2: Brinell hardness (bulk hardness) of the alloys and Vicker’s hardness of the matrix of the alloys used in this study. The standard deviation represents the variation from atleast six measurements for Brinell and nine measurements for Vickers hardness, respectively. ... 83
Table 3. 3: Sliding wear testing parameters. ... 84
Table 3. 4: Typical properties of lubricating oil used in wear tests. ... 84
Table 3. 5: Parameters required calculating minimum lubrication thickness (hmin), composite
surface roughness (r*) and the film thickness ratio () according to equations 3.1 – 3.3. ... 85
Table 4. 1: Average length and the aspect ratio of silicon particles within WT of Al-18.5% Si alloy before fracture and after 103, 5×10³ and 104 sliding cycles. ... 120
Table 4. 2: Parameters required calculating the contact pressure distribution and maximum contact pressure variation with particle size in Figure 4. a and b. ... 120
Table 5. 1: Percentages of silicon particles fractured within the wear track at two different temperatures. ... 152
Table 5. 2: Plastic and total work during indentation (Figure 5. 11a and c) on silicon particles with tribofilm and without tribofilm ... 152
Table 6. 1: Variation in average COF, average COF in UMW-I stage, and steady state COF with temperatures. ... 187
Table 6. 2: Average surface roughness of the AISI 52100 steel counterfaces tested against Al-12.6% Si T7 alloys at five different temperatures. ... 187
Table 6. 3: Average COF of four different Al-Si alloy samples tested at 100 °C and at 2.0N normal load for 6×10⁶ sliding cycles to investigate the durability of ORL... 188
Page | xvii
LIST OF FIGURES
Figure 2. 1: Aluminum-Silicon binary phase diagram [27]. ... 37
Figure 2. 2: Wear mechanism map for aluminium alloys [39]. ... 38
Figure 2. 3: A map for wear mechanisms in aluminium alloys. The numbers in the figure represent normalized wear rate, , where is the wear rate in m3m-1 and (m2) is the nominal area of contact [41]. ... 39
Figure 2. 4: (a) Wear mechanism map for aluminium alloys. The dotted line between the two mechanisms in the mild wear delineates load and velocity conditions where the wear debris consists of 50% plate-like and 50% mechanically mixed particles [43]; (b) Wear rate map for A356 Al worn against SAE 52100 steel counterfaces. The wear rates shown on the diagram have been multiplied by 104 mm3 m-1 [44]. ... 40
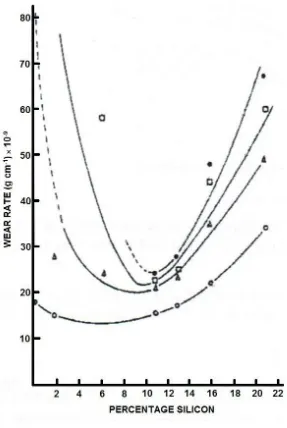
Figure 2. 5: Variation of wear rates of aluminium alloys sliding against a hard steel bush with silicon content. Loads: ο, 1 kg; ∆, 1.5 kg; , 2 kg; •, 2.5 kg [3]. ... 41
Figure 2. 6 Effect of Si particle shape (sphericity) on (a) wear coefficients, and (b) transition loads (383-as-cast vs. 383-T4); and Effect of Si particle shape (aspect ratio) on (c) wear coefficients, and (d) transition loads (as-cast of 383 vs. 383-T4) [12]. ... 42
Figure 2. 7: Schematic diagram of subsurface zones found beneath wearing surfaces, modified from Rice et al. [58] by Deuis et al. [Deuis 1997] ... 43
Figure 2. 8: Comparison of the mild-to-severe wear transition boundaries of the graphitic A356 Al–10% SiC–4% Gr and A356 Al–5% Al2O3–3% Gr composites with those of the non-graphitic composite A356 Al–20% SiC and the unreinforced matrix A356 Al alloy [8]. ... 44
Figure 2. 9: EPMA maps of the cross-sections below the worn surfaces at 10 N - (a) scattered SEM image of the area mapped, (b) Al, (c) Fe, (d) O, and (e) Si; and at 60 N - (f) back-scattered SEM image of the area mapped, (g) Al, (h) Fe, (i) O, and (j) Si [10]. Figures a-e show the tribo-layer at MW-I and f-j show the tribo-layer at MW-II regimes. ... 45
Figure 2. 10: The modified Stribeck diagram [59,62]. The x-axis is changed to film thickness ratio instead of dimensionless parameter (U/W) ... 46
Figure 2. 11: Structure of ZDDP [60]. ... 47
Figure 2. 12: 3D profilometric rendering of the lubricated slid surface of (a) polished and unetched (roughness=0.04 μm, RMS) aluminium–silicon alloy; (b) 2D profile of the cross section normal to the sliding direction seen in (a). 3D profilometric rendering of the lubricated surface of (c) etched (roughness=1 μm, RMS); (d) 2D profile of the cross-section normal to the sliding directions of grooves seen in (c) At load = 2.0 N and after 500 laps of sliding cycles [67]. ... 48
Figure 2. 13: Phosphorous L-edge XANES spectra of unreacted ZDDP, model compound Zn4P6O19, and three tribofilms. An example of peak fitting for tribofilm A performed on the P L-edge data to determine the relative peak heights pf peaks a, b, and c is included. Tribofilm B was made at 200 °C and tribofilm D was rubbed for 720 min [80]... 49
Page | xviii Figure 2. 15: (a) Change in the silicon particle height projected above the aluminum matrix with the sliding; 3D surface profile image showing the surface damage in (b) Al–11% Si alloy; (c) Al– 12% Si alloy, after sliding to 1.1×10³ m [92]. ... 51
Figure 2. 16: (a) Variation of the mean silicon particle height with sliding cycles. Silicon particle elevation does not change with sliding distance in Al–18.5% Si (full circles), but an abrupt decrease after sliding to 103 cycles was observed in Al–12% Si (open circles); (b) 3-D optical surface profile image of Surface damage in Al–18.5% Si after sliding to 6×10⁵ cycles [93]. ... 52
Figure 2. 17: Cross-sectional TEM image of the microstructure of the material under the wear track showing ultra-fine aluminum grains around the silicon particle and the oil residue layer in Al-25% Si alloy; (b) Variation of volumetric wear with sliding cycles in Al–11% Si in comparison with Al–25% Si. (All plots with zero volumetric loss were shifted vertically for clarity) [94]. ... 53
Figure 2. 18: Stereographic photos of the two major and minor surfaces with the indications of different wear types [96]. ... 54
Figure 3. 1: (a) Typical optical microstructure of Al-12.6wt.% Si alloy showing distribution of silicon particles and intermetallic phases; (b) and (c) histogram of silicon particles length and width, respectively. ... 86
Figure 3. 2: (a) Typical optical microstructure of the Al-18.5% Si alloy showing various phases present; histogram shows the (b) length and (c) width of Si particles present in the alloy. ... 87
Figure 3. 3: (a) Typical optical microstructure of the Al-25.0% Si alloy showing various phases present; histogram shows the (b) length and (c) width of Si particles present in the alloy. ... 88
Figure 3. 4: Three dimensional (3D) schematic of the lubricated wear testing set-up in CSM High temperature POD wear tester, CSM Instruments Inc. The same wear tester was used to do the wear testing at 25 °C by keeping the heater turned off. ... 89
Figure 3. 5: TEM sample preparation stages in FIB Lift-out technique. (a) carbon deposition on the area of interest; (b) preparation of the trench on either side of the area of interest to make the preliminary TEM sample; (c) partial freeing of the sample from the bulk; (d) attaching the TEM sample with the W manipulator and complete freeing of the sample; (e) lift out of the sample from the trench; (f) mount the sample on Cu-grid; and (f) final thinning of the sample to make electron transparent. ... 90
Figure 3. 6: 3D optical interferometer image of a typical surface and histogram profile of the height distribution of the surface elevation after chemical etching in (a)-(b) Al-12.6% Si alloy; (c)-(d) Al-18.5% Si alloy and (e)-(f) Al-25.0%Si alloy. The height distribution frequency (HDF) was normalised with the maximum frequency. Peak at zero corresponds to the etched aluminum matrix and the peak right of that corresponds to silicon particles. The separation distance between the two Gaussian profiles fitted to the experimental data is considered as silicon particle height after etching. ... 91
Figure 3. 7: (a) 3D optical interferometer image of a typical WT in Al-12.6% Si alloy showing the surface morphology of the WT; and (b) 2D cross sectional profile along AA´ in (a) showing the aluminum pile-up around silicon particle within the WT. ... 93
Page | xix Figure 3. 9: A typical optical interferometer image of complete wear track showing the locations of eight different areas from the wear track which were considered to calculate the average volume loss. Within each region as identified by the rectangular box, three 2D cross sectional profile was chosen; thus a total of 24 numbers 2D profiles were considered to calculate the average cross section of the WT. ... 96
Figure 3. 10: (a) optical profilometer of the wear track in Al-12.6% Si alloy after 6×10⁵ sliding cycles and (b) the cross section profile of AA′. The area hatched in the 2D profile is the cross sectional area of worn aluminum matrix (Aj). From each of eight images as shown in (a), three
cross sectional profile was taken to calculate the wear loss. ... 97
Figure 3. 11: Discretization of 3D model of a silicon particle embedded in aluminum matrix – (a) top view and (b) left side view – the discretization density in the vicinity of the Al-Si interface is shown. The mesh density near the interface indicated by the dotted square is shown in (c). ... 98
Figure 3. 12: A typical work flow to convert 3D image to 3D FE model using ScanIP. Segmented mask represents the process of identifying different regions within volume of interest. In the multi-particle model the two segments are the aluminum matrix and the silicon particles. ... 99
Figure 3. 13: (a) SEM image of the volume of interest (VOI) in Al-12.6% Si alloy from where 2D parallel images spaced between 100 nm were sectioned using FIB; (b) the first section from the VOI showing silicon particles and the aluminum matrix; (c) three principal views of the section from b showing the segmentation of aluminum matrix and silicon particles; (d) volumetric voxel mesh (mesh lines are not shown) and the mesh refinement regions; (e) and (f) final model of the microstructure from Figure 3. 13a with and without the mesh lines, respectively. Silicon particles are numbered with subscripts in (c) and (d) for easy identification of them. ... 100
Figure 3. 14: The silicon particle loading-unloading cycle to simulate sinking-in in single-particle model. ... 103
Figure 3. 15: Variation in COF during a lubricated pin-on-disk test using Al-12.6% Si alloys at 2.0 N load; static COF, μS=0.2 and average dynamic COF, μD=0.1 were used in the simulation. 104
Figure 3. 16: The loading-unloading cycle for the particle sinking-in in multi-particle model. This curve was used to prescribe the displacement of the rigid counterface to simulate particle sinking-in. ... 105
Figure 3. 17: Uniaxial (experimental) effective stress versus effective plastic strain diagram of Al-12.6% Si alloy in (a) compression and (b) tension. The true plastic stress and strain were calculated from the engineering stress and strain values measured from the uniaxial tests, respectively. ... 106
Figure 3. 18: (a) Simulated effective stress versus effective plastic strain diagram obtained from tensile testing. The three models were comprised of 2800, 5120 and 10000 elements. (b) Simulated effective stress versus effective plastic strain obtained from compression testing along the centre of the specimen and the experimental data from compression tests. ... 107
Figure 4. 1: (a) Optical interferometer image (296 µm × 225 µm) for Al-18.5% Si alloy, showing WT after 103 sliding cycles at 5.0 N load; (b) The histogram of the surface elevation within the region marked by WT in (a) and the fitted data to measure silicon particle height. ... 121
Page | xx Figure 4. 3: Optical images of WT after (a) 103, (b) 5×10³, (c) 104 and (d) 5×10⁴ cycles at 5.0 N load. Initially the particles fracture and deform plastically; then small particle sink-in and aluminum pile-up takes place. The piled-up aluminum marked by dotted lines in (d) came in contact with counterface making them flat. ... 123
Figure 4. 4: (a) Histogram showing Si particle length distribution frequency within the wear track (a) before fracture, after (b) 103, (c) 5×10³ and (d) 104 sliding cycles; (e) aspect ratio of Si particles after fracture (within the wear track) and particles with no fracture as a function of sliding cycles. The aspect ratio of the particles before fracture was 3.23. ... 124
Figure 4. 5: SEM images showing the wear surface after (a) 103 (UMW); (b) 105 (at the onset of MW) (c) 6×10⁵ (MW); (d) magnified image of wear track after 6×10⁵ cycles from (c); (e) 2×10⁶ (stabilized MW) sliding cycles. The arrow line indicates the location of the wear track. The EDS spectrum in (f) was taken from the inset shown in (e). ... 125
Figure 4. 6: 3D optical interferometer images of complete wear track after (a) 3×10⁵, (b) 6×10⁵ and 2×10⁶ sliding cycles corresponding to MW. The scale bar shows the elevation of the surface, and matrix damage is visible within the wear track. ... 126
Figure 4. 7: Average surface profiles of the (a) unworn surface and wear surfaces after (b) 105, (c) 3×10⁵, (d) 6×10⁵ and (e) 2×10⁶ cycles. The width of each curve represents the standard deviation of the profiles taken from eight different regions in different areas of the wear track. The arrow indicates the location of the wear track. ... 127
Figure 4. 8: Volumetric wear loss of Al-18.5% Si alloy at 5.0 N load. The wear loss was measurable only after 5×10⁴ sliding cycles. The roman numerals indicate the stages of damage process as explained in Section 4.2.3 ... 128
Figure 4. 9: 3D optical interferometer images of the AISI 52100 steel counterfaces against 18.5% Si alloy after (a) 5×10³ (b) 5×10³ (c) 6×10⁵ and (d) after 2×10⁶ sliding cycles. The scale bar shows the elevation of the surface; (e) volumetric wear of the counterfaces as a function of sliding cycles; (f) Change in average surface roughness of the counterface with sliding cycles. The inset in (e) shows the wear of alloy sample for comparison with that of counterface ... 129
Figure 4. 10: Schematic explaining the wear mechanisms in Al-18.5% Si alloys at 5.0 N load. See text for details. The roman numbers indicate the stages of wear as show in Figure IV. VIII. The cracks within the silicon particles were arrested at Al-Si interface or at other cracks at a different section than depicted in the schematic. Accordingly, the figure does not indicate that cracks were arrested within the particles... 131
Figure 4. 11: The distribution of maximum contact pressure (both Hertz and Greenwood–Tripp (GT) model) as a function of radial distance from the centre of the contact; (b) change in maximum real contact pressure at the centre of the contact as per GT model as a function of particle size [93]. (c) The Hertz contact pressure distribution after 6×10⁶ slicing cycles. Pressure distribution at the beginning of the sliding was also plotted. ... 132
Page | xxi Figure 5. 2: (a) Change in aluminum pile-up height at two different temperatures. The error bar represents the standard deviation of measurements from eight different images similar to Figure 3. 7a,c,e; (b) change in ratio of pile-up height to silicon height with sliding cycles representing a damage criterion for UMW-II stage. The first data point with a value of zero pile-up height (at both temperatures) corresponding to zero sliding cycles is omitted. The vertical arrow indicates the sliding cycles at which the transition to UMW-II stage took place at both temperatures. ... 154
Figure 5. 3: Volumetric wear loss of aluminum against sliding cycles at two different temperatures. Three different stages (UMW-I, UMW-II, and UMW-III) at both temperatures were identified based on the wear rate and the characteristic features of the worn surface. .. 155
Figure 5. 4: Back scattered electron (BSE) images of the wear tack at 25 °C after (a) 103 (b) 104 (c) 5×10⁴ sliding cycles showing fracture and fragmentation of particles; and at 100 °C after (d) 103 (e) 104 (f) 5×10⁴ sliding cycles showing formation of pad structure and fracture of particles. Secondary electron (SE) images of the wear track after (g) 6×10⁵ cycles at 25 °C and (h) 2×10⁶ cycles at 100 °C. ... 156
Figure 5. 5: High magnification image of the wear track showing the morphology of island-like tribofilm formed on top of silicon particles in Al-12.6% Si alloy at 100 °C after (a) 104 and (b) 5×10⁴ sliding cycles. The dotted rectangles represent the location of the TEM sample prepared using FIB-lift-out method. ... 158
Figure 5. 6: EDS spectra (at 7.0 KV at a working distance of 9.9 mm) of island-like tribofilm formed on top of silicon particles. The inset shows the magnified image of the tribofilm from Figure 5. d. The EDS spectra location is indicated by the square. ... 159
Figure 5. 7: (a) Formation of island-like tribofilm on top of silicon particles after 104 sliding cycles (the dotted line represents the approximate boundary between the aluminum surface and the deposited C) and (b) an island-like tribofilm on silicon and an ORL on piled-up and worn out aluminum after 5×10⁴ sliding cycles. The square box in b indicates the location of STEM elemental map as shown in Figure 5. 8. See Figure 5. 5b for the location from where the samples were prepared. The deposited C is from TEM sample preparation. ... 160
Figure 5. 8: STEM elemental maps of the tribofilm formed on Si after 5×10⁴ sliding cycles: (a) electron image, (b) C, (c) Ca, (d) Si, (e) P, (f) S, (g) Zn, and (h) O. ... 161
Figure 5. 9: Cross-sectional TEM micrograph showing the island-like tribofilm on Si after 5×10⁴ sliding cycles at 100 °C; (b) HRTEM image of the island-like tribofilm as shown in (a) showing crystalline structure of the film. The inset shows the FFT image identifying different planes corresponding to ZnS structure. ... 162
Figure 5. 10: XANES of tribofilm produced by a fully formulated engine oil and reference compounds recorded in TEY mode – (a) P L-edge; (b) S L-edge; (c) Zn L-edge; and (d) O K-edge XANES recorded in TEY and FY mode of island-like tribofilm with a reference compound. ... 163
Page | xxii Figure 5. 12: EDS map of wear track at RT after 3×10⁵ sliding cycles at 100 °C showing the distribution of various elements: (a) secondary electron image; (b) oxygen; (c) zinc; (d) phosphorus; (e) calcium; and (f) sulphur. The scale bar is the same in all images as in the SEI. WT is the wear track (at the outside edge of WT an island-like tribofilm was formed on Si but no co aluminum wear occurred). ... 165
Figure 5. 13: Comparison of semiquantitative analysis of the wear track using XPS at two different temperatures illustrating the difference in composition of oil-residue layer formed during sliding after 3×10⁵ sliding cycles. The XPS beam diameter was 200 µm and the data was collected from the top 5-10 nm of the worn surface. The error bar represents the variation in data from two to three locations. ... 166
Figure 5. 14: (a) High magnification SEM image and (b) TEM bright field image of the ORL formed on piled-up aluminum after 5×10⁴ sliding cycles at 100 °C (from inset in (a)). It was observed that at this stage ORL was formed only on top of piled-up and worn aluminum. ... 167
Figure 5. 15: STEM elemental maps of the ORL on piled-up aluminum after 5×10⁴ sliding cycles: (a) STEM dark field image, (b) C, (c) Ca, (d) Al, (e) Zn, (f) P, (g) S, and (h) O. The dotted squares in d-f indicate the presence of aluminum within the ORL. ... 168
Figure 5. 16: Cross-sectional image of the wear track after (a) 3×10⁵ and (b) 6×10⁵ sliding cycles at 100 °C showing a continuous ORL on aluminum and silicon, respectively; (c) change in thickness of the island-like tribofilm and ORL with sliding cycles. In (b) mechanical mixing of the ORL with aluminum was observed. ... 169
Figure 5. 17: (a) Average hardness and (b) average Young`s modulus of the ORL measured on samples wear tested at two different temperatures using nanoindentation. The measurements were carried out using a Berkovich tip with a progressive multi-cycle indentation. The data represents the average value from six different indents measured on the sample after 6×10⁵ sliding cycles. The standard deviation of the data shown in the graph varies between 10% and 30%. ... 171
Figure 5. 18: Schematic diagram showing the sequence of events in UMW mechanisms in Al-12.6 wt.% Si alloys at RT and at 100 °C: (a) etched surface; (b)-(d) UMW-I, UMW-II, and UMW-III at RT, respectively; and (e)-(g) UMW-I, UMW-II, and UMW-III at 100 °C, respectively. At 100 °C island-like tribofilm formed on silicon in UMW-I stage leading to less fracture and abrasion of particles compared to that at 25 °C. Island-like tribofilm also delayed the start of UMW-II stage at 100 °C. Once the ORL formed, similar wear rates were observed at both temperatures. ... 172
Figure 6. 1: Variation of COF with sliding cycles up to 3×10⁵ sliding cycles in Al-12.6% Si alloy at five different temperatures. The average COF values are shown in Table 6.1... 189
Figure 6. 2: Optical interferometer images of typical worn surface marked by WT after 3×10⁵ sliding cycles at (a) 25 °C, (b) 80 °C, (c) 100 °C, (d) 140 °C and (e) 160 °C. The sliding direction is vertically downwards. Note the glazy appearances and fewer grooves within worn surfaces above 100 °C. ... 190
Figure 6. 3: Change in surface roughness (Ra) within the worn alloy surface as marked by WT in Figure 6.2a-e at different temperatures. The standard deviation represents measurements from eight locations within the WT. ... 191
Page | xxiii Figure 6. 5: EDS elemental map showing distribution of selected elements – (a) SEI image (b) Zn, (c) P, (d) S, and (e) Ca originated from disintegrated engine oil at 140 °C. ... 193
Figure 6. 6: EDS elemental map showing distribution of selected elements – (a) SEI image (b) Zn, (c) P, (d) S, and (e) Ca originated from disintegrated engine oil at 160 °C. ... 194
Figure 6. 7: XPS survey scan within the WT at (a) 25 °C, (b) 100 °C, (c) 160 °C and (d) outside the WT at 100 °C tested sample. ... 195
Figure 6. 8: Comparison of XPS semiquantitative analysis of atomic concentration data from Figure 6.7 on few selected elements at three different temperatures within the WT region. Data recorded outside the WT on 100 °C tested sample is also shown. ... 197
Figure 6. 9: SEI of counterfaces used for wear testing at (a) 80 °C, (b) 140 °C and (c)160 °C, and the corresponding EDS spectra is shown in (d)-(f) taken from the insert indicated with white rectangles. The sliding direction is vertically downwards. ... 198
Figure 6. 10: Volumetric wear loss of aluminum matrix in Al-12.6% Si alloys at 2.0 N load and after 3×10⁵ sliding cycles at different temperatures. ... 199
Figure 6. 11: Optical interferometer images of counterface at (a) 25 °C, (b) 80 °C, (c) 100 °C, (d) 140 °C, and (e) 160 °C. Surface roughness (Ra) and volumetric wear loss of the counterface with different temperature are shown in (f) and (g) respectively. ... 200
Figure 6. 12: Variation of COF with sliding cycles up to 6×10⁶ sliding cycles in four different Al-Si alloys. The average COF values are shown in Table 6. 2. ... 202
Figure 6. 13: Optical interferometer images showing typical worn surface of (a) Al-12.6%Si T7, (b) Al-12.6%Si T6, (c) Al-18.5%Si and (d)AL-25.0%Si alloy after 6×10⁶ sliding cycles; (e) The surface roughness of the WT surface of the alloy and the counterface. The standard deviation in (e) is from eight different areas of the WT in the respective sample. ... 203
Figure 6. 14: SEM image of typical worn surface of (a) 12.6% Si T7, (b) 12.6%Si T6, (c) Al-18.5% Si and (d) Al-25.0% Si alloy tested at 2.0N load at 100 °C for 6×10⁶ sliding cycles. The EDS spectra from the worn surfaces a-d are shown in Figure 6. 15. ... 204
Figure 6. 15: EDS spectra from the worn surfaces as shown in Figure 6. 14 – (a) Al-12.6% Si T7, (b) Al-12.6% Si T6, (c) Al-18.5% Si and (d) Al-25.0% Si alloy showing presence of Zn, P, S, Ca and O, the primary elements of ORL. ... 205
Figure 6. 16: SEM image (a) of the WT and EDS map showing distribution of (b) O, (c) Al, (d) Si, (e) Zn, (f) Ca, (g) P and (h) S in Al-12.6% Si T7 alloy after 6×10⁶ sliding cycles. ... 206
Figure 6. 17: (a) XPS survey spectra of the WT from al-12.6% Si T7 alloy and high resolution spectra (b) C 1s, (c) O 1s, (d) S 2p and (e) P 2p. In O 1s spectra contributions from NBO and BO were observed. ... 207
Figure 6. 18: XPS high resolution spectra (a) C 1s, (b) O 1s, (c) S 2p and (d) P 2p for Al-12.6%Si T6; (e) C 1s, (f) O 1s, (g) S 2p and (h) P 2p for Al-18.5% Si and (i) C 1s, (j) O 1s, (k) S 2p and (l) P 2p for Al-25.0% Si alloy. ... 208
Page | xxiv Figure 7. 1: (a) Optical profilometer image of an Al-12.6% Si alloy tested for lubricated sliding up to 105 cycles at 2.0 N load; (b) Formation of island-like tribofilm on top of silicon particles and aluminum pile-up in Al-25% Si alloy after 5×10⁴ sliding cycles. ... 228
Figure 7. 2: von-Mises’ stress distribution in the aluminum matrix after silicon particle sink-in in the matrix by (a) 0.1 µm and (b) 0.8 µm (c) 1.6 µm; and (d) after unloading (at the end of the simulation). ... 229
Figure 7. 3: Normalised von-Mises’ stress distribution in the aluminum matrix below the particle after silicon particle sink-in in the matrix by (a) 0.1 µm and (b) 0.8 µm (c) 1.6 µm; and (d) after unloading (at the end of the simulation). The von-Mises’ stress and the depth below particle was normalised by the yield strength of the matrix and the radius of the buried end of the particle (3.0 µm), respectively. ... 230
Figure 7. 4: Effective plastic strain distribution in aluminum matrix after silicon particle sink-in in the matrix by (a) 0.1 µm and (b) 0.8 µm (c) 1.6 µm; and (d) after unloading (at the end of the simulation). ... 231
Figure 7. 5: (a) Surface elevation of aluminum matrix at four different stages of particles sinking-in; (b) variation of maximum pile-up height as a function of silicon height after unloading. ... 232
Figure 7. 6: The Al-Si interface separation after silicon sinking-in of (a) 0.2 μm; (b) 0.8 μm (c) 1.6 μm and (d) after unloading in single particle model. The displacements in x-axis was magnified by three times to show the separation clearly. ... 233
Figure 7. 7: Normalised stress distribution in matrix below the particle for (a) different yield strengths and (b) strain hardening exponents at maximum silicon sinking-in and after unloading. ... 234
Figure 7. 8: (a) Change in pile-up height with silicon particle height for three different yield strength of aluminum matrices and (b) variation of maximum pile-up height with matrix yield strength at two different particle sinking-in amount. (c) Evolution of the UMW damage parameter (ratio of pile-up height to silicon height) with silicon height for different matrix yield strengths showing the transition from UMW-I to UMW-II stage. Experimental data from lubricated test at 25 °C is also shown in (c). ... 235
Figure 7. 9: (a) Change in pile-up height with silicon particle height and (b) evolution of the UMW damage parameter (ratio of pile-up height to silicon height) with silicon height for aluminum matrix with three different strain hardening exponents showing the transition from UMW-I to UMW-II stage. Experimental data from lubricated test at 25 °C is also shown in (b). 237
Figure 7. 10: (a) Evolution of the UMW damage parameter (ratio of pile-up height to silicon height) with silicon height is shown to illustrate the effect of formation of tribofilm. With tribofilm the transition from UMW-I to UMW-II is delayed thereby improving the wear behaviour of Al-Si alloys. The experimental data from lubricated test at 25 °C (no tribofilm) and 100 °C (with tribofilm) is also shown in the plot; (b) Force-displacement plot during particle sinking-in with and without tribofilm. ... 238
Page | xxv Figure 7. 12: Fringe plot showing the pile-up in the aluminum matrix at different amounts of silicon particles sinking-in (or particle height) – after (a) 0.34 μm (1.34 μm), (b) 0.67 μm (1.00 μm), (c) 1.00 μm (0.67 μm), (d) 1.34 μm (0.34 μm) and (e) 1.68 μm (0.00 μm). Maximum displacement was observed after silicon sinking-in of 1.34 μm in (d). Note the changes in scale bar in each plot. ... 240
Figure 7. 13: (a) Maximum pile-up height changes with different amount of particle height and (b) maximum pile-up height at three different stages of silicon sinking-in for three different yield strength of the aluminum matrix in the multi-particle model. ... 241
Figure 7. 14: Change in pile-up height to silicon height (α) with silicon height (or, silicon sinking-in) for three different yield strength of the aluminum matrix in the multi-particle model. ... 242
Figure 7. 15: (a) Maximum pile-up height changes with different amount of particle height and (b) maximum pile-up height at three different stages of silicon sinking-in for three different strain hardening exponent of the aluminum matrix in the multi-particle model. ... 243
Figure 7. 16: Change in pile-up height to silicon height (α) with silicon height (or, silicon sinking-in) for three different strain hardening exponent of the aluminum matrix in the multi-particle model. ... 244
Figure 7. 17: Comparison of the ratio of pile-up height to silicon height from numerical simulation using single- and multi-particle model with the experimental observations at 25 °C as shown in Chapter V. A difference of 0.13-0.15 was observed in the ratio between multi-particle model and the experimental observations. ... 245
Figure 7. 18: Interface decohesion after (a) 1.00 μm, (b) 1.34 μm, (c) 1.68 μm and (d) after unloading in multi-particle model. (e) and (f) shows decohesion at the Si interface in the Al-12.6% Si alloy wear tested for 5×10⁴ and 6×10⁵ sliding cycles at 2.0 N load, respectively. ... 246
Figure 7. 19: Evolution of the UMW damage parameter (ratio of pile-up height to silicon height) with silicon height is shown to illustrate the effect of formation of tribofilm in multi-particle model. With tribofilm the transition from UMW-I to UMW-II is delayed thereby improving the wear behaviour of Al-Si alloys. The experimental data from lubricated test at 25 °C (no tribofilm) and 100 °C (with tribofilm) is also shown in the plot... 247
Page | xxvi
LIST OF APPENDICES
Appendix A1 – SEM images to generate multi-particle model ... 269
Appendix A2 – Sample input for single-particle model ... 271
Page | xxvii
NOMENCLATURE
Viscosity constant of lubricating oil
Viscosity,
0 Viscosity constant of lubricating oil (related to )
p Energy dissipation coefficient
Film thickness ratio
μ Coefficient of friction
hmin Lubrication film thickness, m
r* Composite surface roughness of two contacting bodies
E* Composite elastic modulus between two bodies
U Sliding speed, m/s
W Applied load, N
WT Wear Track
BO Bridging Oxygen
COF Coefficient Of Friction
EDX Energy Dispersive X-ray spectroscopy
HDF Height Distribution Frequency
MW Mild Wear
NBO Non Bridging Oxygen
ORL Oil-residue layer
POD Pin-on-disc
SEM Scanning Electron Microscope
Page | xxviii TEM Transmission Electron Microscope
UMW Ultra-Mild Wear
XANES X-ray Absorption Near Edge Structure
XPEEM X-ray Photo-Emission Electron Microscopy
XPS X-ray Photoemission Spectroscopy
Page | 1
1.
CHAPTER 1– INTRODUCTION
1.1
Overview
Use of Al- and Mg-based lightweight materials in automotive industries worldwide has
become very important in the last decade to meet the demand of producing vehicles with
higher fuel efficiency and cleaner exhaust to reduce the carbon footprint in the environment. To
meet this demand, use of Al-based alloys in the automotive industries or in the transportation
industry in general is on the rise [1]. The properties of Al-based alloys can be engineered
precisely to the demands of specific applications of automotive industries through the choice of
alloy composition, heat treatment, and fabrication process. The key characteristics of aluminum
in automotive use are lightweight, high strength-to-weight ratio, resilience, corrosion resistance,
forming and fabricating, joining, crashworthiness, cold resistance, recyclability, thermal
conductivity, and reflectivity [2]. Use of Al-Si alloys in powertrain components such as engine
block, pistons, piston rings, and cylinder bore to replace cast-iron and steel components is a
result of this global drive for lightweight vehicles and improved emission.
The use of Al-Si alloys, more specifically 3xx.x series used in powertrain components,
offer excellent castability, specific strength, and higher thermal conductivity and make these
alloys a suitable alternative material to cast iron. Under normal running condition of an internal
combustion engine, the estimated material removal rate should not exceed a few nanometers
per running hour. The alternative materials must also meet these criteria. Therefore, tribological
behaviour of the cast Al-Si alloys needs to be investigated for successful application of these
Page | 2 with microstructure and to facilitate the microstructure based design of engine block materials,
the effect of the microstructure needed thorough evaluation in dry and lubricated sliding
conditions.
The wear behaviour of Al-Si alloys with different silicon content and other alloying
elements under dry sliding conditions have been studied for many years [3-12] in mild wear
(MW) and severe wear (SW) regimes. These studies used various test configurations and various
load and sliding speeds often reported the volumetric wear loss as being much higher than that
observed in an internal combustion engine over its life time. Therefore these studies [3-12],
pertaining to extreme loading conditions and without any lubrications, are relevant in
understanding cold scuffing [13]. Apart from tribological understanding of this new class of
materials for automotive application, the manufacturing cost of these components must be
taken into consideration, for example, easy castability and machinability without significant tool
wear, which ultimately provides cost effectiveness.
To cope with the demand, the automobile manufacturers and their suppliers developed
engines with cast iron liners inserted in them [14]. This technology had a few disadvantages such
as increased cost of production, reduction in weight savings, and lower thermal conductivity of
the cast iron liner. Engines were also made of hypereutectic Al-Si (A390) alloys [14], but these
alloys had machinability problems because of the presence of large and hard primary silicon
particles. Likewise, many expensive commercial solutions were developed over the years whose
applications were limited only to the premium vehicles. Thus, the development of hypoeutectic
and eutectic Al-Si alloys allowed linerless engines to overcome the cost associated with the
manufacture of engines made of hypereutectic Al-Si alloys. This created the need to understand
Page | 3 conditions at low loads which mimic the microstructure evolution in normal engine running
conditions.
Under normal operating condition of the automobile engine, lubricant is present
between the cylinder bore and the piston ring, and the engine operates in different regimes of
lubrication depending on the location within the bore. However, the harshest condition prevails
in boundary lubrication regime. Therefore it is very important that the study of tribological
performance of any new material for potential use in engine block must be conducted in
boundary lubrication regime. Recently a study [15] on Al-Si alloys was conducted in boundary
lubrication regime with the aim of understanding the UMW mechanisms at room temperature.
The study revealed that UMW had three subregimes: in the first subregime (UMW-I), there is no
wear of aluminum matrix. Silicon particle damage is limited to formation of abrasive scratch
marks on the top surface. Particle sinking-in and fracture/fragmentation is also often observed
depending on silicon particle morphology; in UMW-II, silicon particle sinking-in takes place
causing pile-up of aluminum matrix surrounding the particles, and aluminum matrix wear starts
to occur. In UMW-III, matrix wear decreases due to formation of an oil-residue layer. However,
the authors did not quantify the pile-up formation, and the long term durability of the ORL to
sustain the UMW-III was also not studied.
1.2
Objectives of this research
One objective of this dissertation was to study the UMW mechanisms of Al-Si alloys at
an elevated temperature of 100 °C and to compare them with those at 25 °C. The formation of
ORL layer was also studied at these two temperatures to characterize the mechanical and
chemical properties of the ORL at 100 °C. The long-term durability of the ORL was investigated
Page | 4 was to develop a fine element model to simulate the silicon particle sinking-in and aluminum
pile-up formation, thereby studying the effect of the mechanical properties of the matrix, such
as yield strength and strain hardening on the aluminum pile-up formation in Al-Si alloys.
1.3
Organization of the dissertation
This dissertation is divided into eight chapters. The first chapter is a general introduction
to this dissertation to emphasize the focus of the work carried out. The second chapter reviews
previous work on relevant topics to this dissertation, such as a brief introduction to Al-Si alloys,
the effect of some major alloying elements in 3xx series alloys, lubrication in engine oil and the
additives in engine oil, dry and lubricated sliding behaviour of AL-Si alloys, and
tribolayer/tribofilm formation. In the next chapter, materials used, experimental and data
analysis techniques, and different characterization techniques used within the scope of this
dissertation are detailed. In the fourth chapter, the results of lubricated sliding of a
hypereutectic Al-Si alloy (Al-18.5% Si) are provided to elucidate the realm of UMW and
transition from UMW to MW at 25 °C. In chapter five, experimental results of lubricated sliding
of Al-12.6% Si alloy are presented to identify the UMW mechanisms at 100 °C and to compare
them with those at 25 °C for the same alloy. The results of the characterization of a tribofilm and
a tribolayer (ORL) formed at 100 °C are also described. In chapter six, the results of lubricated
sliding experiments carried out on four different Al-Si alloys to investigate the durability of the
ORL layer are presented. In the next chapter, the development of the finite element model to
study the UMW mechanisms (sinking-in and pile-up of silicon particle) is introduced. The results
of the numerical simulation to investigate the effect of aluminum matrix properties on the
UMW mechanisms are also explained in this chapter. In the following chapter, Chapter eight, a
Page | 5 chapter nine, this dissertation is summarized, and specific conclusions drawn from the
experimental and numerical work and the significance of this research work are presented.
Page | 6
2.
CHAPTER 2 – LITERATURE REVIEW
2.1
Introduction
In this chapter, previous work on dry sliding and lubricated sliding behaviour of Al-Si
alloys used in automotive engine block were reviewed. The effects of silicon particle content and
morphology on the tribological behaviour of Al-Si alloys were summarized. Specific attention
was paid to discuss the formation of tribolayer or tribofilm in both dry and lubricated sliding.
Finally, the literature concerning the UMW behaviour of Al-Si alloys in boundary lubricated
region and the complementary engine dynamometer studies were also discussed.
2.1.1
Al-Si alloys as an engine block material
Aluminum-silicon (Al-Si) alloys have inherent advantages of lightweight, high specific
strength, and good heat transfer ability, which make them possible alternatives to replace
components made of ferrous alloys. The engine blocks made of hypoeutectic alloys such as A356
or A380 were under production [16], but these alloys showed modest wear resistance and had
cast-in steel liners. But the production cost of die-cast Al-Si alloys with a cast iron liner was
higher [14]. Furthermore, eliminating the liners by using linerless blocks made of Al-Si had the
additional advantage of eliminating thermal expansion problems between aluminum and cast
iron. Thus, the development of all aluminum engine block made of hypereutectic Al-Si alloys
started. The Al-Si alloy, used as an engine block material in the linerless Chevrolet Vega 2300
engine, was a hypereutectic A390 alloy first introduced at the AFS Casting Congress [17]. After
successful use in the Vega, 390 alloy was later used in Chevrolet Corvette ZL1, Porsche 928,
Mercedes 3.8L V8, BMW, Audi, Volkswagen, Toyota, and other engines [18]. Thereafter, many
Page | 7 composite produced by aluminum infiltration of the silicon preform to obtain 15% or 25% silicon
at the bore surface (LokasilTM, and spray compacted hypereutectic AlSi25 alloy (SilitecTM) were
developed [19], but their use has been limited to premium vehicles due to high production cost.
Wear resistance in Al-Si alloys is primarily due to the presence of silicon in the aluminum matrix.
Increasing the silicon content in Al-Si alloys not only increases the wear resistance of the alloy,
but also the strength [20]. However, the improvement in strength and wear resistance comes at
the cost of machinability and castability.
There are also other Al-Si alloys produced by either powder metallurgy technique
[21,22] or spray forming techniques [23,24]. The driving force in these two alternate routes to
produce Al-Si alloys is high silicon content with refined microstructure having uniform
distribution of silicon particles. One of the spray cast Al-Si alloys under the trade name “Silitec”
having a composition of Al-25%Si-4%Cu-Mg is produced by PEAK Werkstoff GmbH for
Daimler-Benz automotive engines.
2.1.1.1 Microstructure and properties of cast 3xx series alloys
There are seven basic families of cast aluminum alloys [14,25]: Al-Cu (2xx), Al-Si-Cu
(3xx), Al-Si (4xx), Al-Si-Mg (3xx), Al-Mg (5xx), Al-Zn-Mg (7xx), and Al-Sn (8xx). Thus, cast 3xx
alloys have silicon as the principal alloying element, but other alloying elements such as copper
and magnesium are specified. Among these, 3xx series alloys are extensively used for
automotive components such as cylinder blocks, cylinder heads, and pistons [14,16,25]. The
chemical composition of some of the commercial 3xxx series alloys is listed in Table 2. 1 [26]. On
the Al-Si binary phase diagram, shown in Figure 2. 1 [27], these alloys are classified into eutectic
(12.6 % Si), hypoeutectic, and hypereutectic alloys. Silicon has a low density, and it reduces the
weight of Al-Si alloys. It also improves fluidity and feeding characteristics of molten aluminum,
Page | 8 promise as an engine block material due to their adequate wear resistance and higher
strength-to-weight ratio [3,4,9,28,29]. Depending on percentage of silicon, casting parameters, and
alloying additions (modifiers), Si in Al-Si alloys is present as either primary silicon or a eutectic
phase. Typical physical and mechanical properties of some selected commercial 3xx series alloys
are reproduced in Table 2.2 [26].
2.1.1.2 Effect of alloying additions in Al-Si alloys
Alloying additions are made to binary Al-Si alloys to improve their desired properties,
such as mechanical properties (ultimate tensile strength, yield strength, fatigue strength),
corrosion resistance, and fabrication characteristics, such as castability, machinability,
formability, and forgeability. In this section a small review will be presented to discuss the major
alloying additions which are made to the binary Al-Si alloys for engine block application. The
main alloying additions found in the Al-Si alloys used in engine block are copper (Cu),
magnesium (Mg), nickel (Ni), iron (Fe), manganese (Mn), sodium (Na), and strontium (Sr).
Among these alloying elements, Cu and Mg are the two most important elements which
are added to Al-Si alloys to improve their strength, occasionally accompanied by a decrease in
ductility [26,30-33]. Addition of Cu improves the strength and hardness of the alloys in cast and
heat treated conditions, and the maximum improvement in mechanical properties is observed
with 4.0-5.5% copper [26]. Moustafa et al. [30] reported that addition of 3% copper in modified
Al-11.5% Si alloys increased the yield strength by 57% with a loss of ductility by 33%. However,
addition of Cu decreases corrosion resistance [26] and increases porosity [34].
Addition of Mg in Al-Si alloys provides the benefit of altering the mechanical properties
by heat treatment. The β-phase (Mg2Si) in Al-Si-Mg alloys displays the solubility limit
Page | 9 Mg in A319 alloys had increased the tensile strength and decreased the ductility. Moustafa et al.
[30] also reported similar results for modified Al-11.5% Si alloys.
Ni addition in Al-Si alloys improves the elevated temperature mechanical properties and
also reduces coefficient of thermal expansion [26,31]. Cho et al. [31] found that simultaneous
increase in Cu and Ni in Al-12% Si alloys improved the elevated temperature mechanical
properties. The authors reported that increasing Ni resulted in increase of Al3(Cu,Ni)2 and
Al-(Ni,Fe) intermetallics, and increasing Cu and Ni simultaneously resulted in increase in Al3(Cu,Ni)2
phase. The authors showed that increase in mechanical properties at elevated temperature was
due to the increased formation of Al3(Cu,Ni)2 phase and other intermetallic phases.
Fe and Mn are generally considered to be impurity elements in casting. Mn has very
little solubility in aluminum and, as a result of this, it combines with Fe, Si, and Al to produce
(Al15(Mn,Cr,Fe)3Si) intermetallic [31,32]. Iron reacts to form a number of insoluble intermetallic
phases such as FeAl3, FeMnAl6, and α-AlFeSi, which are responsible for strength improvements
at elevated temperature [26]. However with increasing Fe content due to these insoluble
phases, feeding characteristics are adversely affected.
Na and Sr are used as eutectic modifiers in Al-Si alloys [36-38]. Sodium works well as a
modifier in the absence of phosphorous (P) as it has a tendency to react with P [26]. Effective
modification with Sr was achieved in slow solidification rates [36,37], whereas Na works as an
effective modifier in all solidification conditions.
2.1.2
Dry sliding wear of Al-Si alloys
2.1.2.1 Tribological behaviour of Al-Si alloys in dry sliding
There have been many studies conducted on tribological behaviour of cast Al-Si alloys in
![Figure 2. 1: Aluminum-Silicon binary phase diagram [27].](https://thumb-us.123doks.com/thumbv2/123dok_us/1430312.1175491/66.612.183.467.131.365/figure-aluminum-silicon-binary-phase-diagram.webp)
![Figure 2. 2: Wear mechanism map for aluminium alloys [39].](https://thumb-us.123doks.com/thumbv2/123dok_us/1430312.1175491/67.612.166.487.66.546/figure-wear-mechanism-map-aluminium-alloys.webp)
![Figure 2. 3: A map for wear mechanisms in aluminium alloys. The numbers in the figure represent normalized wear rate, , where is the wear rate in m3m-1 and (m2) is the nominal area of contact [41]](https://thumb-us.123doks.com/thumbv2/123dok_us/1430312.1175491/68.612.157.516.63.500/figure-mechanisms-aluminium-numbers-represent-normalized-nominal-contact.webp)
![Figure 2. 4: (a) Wear mechanism map for aluminium alloys. The dotted line between the two mechanisms in the mild wear delineates load and velocity conditions where the wear debris consists of 50% plate-like and 50% mechanically mixed particles [43]; (b) We](https://thumb-us.123doks.com/thumbv2/123dok_us/1430312.1175491/69.612.174.466.67.615/mechanism-aluminium-mechanisms-delineates-velocity-conditions-mechanically-particles.webp)

![Figure 2. 10: The modified Stribeck diagram [59,62]. The x-axis is changed to film thickness ratio instead of dimensionless parameter (U/W)](https://thumb-us.123doks.com/thumbv2/123dok_us/1430312.1175491/75.612.172.484.78.443/figure-modified-stribeck-diagram-changed-thickness-dimensionless-parameter.webp)


