Distance Estimation Using Multisensor Data
Fusion Technique with FPGA
Kavita Palaskar, Prof. S.A Shaikh
PG Student, Dept. of E&TC, Pravara Rural Engineering College Loni, Savitribai Phule Pune University, Pune, India
Assistant Professor, Dept. of E&TC, Pravara Rural Engineering College Loni, Savitribai Phule Pune University, Pune,
India
ABSTRACT: In today’s smart world, the data fusion is an important part, the smart devices require reliable and different types of sensory data regarding their objectives for getting better information. Different types of sensors are often fused to obtain information which cannot be acquired by a solitary sensor alone. For mobile robots sensor fusion is particularly used for object detection and navigation. The proposed framework, aims to estimate the distance by multisensor data fusion technique using Infrared and Ultrasonic sensors. This distance estimation system is implemented by using two sensors (IR and US) and the FPGA (Altera Cyclone IV) as a controller. The data fusion method is applied to the data received from two sensors (IR and US). The FPGA is used to estimate the distance of obstacle with the help of Mean, Variance, Standard deviation and Coefficient of Variance which is collected from the two sensors (IR and US). The robot application is implemented which move in forward direction and stop when obstacle is detected within particular distance range. The FPGA feeds the fusion data (estimated distance) to the robot application and according to sensor characteristic only positive part is taken and neglected the negative, so as to increase the accuracy of system. This approach is beneficial than the other techniques both in terms of economic and computation
KEYWORDS: Ultrasonic sensor, Infrared sensor, Coefficient of variance, Multisensor data fusion technique
I. INTRODUCTION
In recent years, multisensor data fusion has received significant attention for both military and non-military applications. Data fusion techniques combine data from multiple sensors and related information from their database used to achieve improved accuracies, and then more specific inferences could be achieved by the use of a single sensor alone. The integration of data and knowledge from several sources is known as data fusion. Sensor fusion roughly means integration of information from different types of sensor into a unified interpretation. When we work with several sensors, it involves several uncertainties & represents several problems, to overcome these problems, data fusion technique is used. Suppose for the distance estimation of obstacle two sensors like IR sensor & ultrasonic sensor are used. In this case IR sensor offers simple, user friendly, lower cost than ultrasonic sensor and fast obstacle detection. However it has some serious limitations like detecting mirror or glass based object due to reflectance property. It will not give accurate reading in sun light.
On the other hand ultrasonic sensor depends on sound propagation so it will unaffected by above situation. It requires wide beam & high cost. It can be used in sunlight application. So combination of these sensors gave advantages of two sensors. These two sensors are used as complementary way such as the advantages of one compensate for disadvantage of the other [1].
II. RELATED WORK
identify the inconsistency in sensor measurements so that the spurious measurements can be eliminated from the data fusion process. Thisformulation was an estimate of probability that the data is not spurious according to measured data and unknown value of true states. LijunXu [5] used wavelet transform-based data fusion algorithm for multisensor systems. He used Minimum Mean Square Error estimator for time-invariant and time-varying processes. But in this technique wavelet should be carefully selected to estimate the variance of fast time varying system.Huadong Wu et al. [6]used sensor fusion technique for context aware computing. He used Dempstershafer theory of evidence and the classical Baysian method and compare it with the weighted sum of probabilities method. David et al. [7] gives the introduction of different sensor fusion method for department of defence (DOD). He introduced data fusion application, process models and identification of applicable techniques. Tapan Kumar Nayak, Sanjit Kumar Dash, HimansuSekharSasmal and SrikantaPatanaikr [8] used data fusion technique for the object detection in robotics. Wireless sensor network was used for remote monitoring objects and environment. To handle uncertain, incomplete and vague information, data fusion technique is applied to a measuring system to reduce effectively overall uncertainty and increase the accuracy. In data fusion Dempster-Shafer evidence theory is used. Shrabani Bhattacharya and Rappavu Raj [9] used performance evaluation of multi-sensor data fusion technique for test range application. Data fusion technique consists of state vector analysis for range selection application. In this multiple sensors track data to provide complete and precise trajectory information about the flight vehicle under test, for the purpose of flight safety monitoring and decision making at test range.Tarek et al. [10] used phong illumination model to determine reflectance property of IR sensor so that it gives accurate readings. He used fusion of IR and US sensors for distance measurements.
III.PROPOSED SYSTEM
A. Block Diagram:
The Fig.1 shows the block diagram of system which consists of two sensors (IR and US) with FPGA for the measurement of distance.
Figure.1. Block Diagram of System
Figure 2. Photograph of the actual system
B. System Implementation:
Proposed system is implemented by using two different sensors Infrared sensor (IR) and ultrasonic sensor (US). The following parameters are considered in the estimation of distance. Let S1 and S2 are two values of distances obtaining from the sensors. The Mean (M) value of sensors is obtained by equation (1)
Mean (M)
2
21
S
S
………. (1)This formula is implemented using VHDL coding. σ1 & σ2 are the variances of two sensor value respectively and is calculated by equation (2)
Variance
2
)
(
)
[(
Mean
S
1 2
Mean
S
2 2
………. (2)Standard deviation (SD) is calculated by equation (3)
SD =
Variance
……... (3)Coefficient of variance (C.V) is calculated by equation (4)
C.V.
)
(
)
(
SD
M
Mean
C. Distance Estimation Flow Chart
Figure.3. Distance Estimation Flow Chart
This chart of Distance estimation flow is shown in Fig.3 .The following are the procedure used for distance estimation using FPGA with two sensors (IR and US).
When the obstacle detects, pulse from ultrasonic sensor is read first
Convert the pulse duration into the distance.
Read the Infrared sensor voltages.
Initialize the averaging mechanism.
Convert the IR voltages value into nth samples
By using least square weighted mechanism IR voltages converted into distance.
Calculate the Mean, Variance, Standard Deviation and Coefficient of Variance.
Display the results.
Fig.4.Relation between IR and actual distance
The Fig.5 shows the relation between actual reading and distance measured by ultrasonic sensor. In this the variation at small distance is not observed. So the actual distance is estimated in such a way that fusion data take the reading of ultrasonic sensor only because there is large variations in the IR sensor reading. After the 6cm distance, the Mean of both the sensors will be considered as estimated distance called fusion data. This fusion data is given to the motor driver system, so that it can accurately judge the distance of the obstacle and take further decision.
Fig.5. Relation between US Distance and actual distance
The Fig. 6 shows the relation of actual distance and fusion data and shows the linear relationship. This characteristics shows that instead of the single sensor if two or more sensors are used then it will gives better results than single sensor.
0 5 10 15 20 25 30 35 40 45
0 5 10 15 20 25 30 35 40 45
IR
V
a
lue
s
Actual Distance
0 5 10 15 20 25 30 35 40 45
0 5 10 15 20 25 30 35 40 45
U
S
V
a
lue
s
Fig. 6. Relation between Fusion Data and actual distances
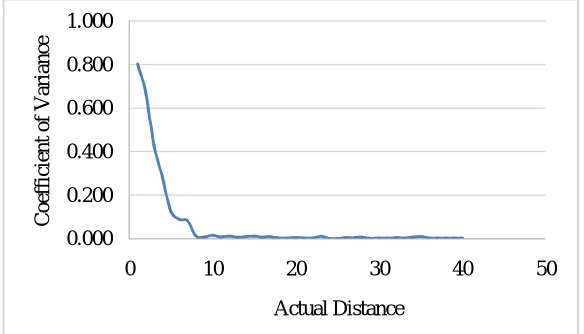
The relation between coefficient of variance and fusion data is shown in Fig.7, from this the Coefficient of Variance gives maximum dispersion from its actual value. Coefficient of variance is very useful to give deflection of each distance value from its actual distance. According to the value of coefficient of variance, uncertainties at particular point will be predicted.If any sensor not working properly it can also be identified by coefficient of variance. This system used 39% logic element which consist of 31% combinational logic functions and 26% dedicated logic registers. It required 37264 memory bits and 25%PLL’s.It consumed 305.74mW power.
Fig 7. Relation between coefficient of variance and actual distance
V. CONCLUSION AND FUTURE WORK
A novel Data fusion technique based on mean & variance is presented. The proposed work is FPGA based implementation of data fusion architecture for Ultrasonic and Infrared sensors to find out the distance of an obstacle.
0 5 10 15 20 25 30 35 40 45
0 5 10 15 20 25 30 35 40 45
F us io n V a lue s Actual Distance 0.000 0.200 0.400 0.600 0.800 1.000
0 10 20 30 40 50
REFERENCES
1. M E. Conde, Sergio Cruz, D M. Munoz, Carlos H.L lanos and Eugenio L F Fortaleza, “An efficient data fusion architecture for infrared and ultrasonic sensors using FPGA”, IEEE Transactions Circuits and systems,2013.
2. Wang Yunsong, Chu Fulei, HeYongyong andGuo Dan, “Multisensor Data Fusion for Automotive Engine Fault Diagnosis”, Tsinghua Science and Technology,Vol. 9, No. 3, pp. 262-265, 2004.
3. MarinkaZitnik and BlazZupan, “Data Fusion by Matrix Factorization”, IEEE transactions on pattern analysis and machine intelligence, Vol.37, pp. 41-53, 2015
4. Manish Kumar, Devendra P. Garg, and Randy A. Zachery, “A Method for Judicious Fusion of Inconsistent Multiple Sensor Data”, IEEE Sensors Journal, Vol. 7, No. 5, pp. 723-733, 2007.
5. LijunXu, JianQiu Zhang and Yong Yan, ‘A Wavelet-Based Multisensor Data Fusion Algorithm’, Vol. 53, No. 6, pp. 1739-1545, 2004. 6. Huadong Wu, Mel Siegel, Rainer Stiefelhagen and Jie Yang, “ Sensor Fusion using Dempster Shafer Theory”, IEEE Instrumentation and
Measurement Technology Conference, 2002.
7. David L Hall and James Llians, “An Introduction to Multisensor Data Fusion”, IEEE, Vol. 85, No. 1, 1997
8. Tapan Kumar Nayak, Sanjit Kumar Dash, HimansuSekharSasmal and SrikantaPatanaik, “Object Detection by an Autonomous Robot through
Data Fusion”, International Journal of Computer Science and Information technologies Vol. 3 (5), pp.4951-4955 , 2012
9. Shrabani Bhattacharya and Rappavu Raj, “Performance evaluation of multi-sensor data fusion technique for test range application”,Sadhana
Vol. 29, Part 2, pp. 237–247, 2004.
10. Tarek Mohammad, “Using Ultrasonic and Infrared Sensors for Distance Measurement”, International Scholarly and Scientific Research &
Innovation, Vol.3, No. 3, pp. 267-273, 2009.
11. Deo-Nano user Manual, 1st Ed, Terasic Technologies Inc., 2011.
12. GP2Y0A02YK, 2nd Ed., SHARP, 2001
BIOGRAPHY
Ms.Palaskar K.K. a P.G. student in the Electronics & telecommunication Department, Pravara Rural Engineering College, Savitribai Phule University. She received Bachelor in engineering degree in 2009 from PREC, Loni, MS, India.