Dimensional Reduction of Statistical
Structural of a Paper by Information
Geometry
Dr K Ramesh Babu1, K Srinivasa Rao2, P.Prasanna Kumar3
Associate Professor, Department of Communication Stream, ECE. JIT, Jimma University, East Africa1 Associate Professor, Department of Mathematics, H&S HOD, GEC, JNTUK, AP, India 2
Assistant Professor, Department of EEE, JUNTUH, MCET, T.S, India3
ABSTRACT: the visual and especially tactile quality of a surface is called a texture. Stochastic textures with features spanning many length scales arise in a range of contexts in sciences, from nano size structures like synthetic bone to a ocean wave height distributions and cosmic phenomena like inter-galactic cluster void distributions. The samples here came from the papermaking industry but such a reduction of large frequently noisy spatial data sets is useful in a range of materials and contexts at all scales. Aim is reducing the size of structure without any loss in information by using information geometry. We are giving answer to “how far apart are two distributions?” e.g. Gaussian (m, s2 ): Euclidian distance between two distributions has no `natural’ statistical significance. Information geometry seeks first the shape of the (multidimensional) surface and once the surface is known the shortest curve between two points representing the distributions is the ‘natural’ metric, Information geometry provides a natural metric to discriminate among formation textures.
KEYWORDS: texture; Dimensionality reduction; information metric; statistical etc. I. INTRODUCTION
High dimensional data visualization and interpretation have become increasingly important for data mining, information retrieval, and information discrimination applications arising in areas such as search engines, security, and biomedicine. The explosion in sensing and storage capabilities has generated a vast amount of high dimensional data and led to the development of Many algorithms for feature extraction and visualization, known variously as dimensionality reduction, manifold learning, and factor analysis.2Dimensionality reduction strategies fall in two categories: supervised task-driven approaches and unsupervised geometry-driven approaches. Supervised task-driven approaches reduce data dimension according to optimize a performance criterion that depends on both the reduced data and ground truth, e.g., class labels. Examples include linear discriminant analysis (LDA) , supervised principal components , and multi-instance dimensionality reduction. Unsupervised geometry-driven approaches perform dimension reduction without ground truth and try to preserve geometric properties such as distances or angles between data points. Examples include principal components analysis (PCA) and multidimensional scaling (MDS), and ISOMAP. Most of these approaches use Euclidean distances between sample points to drive the dimensionality reduction algorithm. Recently it has been recognized that these Euclidean algorithms can be generalized to non-Euclidean spaces by replacing the non-Euclidean distance metric with a more general dissimilarity measure. In particular, when the data samples are probability distributions, use of an information divergence such as Kullback-Leibler (KL) instead of Euclidean distance leads to a class of information geometric algorithms for dimensionality reduction . In this article we motivate and explain the application of information-geometric dimensionality reduction for two real-world applications.
performance. This improvement can be understood from the point of view of information-theoretic bounds: information divergence is generally more relevant to statistical discrimination performance than Euclidean distance. For example, for binary classification the minimum probability of error converges to zero at an ex-potential rate with rate constant equal to the Kullback-Leibler information divergence between the distributions of the data over each class. The KL divergence not a function of the Euclidean distances between data points unless these distributions are spherical Gaussian. Therefore, as it preserves information divergence, in many cases IGDR can produce more informative dimension reductions than classical Euclidean approaches.
It is the process of algorithmically constructing a large digital image from a small digital sample image by taking advantage of its structural content. It is an object of research in computer graphics and is used in many fields, amongst others digital image editing, 3D computer graphics and films., texture synthesis can be used to fill in holes in images (as in inpainting), create large non-repetitive background images and expand small pictures. Procedural textures are a related technique which may synthesise textures from scratch with no source material. By contrast, texture synthesis refers to techniques where some source image is being matched or extended. in machine learning and statistics, dimensionality reduction or dimension reduction is the process of reducing the number of random variables under consideration, via obtaining a set of principal variables. It can be divided into feature selection and feature extraction. Feature selection approaches try to find a subset of the original variables (also called features or attributes).
There are three strategies; filter (e.g. information gain) and wrapper (e.g. search guided by accuracy) approaches, and
embedded (features are selected to add or be removed while building the model based on the prediction errors). See also combinatorial optimization problems. In some cases, data analysis such as regression or classification can be done in the reduced space more accurately than in the original space. ie as shown in fig1.
II. RELATED WORK
Advantages of dimensionality reduction: it is reduces the time and storage space required. Removal of multi-co linearity improves the performance of the machine learning model. It becomes easier to visualize the data when reduced to very low dimensions such as 2D or 3D.and Applications are A dimensionality reduction technique that is sometimes used in neuroscience is maximally informative dimensions, which finds a lower-dimensional representation of a dataset such that as much information as possible about the original data is preserved.
1b.Structured data analysis is the statistical data analysis of structured data. This can arise either in the form of an a priori structure such as multiple-choice questionnaires or in situations with the need to search for structure that fits the given data, either exactly or approximately. This structure can then be used for making comparisons, predictions, manipulations etc.
1c.Types of structured data analysis: are Algebraic data analysis, Bayesian analysis, cluster combinational data analysis, Formal concept analysis, Functional data analysis, geometric data analysis, Regression analysis, Shape, Topological, Tree structured data analysis..
1d.Information geometry: is a branch of mathematics that applies the techniques of differential geometry to the field of probability theory. This is done by taking probability distributions for a statistical model as the points of a Riemannian manifold, forming a statistical manifold. The Fisher information metric provides the metric. Information geometry reached maturity through the work of Shun ‘chi Amari and other Japanese mathematicians in the 1980s. Amari and Nagaoka's book, Methods of Information Geometry, is cited by most works of the relatively young field due to its broad coverage of significant developments attained using the methods of information geometry up to the year 2000. Many of these developments were previously only available in Japanese-language publications.
1e.Data sets: Data was acquired as local height values from the surfaces of paper samples using a photometric stereo device; details of the measurement technique are provided. Data were acquired at di erent times under subtly di erent optical conditions; though in all cases we handled arrays of at least 2400×2400 pixels with spatial resolution between 4 µm and 7 µm per pixel, which is smaller than the expected width of the constituent fibres. All measurements were made on industrially manufactured paper samples. Measurements were made on 3 groups of samples:
Group 1: Packaging and printing grades. Ten samples: coated packaging paper and cardboard; uncoated packaging paper and cardboard; uncoated wrapping grades. Measurements made on both sides of each sample.
Group 2: Tissue. Five samples of two-ply bathroom tissue. Measurements made on one side only.
Group 3: Printing, writing and sack grades. Five samples: one high quality coated grade and three utility grades for printing and writing; one grade for making paper sacks. Measurements made on one side only; two measurements made of each sample.
Graphical representations of three examples of the surface height distribution are provided in Figure 1. These show three very di erent surfaces: a coated board surface, an uncoated packaging paper surface and the surface of a bathroom tissue. In the figure2, dark regions correspond to low height and vice versa; each image represents a square of side 1500 pixels.
Information geometry model applications: Information Geometry and its Applications 1. Divergence Function and Dually Flat Riemannian Structure
2. Invariant Geometry on Manifold of Probability Distributions 3. Geometry and Statistical Inference semi parametric
Fig2 connection between two Gaussian surfaces
II.PROPOSEDALGORITHM
PROCEDURE FORMATION: There are many well-established quantitative measures of formation:
Variance of local grammage at different scales of inspection, power spectrum, specific perimeter, Often comparative quantifiers are used, which compare measured properties with those of a random fibre network, direct mappings exist among all established measure of formation as shown in fig 3. The decay of the variance of local grammage with scale of inspection, x, depends on the autocorrelation function for pairs of points separated by a distance r , which we denote a *( r ):
The wavelength power spectrum is given by the Fourier transform of a *( r ). For random networks, a ( r ) and s2( b ) are known analytically. Autocorrelation is a characteristic of the texture of our grammage map.
It measures the degree of association of the grammage of each pixel with that of pixels a given distance away, Close pixels are likely to have similar grammage,The grammage of ‘distant’ pixels are independent, Rate of decrease is a characteristic of ‘floc size’ . Autocorrelation is given by the covariance divided by the variance (0 < a( r ) ≤ 1). It is a
GLOBAL average property. The covariance of a pair of random variables p and q is given by
From our array of local grammage values, ,we obtain the local average grammage of the first and second neighbours, 1 and 2.
So, from the distribution of local grammages, we obtain three approximately Gaussian distributions. • The random variables, , 1 and 2 are not independent; they have covariances: Cov( , 1) Cov( , 2) Cov( 1, 2) • The covariance matrix characterises the trivariate Gaussian distribution:
And observe the following fig4a,b.c shows clearly about. Covariance of a pair of random variables p and q , The covariance matrix characterises the trivariate Gaussian distribution ,Covariance diagram from matrix formations.
Fig4a.covariance of a pair of random variables p and q
Fig 4c.Covariance diagram from matrix
For a pair of trivariate Gaussian distributions, A & B, with • common mean vector, µA = µB = µ.
Different covariance matrices, ∑ ≠ ∑
The information distance is known and is given by
II.1 Information Distance Example:
Table 1 information inputs and respective simulation outputs.
Sno Inputs Simulation
1 Grammage β Number of fibres per cluster na is a poisson variable with mean nc
2 Fibre properties
Length λ Coarseness,δ Width ω
Mean grammage, Giof each cluster assumed const.
G= I . β = (I δ)/ω
3 Mean floc radious (rf) R = sqrt[ nc. λ . ω/( .I)]
4 Floc Intensity 0≤I≤1 nc fibres centres deposited within circles of r
5 Expected number of fibres per cluster nc
nc fibre cenres deposited within circles of r.
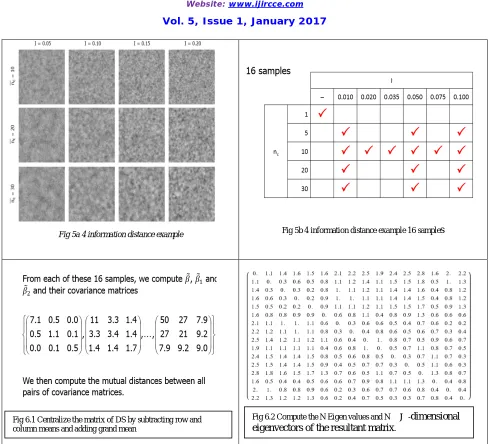
Fig 5a 4 information distance example Fig 5b 4 information distance example 16 samples
Fig 6.1 Centralize the matrix of DS by subtracting row and column means and adding grand mean
We seek to visualize our N (=16) samples on a 3D surface. We employ the ‘dimensionality reduction’ or ‘multidimensional scaling’ approach of Carter :
1. Centralize the matrix of DS by subtracting row and column means and adding grand mean; 2. Compute the N Eigen values and N N -dimensional eigenvectors of the resultant matrix;
3. Make a 3 × 3 matrix, A, of the three largest Eigen values; make a 3 x N matrix, B , of corresponding eigenvectors; 4. The transpose of the product A.B is an N × 3 matrix which gives N coordinates in 3-space.
III. RESULTS
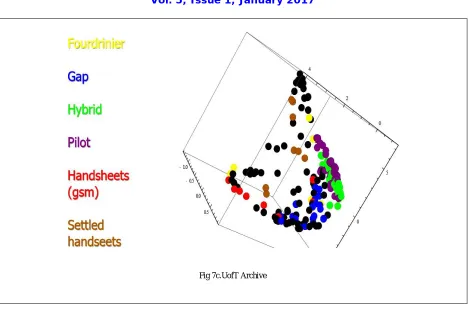
Dimensional Reduction of Statistical structural of a Paper by Information Geometry results are shown in fig 7. Simulated networks with grammage 5, 10, 15… 100 g/ m2. Finally UofT Archive shown in fig 7c.
Fig 7a.Simulated networks with grammage 5, 10, 15, …, 100 g/ m2
Fig 7b.effect gamma random Fig6.3Visualize our N (=16) samples on a 3D surface.
Fig 7c.UofT Archive
IV.CONCLUSION
Information-geometric framework for dimensionality reduction. As contrasted to standard Euclidean approaches to manifold learning, which aim to reconstruct a Riemannian sub-manifold of Euclidean space, our objective is to learn statistical manifolds. We have seen that when the data produces realizations of probability density functions lying on a statistical manifold, it performs information-driven dimensionality reduction in both the density space and the sample space. These techniques were illustrated on the problem off low cytometry analysis, showing the ability to find a subspace in which a pathologist can better diagnose chronic lymphocytic leukemia patients. It is also able to compare patients one to another in a single low-dimensional embedding space Information geometry provides a natural metric to discriminate among formation textures. Discrimination among simulated textures is consistent with the parameters used to generate them. Sheets formed by different forming methods exhibit clustering according to forming conditions.
REFERENCES
1. C.T.J. Dodson. Spatial variability and the theory of sampling in random fibrous networks. J. Roy. Statist. Soc. B 33(1):88-94, 1971. 2. M. Metta¨nen and U. Hirn. A comparison of five optical surface topography measurement methods. Tappi J. 14(1):27-37, 2015 3. S. Amari. Information Geometry and Its Applications. Appl. Math. Sci. 194, Springer, Japan, 2016.
4. K. Arwini and C.T.J. Dodson. Information Geometry Near Randomness and Near Independence. Lecture Notes in Mathematics. Springer-Verlag, New York, Berlin, 2008.
5. M. Deng and C.T.J. Dodson. Paper: An Engineered Stochastic Structure. Tappi Press, Atlanta, 1994.
6. W.W. Sampson. Materials properties of paper as influenced by its fibrous architecture. Int. Mater. Rev. 54(3):134-156, 2009.
7. C.T.J. Dodson and W.W. Sampson. Information geometry and dimensionality reduction for statistical structural features of paper. In Advances in Pulp and Paper Research, Cambridge, 2013. Trans. XVth Fund. Res. Symp. (S.J. I’Anson, ed.), pp55-69, FRC, Manchester, 2013.
8. C.T.J. Dodson and W.W. Sampson. Dimensionality reduction for classification of stochastic texture images. In Geometric Theory of Information, (F. Nielsen, ed.), Signals and Communication Technology Series, Springer International Publishing, Switzerland, 2014.
9. C. Atkinson and A.F.S. Mitchell. Rao’s distance measure. Sankhya: Indian Journal of Statistics 48A(3):345-365, 1981.
11. http://www.ma.umist.ac.uk/kd/PREPRINTS/amino.pdf [2] T-Y. Hwang and C-Y. Hu. On a characterization of the gamma distribution: The independence of the sample mean and the sample coe cient of variation. Annals Inst. Statist. Math. 51, 4 (1999) 749-753
BIOGRAPHY
Dr K. Rameshbabu working as Associate. Professor, in Communication stream, ECE, JIT, Jimma, East Africa, He did B.E(ece), M.Tech, PhD having 20+ years of Experience in the field of Teaching completely. he is Guest professor for various colleges affiliated universities like Anna.University,Shivaji University,JNTU,Pondicherry etc.he is member of IEEE,ISTE,VSI.IJCSIT, IRED he is reviewer for many journals & published 30+ papers in international journals and conferences & also conducted, attended many Faculty Development Programmers .his area of interest image processing,VLSI,digital electronics etc.he can reach at:[email protected]
Mr K.Srinivasa Rao working as Associate. Professor, in Mathematics ,HOD,H&S Department,GEC,Guntur,AP, India.he holds B.sc(computer science), M.sc(mathematics),from Acharya NagarjunaUniversity,Guntur and pursuing Ph.D in mathamatics,at Annamalai University, TN, having 19+ years of Experience in the field of Teaching completely. he was worked for various colleges affiliated universities likeJNTU,ANU etc.He is very Good teacher and Administrator over a 2 decades.