ROSE, TYLER. Effect of Immersion on Task Performance and Cardiac Response in a Virtual Reality Assembly Training Simulation. (Under the direction of Dr. Karen Chen and Dr. Chang Nam).
Virtual reality (VR) use in occupational training scenarios has seen research attention
across many applications. Specifically, researchers have focused on effectiveness of these training
regimens in terms of task time and success rate when compared to their real-world counterparts.
Few studies, however, have examined these VR-based training programs in terms of the
implications that immersion and presence can have. Further, as research in these VR-based studies
continue to expand, the subjective and objective methods we use to determine presence in a virtual
environment (VE) need to be continuously examined and improved upon.
The primary goal of this study is to investigate the effect of immersion on human task
performance in an occupational setting in a VE. The first objective was to investigate the effect of
immersion on task performance accuracy in the VE. The second objective was to examine the
effect of immersion on subjective responses and objective physiological measures of humans in
the VE. A within-subject experiment was designed to address these objectives. Thirty participants
completed 18 virtual occupational training simulation tasks, where they were instructed to place
36 air filters in boxes moving across an active conveyor belt using a head-mounted display as
viewing medium. Immersion was modified by the vividness and extensiveness of the scenario.
Participants were equipped with a heart rate monitor chest strap, which monitored cardiac activity
rate throughout each trial. Following the exposure to each set of immersive levels, participants
completed a subjective presence questionnaire (SUS) as well as a perceived workload survey
characterized by increased task accuracy. It was also hypothesized that greater immersion would
lead to higher subjective presence, both in mean and high responses. NASA-TLX was
hypothesized to be significantly affected by greater immersion. Normalized heart rate was
similarly hypothesized to be significantly affected by greater immersion. Results of this
experiment indicate a consistent upward trend for task accuracy with increased immersion, but not
statistically significant. Additionally, subjective presence responses through mean SUS confirmed
the user’s ability to observe increases in immersion. High SUS response were significantly affected
by extensiveness, while perceived workload was significantly affected by vividness. Furthermore,
cardiac response was not significantly affected by increasing levels of immersion, through
vividness nor extensiveness.
These findings show that while subjective presence responses proved the designed
differences in immersion between trials, neither percent task accuracy nor normalized heart rate
were significantly affected. While not statistically significant, a consistent upward trend of percent
task accuracy was observed with increased immersive levels. Further trials in other occupational
training applications are recommended to determine if this trend can be substantiated elsewhere.
Although not included in the hypotheses, a statistically significant effect of trial number was found
on normalized heart rate. In scenarios similar to our training sessions where cardiac response is
not expected to see significant trends with immersion, subjective presence questionnaires would
be recommended over normalized heart rate unless extensive measures can be taken to ensure
© Copyright 2018 by Tyler Lewis Rose
Training Simulation
by
Tyler Lewis Rose
A thesis submitted to the Graduate Faculty of North Carolina State University
in partial fulfillment of the requirements for the degree of
Master of Science
Industrial Engineering
Raleigh, North Carolina
2018
APPROVED BY:
_______________________________ _______________________________ Dr. Karen Chen Dr. Chang S. Nam
Committee Chair Committee Co-Chair
_______________________________ _______________________________
Dr. David Kaber Dr. David Dickey
DEDICATION
This research is dedicated to my family, which has supported me in different ways throughout
the process of this work. Parents, Tom and Sandy Rose, and siblings, Nick, Matt, and Jenna
Rose, provided remote morale support from their homes in Texas. Locally, Aunt Patty and Uncle
Glen as well as cousins Leslie, Laura, Ryan, and John, all provided the nourishment I needed to
BIOGRAPHY
Tyler Lewis Rose was born in Raleigh, NC on May 22nd, 1994. He graduated high school
in Georgetown, Texas, before enrolling at The University of Mississippi to study mechanical
engineering. In May 2016, he graduated from The University of Mississippi with a Bachelor of
Science in Mechanical Engineering. With a drive to continue his academic career, he wound up
back in Raleigh to attend North Carolina State University in pursuit of a master’s degree in the
Edward P. Fitts Industrial & Systems Engineering Department. In May 2018, he will with a
ACKNOWLEDGMENTS
First and foremost, I would like to thank my co-chairs, Dr. Karen Chen and Dr. CS Nam,
for their tremendous support and guidance throughout the development of this research.
Communication and accessibility to advisors are two key components to a successful academic
career, and there was never a shortage of these components in regards to my advisors.
Additionally, I would like to thank my committee members, Dr. David Kaber and Dr. David
Dickey. I sincerely appreciate the effort each of you invested in the development and completion
of my research.
This research was made possible through fellowship support from the NIOSH (National
Institute for Occupational Safety & Health) Southeastern Education and Research Center. A very
special thanks is deserved to NIOSH for affording me opportunities, both academically and in
research, that I will certainly cherish and plan to build upon as I begin my professional career.
The opinions and conclusions of this thesis are mine alone and do not necessarily reflect the
views of NIOSH.
Finally, I want to acknowledge the fellow students in the ergonomics lab as well as those
I have developed relationships with during my time at NCSU. Sanity is (largely) a necessary
factor for completing a thesis, and much of what I was able to maintain can be credited to you
TABLE OF CONTENTS
LIST OF TABLES ... vii
LIST OF FIGURES ... viii
1. INTRODUCTION... 1
2. LITERATURE REVIEW ... 3
2.1 Traditional occupational training ... 3
2.2 Virtual reality-based training ... 5
2.3 Immersion ... 8
2.4 Presence ... 11
2.4.1 Presence response measures... 13
3. PROBLEM STATEMENT ... 19
4. METHOD ... 21
4.1 Participants ... 21
4.2 Independent variables ... 21
4.2.1 Vividness ... 21
4.2.2 Extensiveness ... 22
4.3 Apparatus ... 22
4.3.1 Hardware ... 22
4.3.2 Scenario ... 23
4.4 Experimental Design ... 24
4.5 Experimental Tasks ... 25
4.5.1 Placement task ... 25
4.5.2 Practice task... 26
4.6 Procedure ... 26
4.7 Dependent variables... 27
4.7.1 Percent task accuracy ... 27
4.7.2 Subjective presence ... 27
4.7.3 Subjective workload ... 28
4.7.4 Mean percent HR increase... 28
4.8 Hypotheses ... 28
5. RESULTS ... 31
5.1 Percent task accuracy ... 31
5.2 Subjective presence ... 32
5.3 Subjective workload... 34
5.4 Mean percent HR increase ... 35
5.6 Correlation Analysis ... 36
6. DISCUSSION ... 37
6.1 Percent task accuracy ... 37
6.2 Subjective presence ... 39
6.3 Subjective workload... 40
6.4 Mean percent HR increase ... 41
6.5 Trial effect... 42
6.6 Informal behavioral observations ... 42
7. CONCLUSION ... 43
7.1 Applications ... 43
7.2 Limitations ... 44
7.3 Future work ... 45
REFERENCES ... 47
APPENDICES ... 57
Appendix A: Treatment for participants ... 58
Appendix B: SUS questionnaire ... 59
Appendix C: NASA-TLX ... 60
Appendix D: Informed Consent ... 62
LIST OF TABLES
Table 2.1 Factors influencing immersion ... 9
Table 4.1 Vividness level classifications ... 22
LIST OF FIGURES
Figure 4.1 Virtual scenario (high vividness) in editor mode ... 24
Figure 4.2 Design of complete experiment. ... 24
Figure 4.3 High (Left), Medium (Middle), and Low (Right) levels of vividness. ... 26
Figure 5.1 Mean percent task accuracy across different levels of vividness and
extensiveness (+/- 1 SE) ... 32
Figure 5.2 Mean SUS response across different levels of vividness and extensiveness (+/- 1 SE) ... 33
Figure 5.3 Mean “high” SUS responses across different levels of vividness and
extensiveness (+/- 1 SE). ... 34
Figure 5.4 NASA-TLX response across different levels of vividness and extensiveness (± 1 SE)... 35
Figure 5.5 Mean percent HR increase across different levels of vividness and extensiveness (+/- 1 SE) ... 36
1. Introduction
Training in the workplace is an often necessary step to achieving productivity and safety in a
work setting. It has been shown in a systematic review that raising the proportion of workers
trained in an industry by one percentage point is associated with an increase in value added per
worker of about 0.6% (Dearden, Reed, & Van Reenen, 2006). While many traditional
simulation-based training regimens have been approached through human instruction in front of a classroom
full of trainees, there has been a gradual supplementation and replacement by computer-based
instruction in an attempt to provide a more engaging and cultivating learning environment
(Gunasekaran & Love, 1999). More recently, virtual reality (VR) technologies have seen
involvement in training programs in different applications, including manufacturing and assembly
(Brough et al., 2007; Gavish et al., 2011; Langley et al., 2016).
Though occupational training is an effective tool for productivity and safety, work is still
needed in optimizing these procedures. For instance, upper extremity injuries are common issues
in manufacturing that resulted in lost time, expensive treatment, and occasionally permanent
physical damage (Punnett et al., 2004). Given that VR-based practices have seen increased
research attention, further performance research is desired across areas of manufacturing and
assembly applications.
At the core of detecting realism and involvement within VR technologies are two analogous
concepts, referred to as presence and immersion. Presence has traditionally been quantified using
post-experience subjective questionnaires (Schuemie et al., 2001). Slater (2004) has expressed
concerns over the use of these questionnaires, noting that responses may be compromised when
the topic is discussed and examined. Additionally, the vast list of developed questionnaires can
turned some researchers to exploring objective measures, from neural-based (Slobounov et al.,
2015) to cardiac-based (Meehan et al., 2005; Wiederhold et al., 2001); though the literature on
these measures are sparse and can sometimes conflict in their results.
This research aims at contributing to these current voids in the literature of VR-based
occupational training and objective presence measurements. The current state of literature will
2. Literature Review 2.1 Traditional occupational training
Occupational training aims to provide individuals with the knowledge, skills, and attitudes,
necessary for gainful employment (Campbell, 1997). It has been shown across a variety of
occupational domains that workplace training leads to increased work productivity (Dearden et al.,
2006). Specifically, it was reported that raising the proportion of workers trained in an industry by
one percentage point is associated with an increase in value added per worker of about 0.6%.
Training in the manufacturing sector, often through simulation, remains important because it
allows new operators to learn required functions of the process without the pressure of controlling
actual outcomes (Hosseinpour & Hajihosseini, 2009).
Furthermore, occupational training has been studied to reduce workplace errors, accidents,
and injuries through the use of simulated job situations (Vredenburgh, 2002). For instance, upper
extremity injuries are common issues in manufacturing that resulted in lost time, expensive
treatment, and occasionally permanent physical damage (Punnett et al., 2004). Specifically, the
manufacturing sector accounted for approximately 261,000 cases with days away from work, job
transfer, or restriction according to the 2016 Bureau of Labor Statistics release. It has been shown
that implementing ergonomically instructed training techniques significantly reduced sick leave
reported among a group of assembly workers (Parenmark, Engvall, & Malmkvist, 1988). Though
Gershon et al. (2000) found evidence supporting a relation between safety training and lower
workplace injury rates, a cross-sectional manufacturing review by Geldart et al. (2010) determined
no significant differences among workplace safety with respect to traditional occupational health
and safety training commitment. It becomes important to investigate alternative occupational
Training to improve work performance is seen fields outside of manufacturing, such as
surgical training and military training. Surgical training, for example, can last a decade of advanced
education and up to five years of rigorous residency work, depending on the specialty. This type
of training employs a mixture of highly demanding education and on-site labor under direct
supervision. Yet, there still exists medical errors and it is estimated that up to 98,000 patients die
annually due to preventable medical errors (Anderson, 2004). Of the four medical error
classifications, technical and judgmental errors are largely the result of insufficiency in training.
Similarly, military has a long history of extensive soldier preparation programs. This type
of training focuses on physical fitness and mental resilience through exercise repetition and
discipline (Knapik et al., 2009) . While these methods are regularly being refined for maximum
effectiveness, problems with injuries are still prevalent. Injury rates during military training span
up to 12 per 100 male recruits per month and as high as 30 per 100 per month for Naval Special
Warfare training (Kaufman, Brodine, & Shaffer, 2000). This is a significant issue still being
mitigated through measures such as predictive component identification (Lisman, O’Connor,
Deuster, & Knapik, 2013).
Although various occupations employ training to improve productivity and safety, the
scope of this work aims to study novel factors that may be associated with improving human
performance in terms of workplace productivity and safety. Local industry focus is a major
contributing factor with North Carolina being the home to over 460,000 manufacturing employees
and ranking 5th nationally in manufacturing contribution, according to North Carolina
Manufacturing Extension Partnership.
Though training has traditionally been approached with human instruction in front of a
computer-based instruction (Gunasekaran & Love, 1999). Specifically, a combination of online video
lectures, interactive learning assignments, and evaluation tools are common components of
computer-based training methods (Bengu & Swart, 1996). These modern approaches aim at
providing an engaging and cultivating learning environment.
2.2 Virtual reality-based training
Virtual reality is the participation in a synthetic environment through three-dimensional
and stereoscopic displays (Earnshaw, 2014). There are various media technologies through which
VR can be displayed to users. Examples range from less immersive devices, such as 3D monitors,
to highly immersive technology, such as Cave Automatic Virtual Environment (CAVE) and
head-mounted display (HMD). With a rapid progression in technology and training methods, VR is now
being explored as a new occupational training approach (Cha et al., 2012; Sims Jr, 2000). This
research focuses on exploring occupational using HMD, due to the recent surge in popularity and
accessibility of portable HMDs.
An attractive aspect that draws training programs to VR is the ability to visually replicate
expensive equipment or difficult task scenarios with relative ease, all while maintaining an
extended sense of realism. Trainings performed in VR or a simulated environment could be safer
and economically practical. For instance, VR-based surgical training offers surgeons the
opportunity to acquire surgical skills without operating a real patient nor occupying operating
rooms, which could be used to perform actual surgeries for those with needs. Seymour et al. (2002)
was the first research team to demonstrate the effectiveness of VR surgical training simulation in
a randomized, double-blinded study. Sixteen surgical residents were split between two groups,
where one used non-VR, standard programmatic training appropriate for postgraduate level and
removal. The MIST (Frameset v. 1.2), VR-based training system, was used as the VR apparatus
through a computer monitor. Not only did the residents who received specialized VR-based
training dissected 29% faster, but were also nine times less likely to transiently fail to make
progress and five times less likely to cause an injury to the gallbladder.
The Department of Defense has expressed financial interest in the potential of VR-based
training systems, developing a novel software titled Distributed Interactive Simulation (Durlach
& Mavor, 1995). While initially developed to simulated a detailed reconstruction of the 73
Eastings battle during the Persian Gulf War, more recent researchers are using this software
platform to reconstruct virtual battlefields for ground warfare training using HMDs (Yao et al.,
2013).
The use of VR-based is not limited to surgery and military; Boud et al. (1999) was among
the first to notice the potential of VR-based assembly training and test its effectiveness in an
empirical study. Conventional assembly training method (i.e. physical 2D engineering drawing)
was compared to two modern training methods, which were VR and AR, as a means for displaying
instructions. Augmented reality (AR) integrates and overlays 3D virtual objects onto the physical
world, usually through computer-generated headsets or glasses such. Modern examples of AR
include Google Glass or Microsoft HoloLens. The VR-based training method used an HMD
(Virtual Research, VR4), which had a 240x120 resolution display and 60˚ field of view. A
see-through, monocular, and monochrome HMD developed by Seattle Sigh was used for the AR-based
training. Task completion times were significantly lower in both of the virtual techniques (i.e. AR
& VR) compared to the conventional method. The results did not show outstanding VR-based
the same experimental setup, Boud et al. (2000) revealed that VR-based training yielded
significantly lower task completion time.
Brough et al. (2007) discussed and examined the effectiveness of virtual assembly training
task of a novel VR-based assembly operations training system. This proposed system used a
consumer-level HMD with interactive wands, which was compare to a traditional video-based
training method. User preference was evaluated as part of the experimental design. Aside from the
ability to support a wide variety of training preferences, the VR-based training system matched or
exceeded almost every users’ expectations, according to pre and post-session questionnaires.
Gavish et al. (2011) compared VR and AR-based training platforms to instructional videos in terms
of training time, performance time, number of unsolved errors, and number of solved errors in an
assembly and industrial maintenance task. These assembly training experiments were then
followed by a “Transfer of Skill” evaluation, which assessed the assimilation of skills through both
qualitative and quantitative methods. While AR-based training was shown to significantly
decrease the number of unsolved errors in the task, both platforms were revealed as useful training
instruments in regards to “Transfer of Skill” evaluation, relative to instructional videos. Langley
et al. (2016) aimed to investigate the effectiveness of their novel VR-based training system
prototype using both performance metrics and subjective usability responses in an automotive
manufacturing assembly training assignment. When compared to conventional training methods
(specific details not contained in study), individuals received VR-based training had lower average
task completion time and less overall error. In addition to the increase in overall performance,
users expressed subjective preference to the VR-based system.
The effectiveness of these VR-based manufacturing training programs are mixed, yet
scenarios, yet participants in the HMD condition did not yield different performance outcomes
from AR-based training. The key difference between these two media being immersion involved.
While responses across the board were positive for Langley et al. (2016), an RGB-D sensor
(Microsoft Kinect) was the selected system VR apparatus. This technology is a very effective and
interactive system for certain purposes but has certain technical limitations when comparing to
current HMDs. Specifically, there are rarely mentions of immersion in VEs when discussing
industrial training and the effect that immersion can have on user experience.
2.3 Immersion
Out of all of the aforementioned manufacturing VR training studies, none mentioned the
impact of immersion, which is the measurable features of VR technology that could make a user
feel present in a virtual environment (VE). Moreover, many of the earlier studies have not
examined immersion-related variables and their effects on training outcomes. This seems
surprising, as immersion and presence have often been leveraged as characteristics of VR research
worth manipulating, which will be further discussed in the following sections. To understand the
direction of this research, the terms immersion and presence must be first defined and differentiated as they can often be used interchangeably by mistake.
Slater has laid out a series of definitions for immersion that will be used in this work (Slater,
2003). Immersion is what a technology delivers from an objective measure. The more that a system conveys displays that preserve fidelity in relation to their corresponding real-world sensory
modalities, the more that it is ‘immersive’. Immersion is something that can be objectively
assessed based on capabilities of the hardware and software being used. While there are no widely
accepted methods for objectively quantifying immersion, some research groups have attempted to
quantifying immersion in video games. The effectiveness of this framework was later tested using
a computer game, titled Half Life (Jennett et al., 2008). The hypotheses were supported through
statistical analysis revealing statistically significant differences between the subjective responses
in the immersive and control scenarios.
Immersion, which is a technological aspect of VR, has demonstrated positive effects of
education and training. Immersion is a technologically-based and quantitative foundation which
describes the extent to which users can feel part of the environment. Researchers have long
examined the impact that immersion levels have on human performance and behavior (Gruchalla,
2004; Santos et al., 2009). Less research, however, has examined immersion at the level of core
principles which define it.
Several factors influence the level of immersion. Specifically, Slater & Wilbur (1997)
identified five primary factors of immersion. Table 2.1 presents these five factors, their brief
definitions, as well as the originating support research for inclusion.
Table 2.1: Factors influencing immersion.
Factor Brief definition Original support research
Inclusive The extent to which physical reality is shut out
(Slater & Usoh, 1992)
Vividness The resolution and fidelity simulated within a particular modality
(Welch et al., 1996)
Proprioceptive matching
Match between the user’s body movements and the information generated on the displays.
(Hendrix & Barfield, 1996a)
Extensiveness The range of sensory modalities accommodated
(Hendrix & Barfield, 1996b)
Plot The extent to which the VE presents a
story-line and dynamic that are distinct from those currently going on in the “real world”
We are particularly interested in studying vividness and extensiveness for a couple of
reasons. Vividness is of interest because of its heavy reliance on visual stimuli. Since virtual
environments are graphical interfaces, humans heavily rely on their visual sensory system to
perceive their surroundings. Research has shown the value of visual feedback through
demonstrating the importance of visual fidelity (McMahan et al., 2012) as well as latency (Meehan
et al., 2003). McMahan et al. (2012) found that task completion time and accuracy were
significantly affected by visual display and interaction fidelity in a VR gaming scenario. Moreover,
the VE with low latency (i.e. low lag of frame rate update) led to a higher subjective sense of
presence (Meehan et al., 2003). Given VR is primarily a visual experience (Katz et al., 2008; Weiss
et al., 2004), modifications to the scene vividness should result in significant effects.
Additionally, from an experimental design perspective, researchers can quickly manipulate
and study different levels of vividness. For example, Slater & Wilbur (1997) use shadows as an
example of vividness manipulation. Wang & Doube (2011) manipulated vividness using gradient
and color variance to shadow softness as a method of vividness manipulation. More recently,
Toczek (2017) used a texture resolution approach, populating high and low vividness conditions
with objects of varying pixel resolution. Specifically, 3D mountains in the “highly-realistic” scene
were 8192x8192 resolution whereas the “unrealistic” scene contained mountains with 1024x1024
resolution. These established adjustments are beneficial for VR training program designers when
settling on appropriate visual changes. While the specific methods to manipulate vividness are
somewhat subjective and generally vary from study to study, our research uses a structured and
detailed approach, outlined in the methods section.
Next, sensibly modifying extensiveness in VR studies has been shown to have a significant
results from Ma & Kaber (2006) indicated that change in the presence of auditory feedback in a
virtual basketball scenario elicited statistically significant differences in subjective workload.
Similarly, Corbett et al. (2016) showed that task time and root mean square of error were
significantly improved in a VR pointing task when presented constant haptic assistive feedback.
These types of research are not uncommon; with a majority of extensiveness studies focusing on
technological accessible sensory modalities such as audio and haptics. While both vividness and
extensiveness have been evaluated as independent variables across a number of studies, rarely are
the two used in conjunction to determine cross effects.
Based on the results of these similar studies, it is hypothesized that greater immersion in
occupational training scenarios could support enhanced outcomes. This area has not been fully
studied.
2.4 Presence
Although presence is generally described as a human reaction of feeling involved and part
of the experience, various models of presence have been formulated throughout the years of VR
research. Lee (2004) suggested the evolution of presence theories. ‘Telepresence’ is a separate yet
similar term, traditionally used to describe the possibility that remote users could feel a sense of
being physically transported through a teleoperating system, first used in literature by Minsky
(1980). The evolution of models of telepresence and presence are strongly linked as they are often
used synonymously, sometimes to the confusion of researchers. Sheridan (1992) refers to
telepresence as “feeling like you are actually there at the remote site of operation”. Draper et al.
(1998) generally defines telepresence as “an experience that appears to involve displacement of
the user’s self-perception into a computer-mediated environment”, though notes that it is used
also showed evidence of a relationship between presence and expenditure of attentional resources
during teleoperation, using the NASA-TLX.
Presence is then defined by Witmer & Singer (1998) as the “subjective experience of being
in one place or environment, even when one is physically situated in another”. Witmer & Singer
also define immersion as a psychological state characterized by perceiving oneself to be enveloped
by, included in, and interacting with an environment that provides a continuous stream of stimuli
and experiences (Witmer & Singer, 1998). This line of thinking has received criticism from Slater,
claiming that it measures user response to various aspects of a system rather than presence (Slater,
1999). From each of these models of presence, Slater’s framework is used as foundation of this
research due to its simplicity, consistency, and wide-spread use across literature.
Referring back to Slater’s definitions, presence is a human reaction to immersion (Slater,
2003). That is to say, the greater level of immersion afforded to a user, the greater potential that
presence is extended. This hypothesized relationship is a question constantly studied by inquiring
research groups and described in a number of literature. It was concluded in a meta-analysis by
Cummings & Bailenson (2016) that immersion has a medium-sized effect on presence via
questionnaire response from a pool of 83 studies.
Additionally, research has investigated the contribution that further characteristics, such as
media content, play on presence (Baños et al., 2004). In this research, we are more interested with
the relationship between immersion and presence. Bowman et al. (2007) highlighted this
relationship while also building upon it, providing a restructured approach that treated presence as
a list of immersive benefits derived from immersive components. They believed that presence
would have an impact on application effectiveness, which led to the hypothesis that greater
rudimentary in explanation, this relationship can be shown throughout literature, which much of
the literature still trying to answer the key question on how much immersion is enough to lead to
presence and where the resources should specifically be allocated to improve immersion.
Despite the hypothesized relationship between immersion and presence, researchers also
pointed out another factor that affects presence. Some research suggested that the inherent
differences among users disallow us to treat immersion and presence as discrete and static factors.
Slater (2003) noted that systems with identical levels of immersion, different people may
experience different levels of presence, and also different immersive systems may give rise to the
same level presence in different people. While little empirical evidence, these hypotheses appear
evident in auxiliary questionnaires catered to determine individual differences in immersive
tendencies (Witmer & Singer, 1998).
2.4.1 Presence response measures
Considering the mass attention placed on presence in VR, a seemingly equal amount of
focus has been placed on determining effective methods to quantify these levels of presence.
Presence could be quantified by subjectively and objectively. This separation is based on a 2015
review which assessed the current state of presence measures (Laarni et al., 2015). Further
discussion regarding individual measures within each of the two categories and some recent works
follows.
Subjective presence response is traditionally self-report questionnaire based. While a
number of questionnaires have developed, the evolution of these questionnaires can be traced back
to the work from Slater and colleagues (Slater, Usoh, & Steed, 1994). The most commonly used
subjective presence questionnaires in empirical studies are SUS, PQ, IPQ, ITC-SOPI, and Temple
• The Slater-Usoh Steed (SUS) questionnaire aimed at measuring presence in immersive
VEs (Slater et al., 1994). Although the reliability of this 6-item questionnaire was not
published by the authors, the SUS remains one of the most widely used tools in VR
presence studies according to the review by Rosakranse & Oh (2014). Furthermore, a series
of studies have been conducted showing correlation between the questionnaire results and
objective measures of immersion (Slater, Usoh, & Steed, 1995; Usoh et al., 1999).
• The Presence Questionnaire (PQ), developed by Witmer and Singer (1998), is a 32-item
questionnaire designed to measure presence in immersive and semi-immersive VEs. Four
experiments were conducted to perform a reliability analysis, yielding a respectable =
0.88 (Cronbach’s, N = 152).
• The IGroup Presence Questionnaire (IPQ) was also designed to measure presence in VE’s (Schubert, Friedmann, & Regenbrecht, 2001). This 14-item questionnaire measures
presence across three factors, presence as transportation, presence as immersion, and
presence as realism. Two internal experiments yielded high reliability ( = 0.85, = 0.87)
as validation of tool utility.
While the SUS, PQ, and IPQ work as measurements of presence within a VE, further
subjective presence questionnaires have been developed with the intention of measuring presence
across media environments.
• The ITC-Sense of Presence Inventory (ITC-SOPI) is a 44-item, cross-media presence
sub-factors range significantly from sense of physical space ( = 0.94) to ecological validity
( = 0.76).
• The Temple Presence Inventory built upon the existing ITC-SOPI, developing a separate
42-item, cross-media presence questionnaire (Lombard, Ditton, & Weinstein, 2009).
Reliability of this tool ranged significantly based on the presence indices just as the
ITC-SOPI, but Cronbach’s alpha for overall index was high ( = 0.87). The use of presence
questionnaires across media environments has been questioned in certain situations by
Usoh et al. (2000).
While questionnaires still remain vital and research continues in improving these tools, it
is not difficult to imagine why issues might arise when using subjective surveys to measure
cognitive experiences. Slater (2004) highlighted this concern by administering a similar survey
(outside of VR) but measuring an arbitrary mental attribute, called “colorfulness of experience”.
It is pointed out from this experiment that similar administering in VR experiments may bring the
idea of presence in the mind of VR participants, compromising the integrity of results. Thus,
objective responses have been considered as replacement, or at least supplementation, for
subjective presence questionnaires. Meehan et al. (2002) includes “objective” as one of the four
pillars of pursued presence measures, along with “reliable”, “valid”, and “sensitive”. These
proposed objective responses are contained within nebulous sub-categories, including
performance-based, behavior-based, cognitive feedback, and other physiological responses.
Performance-based responses take form as memory or other performance metrics. Some
evidence has shown that presence is positively correlated with memory. A study by Mania &
using computer monitors and HMDs, which represented media of different immersive levels.
Results indicated superior performance in the more immersive settings, which corresponded with
higher subjective presence responses, taken from the SUS questionnaire. On the other hand, Slater
et al. (1996) reported a positive correlation between memory and immersion but not with reported
presence, from a reduced form SUS questionnaire, during a VR chess-move replication task.
Additional performance related metrics, such as task completion time estimation have shown some
limited correlation to presence (IJsselsteijn et al., 2001).
Detecting fear or danger within a VE is a revealing sign of immersion and has been
connected to virtual presence research. Peperkorn et al. (2015) observed a strong correlation
between fear and presence during a virtual spider exposure therapy treatment, but noted that the
causal relationship between the two remains unclear. Presence, in this case, was recorded using
three metrics, including a self-report questionnaire. Since these fear responses to certain
unexpected stimuli are largely unavoidable, they can be effective in assessing immersion, and often
detecting presence. Additionally, involving physical movements in VR experiences may lead to
increasing presence. Slater & Steed (2000) reported a significant correlation between body
movement and presence during a three-dimensional chess task. Specifically, greater movement in
a VE is associated with higher levels of reported presence, recorded using a reduced SUS
questionnaire. Reliability and validity can be limiting factors of behavior-based presence
measures, as there are no collectively accepted methods of measurement.
More recently, brain imaging technology has been utilized as an objective estimate of
presence. Such devices like electroencephalography (EEG) and functional magnetic resonance
imaging (fMRI), are on the forefront of VR presence research. Baumgartner et al. (2008) was the
using fMRI. Presence was recorded using the MEC spatial presence questionnaire. However, brain
imaging methods may not be easily applied to research. Not only are these devices challenging to
obtain and operate, but also cumbersome and may reduce the detachment from reality, which is
vital to feeling present in VEs. This use, then, may work against the goal of the presence research.
Additionally, it is difficult to yield highly-immersive VR systems (e.g. HMD) when hooked into
such large and bulky devices. Some studies have attempted to configure systems and experimental
structures using highly immersive devices and also measure brain activities. During a VR
navigation study using a portable EEG, Slobounov et al. (2015) found that an FM-theta band
increase was significantly associated with a higher reported sense of presence, in addition to
greater task success rate. Subjective presence was recorded by a one-question scale, asking the
participants “strength of presence”. Similar to fear exposure, causality will remain a limitation
until a larger body of research is gathered, according to the literature that was gathered during this
review. Given the amount of brain regions to be studied in association to virtual presence, research
in this field may just be in its beginning phases. Advances in obtrusiveness and usability of brain
imaging technologies should expedite the exposure of these association, if possible.
Further objective, physiological measurements of presence have been studied. Galvanic
skin response (GSR) was considered in a series of studies by Meehan et al. (2005), revealing no
significant association between change in skin conductance and users reported sense of presence,
recorded by the University College London (UCL) questionnaire. On the other hand, a positive
correlation between change in heart rate (HR) and reported sense of presence was been revealed
as part of the study (Meehan et al., 2005). The research team displayed a virtual pit through an
HMD, which aimed at eliciting reaction through fear of height. Frame rate (30 FPS, 20 FPS, 15
an immersive HMD equipped with audio and haptic feedback, a negative correlation between HR
and reported sense of presence was reported by Wiederhold et al. (2001) during a VR flight
simulation. The Questionnaire on Presence and Realism was used as the self-report presence
response. This lack of consensus among correlation directions can generally be explained by
understanding the emotional hedonic valence associated with the virtual task. Another significant
takeaway from the HR results is the demonstrated ability to correlate significantly with reported
sense of presence. While the direction of correlation depends largely on the hedonic valence,
gathering cardiac response data is a simple and economical method for collecting objective
3. Problem Statement
From this literature review, it can be seen that many virtual reality industrial training
studies are concerned with task time as the dependent variable. While time to train is important
due to wage restrictions, this study will be among the first in this domain to focus on task accuracy
as a dependent variable. Our group values this metric because of the independent variables being
investigated. One of the goals is to determine the effect that two immersion factors, vividness and
extensiveness, have on human performance. This being the case, minute accuracy will almost
certainly differ between virtual and real settings. Those differences are hypothesized to be evident
when altering the immersive factors. Additionally, accuracy is undoubtedly a factor that
contributes to human performance.
While the relationship from immersion to presence to application effectiveness can be seen
through literature (Bowman et al., 2007; Cummings & Bailenson, 2016), it is important to
determine how much immersion is necessary for sufficient effectiveness in certain applications.
Optimal immersion would understandably be expected if given the choice, it might not be required
in all scenarios, however. Additionally, time constraints during scenario design and resource
allocation might not allow for optimal immersion. Audio cue and visual fidelity design can range
from relatively simple to rather labor intensive. Part of this experiment focuses on the task
performance at varying levels of immersion, which correspond with increasing time commitment
in design.
Much of the research in immersion evaluates human performance outcomes with subjective
measures (Schuemie et al., 2001). Little has explored these topics with objective measures as an
additional point of reference. Overall, objective measures of presence still need to be studied. To
to accompany potential objective measures of presence with known subjective measures of
presence. By using objective methods in supplementation with subjective questionnaires, a clearer
picture can be formed regarding the cognitive structures of presence.
The overarching goal of this study is to investigate the effect of immersion on human task
performance in an occupational setting in a VE. The first objective was to investigate the effect of
immersion on task performance accuracy in the VE. While both safety and performance were
identified in the literature review in association with training methods, only performance is
addressed in this study. The second objective was to examine the effect of immersion on subjective
responses and objective physiological measures of humans in the VE. More specifically, subjective
responses were participant subjective ratings on surveys. Objective physiological measures were
heart rate that were measured by a portable heart rate monitor. HR was measured and normalized
to the individual participant’s baseline HR. It is important to look at physiological responses
because physical aspects of different immersion level exposures have not been comprehensively
investigated, and it is an objective, quantifiable, and measurable dependent variable. From these
4. Methods 4.1 Participants
Thirty participants were recruited from North Carolina State University (NCSU) [age =
21.4 4.01; 10 female, 20 male]. Flyers were posted around NCSU campus as a recruitment effort.
Participants were at least 18 years of age and possessed normal or corrected-to-normal vision.
Compensation was paid at a rate of $10 per session, with one full session being the maximum
allowed per participant. Each session lasted approximately 1.5 hours. Participants were excluded
if they self-reported neuro-motor impairments, a history of seizures or blackouts, tendency of
motion sickness, and/or a sensitivity to flashing lights. Informed consent, approved by the NCSU
Institutional Review Board, was received from all participants.
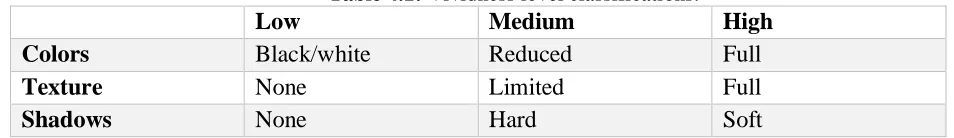
4.2 Independent Variables 4.2.1 Vividness
Vividness is associated with the resolution and fidelity simulated within a particular
modality. This experiment used three levels of vividness, those being low, mid, and high. High
vividness scenarios were designed to be the “most realistic” while the low vividness scenarios
were designed to be the “least realistic”. These differences were made evident by use of colors,
textures, and shadows (Table 4.1). Soft shadows have been shown to be “more real” than hard
shadows in virtual scenes (Wang & Doube, 2011). It is worth noting that factors within vividness
are not examined individually in their relation to the dependent variables, due to the structure of
level classifications. The low vividness level was created in roughly four hours, once trained in
the software. Each additional vividness level required another four hours of labor to implement
Table 4.1: Vividness level classifications.
Low Medium High
Colors Black/white Reduced Full
Texture None Limited Full
Shadows None Hard Soft
4.2.2 Extensiveness
Extensiveness is associated with the range of sensory modalities accommodated. This
experiment used two levels of extensiveness, those being audio cues and no audio cues. Audio
cues were in the form of standard industrial environment sounds; such as machines in operation.
The trials that had audio cues were displayed through the noise-canceling headphones. The sound
pattern was identical across each of the three scenes containing audio cues. Headphones were
equipped but muted during no-audio trials. All practice trials were done in no-audio trial scenarios
so that verbal communication between participant and experimenter could be possible if necessary.
4.3 Apparatus 4.3.1 Hardware
The entire head-mounted display system (HMD; HTC Vive, HTC Corp., New Taipei City,
Taiwan) included the HMD, two wireless controllers, and two base station mounts serving as the
tracking system. The HMD was responsible for displaying visual information, such as the virtual
environment, to the participants. The HMD has a combined resolution of 2160x1200 (1080x1200
per eye), a 90 Hz refresh rate, and 110 field of view. Both Vive controllers were yielded by the
participant during trails, performing as virtual hands. A trigger located on the underside of the
controllers can be activated to “grab” virtual objects. The base station mounts were capable of
tracking head and hand orientation. Noise-canceling headphones were used for over-the-ear audio
used to record cardiac activity (Polar H7 Bluetooth Smart Heart Rate Chest Transmitter, Polar
Electro Inc., Lake Success, NY).
4.3.2 Scenario
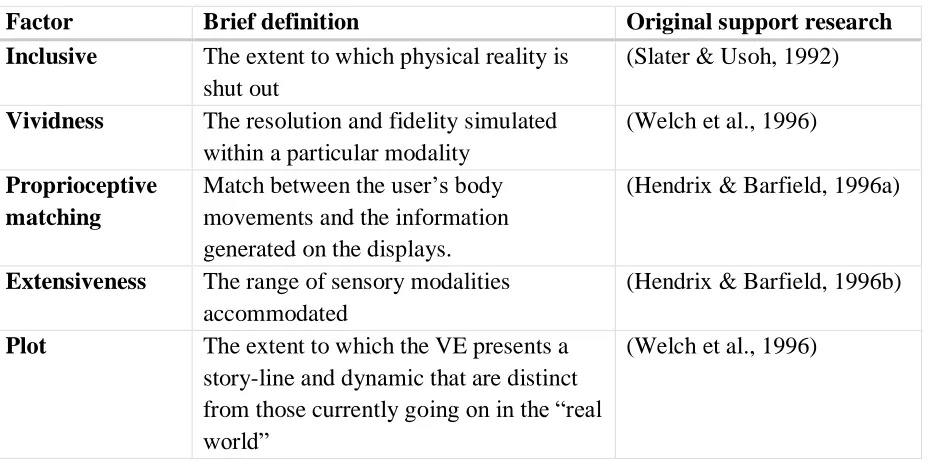
Unity, a cross-platform game engine, was used for developing the virtual environment
scenario (Unity Technologies, San Francisco, CA). The scenario (Figure 4.1) displays a virtual
manufacturing plant, including 40 cylindrical air filters placed on a table, 36 cardboard boxes
placed on an operating conveyor belt, and additional manufacturing-related objects included to
make sure the plant floor was not completely empty. White figures represented in Figure 4.1,
including the speaker symbol and camera symbol, are only visible in editor mode. Same goes with
the box surrounding the camera symbol. The conveyor belt was placed 42 inches above the floor,
which was designed to fall within the NIOSH standing workspace height recommendations. Long
conveyor belts were used to maximize the amount of boxes on a single belt and minimize the
chance of a box falling off during belt transition. Boxes were equally spaced 5 feet apart to ensure
a consistent arrival stream across all trials. Each side of a virtual cardboard square box had a
dimension of 12x12x12 cubic inches. Each cylindrical air filter was 4 inches in diameter and 8
Figure 4.1: Virtual scenario (high vividness) in editor mode.
4.4 Experimental Design
A 3x2 factorial design (vividness X extensiveness) was employed (Figure 4.2). The factors
were vividness and extensiveness. The first letter shown in Figure 4.2 represents the vividness
level while the second letter represents whether or not auditory cues are present. SUS and
NASA-TLX were administered after every three trials There were three levels of vividness (low, medium,
and high) and two levels of extensiveness (auditory cues present or absent). All participants
experienced all six combinations of vividness and extensiveness. There were three replications for
each of the six combinations, which were repeated consecutively, which resulted in 18
experimental trials (Figure 4.2). For instance, “low vividness and auditory cues” combination was
repeated three times before moving onto the next combination.
Five unique 6 x 6 Latin squares were used to randomize the order of presentation of
combinations across test trials. Literature on the original SUS development study suggested that
participants needed to have at least 7 minutes of exposure to a scenario prior to evaluating their
sense of presence (Slater et al., 1994). Based on the literature, participants in this study experienced
all six combinations for a minimum of 7 minutes before administering the SUS (Figure 4.2). While
participants completed SUS, they were also instructed to complete the NASA-TLX in order to
capture their subjective workload for a particular combination. The length of the session was
designed in attempt to minimize the likelihood of virtual simulator sickness as Kennedy et al.
(2000) characterized duration-exposures between 0 and 1 hours as “safe” in regards to simulator
sickness.
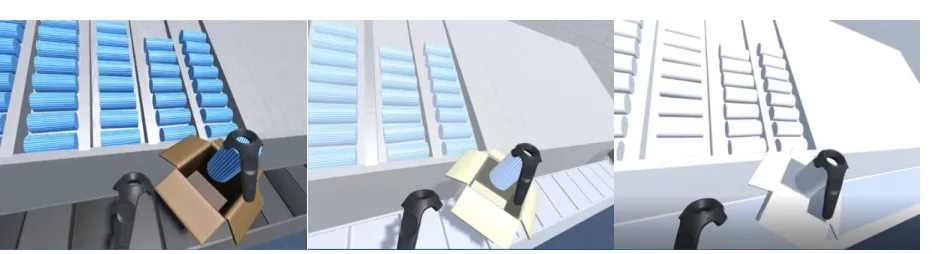
4.5 Experimental Tasks 4.5.1 Placement task
The main experimental task consisted of picking up a virtual air filter and placing it in a
box that is arriving on a moving conveyer belt. Only one air filter was to be placed inside a box.
The placement location and orientation of the air filter were accounted for in predefined spaces
inside the virtual box (Figure 4.3). All three levels of vividness in Figure 4.3 are illustrating a user
moving two controllers and placing an object into an incoming box on a moving conveyer belt.
Participants were instructed to pick up and place an air filter as closely to the center of the box
bottom surface, and they were asked not to skip any boxes. Participants were instructed to stay
standing throughout the task duration and within the 3-foot diameter circle surrounding the starting
position, which was displayed in the virtual environment. This circle is programmed through Unity
and displayed through HTC Vive throughout each task. All tasks were completed within one
Figure 4.3: High (Left), Medium (Middle), and Low (Right) levels of vividness.
4.5.2 Practice task
The practice task was administered prior to data collection. It was similar to the placement
task, which aimed to familiarize participants in viewing virtual scenes and interacting with virtual
objects using VR devices, as well as to reduce learning effects. The practice task consisted of
picking up virtual objects, in the form of air filters, and placing them in boxes on a moving
conveyer belt. Participants were complete with practice trials when 10 consecutive successful filter
placements occurred, which lasted approximately 1.5 to 2 minutes.
4.6 Procedure
Upon informed consent, participants were given a general demographic questionnaire upon
arrival as well as the Immersive Tendencies Questionnaire (ITQ) to capture differences in the
tendencies of individuals to experience presence. Participants were then equipped with the HMD
and HR monitor and completed practice task until 10 consecutive filters were placed into
oncoming boxes.
Each participant completed the placement task for all six combinations of immersion
according to the planned Latin square. Practice trial assignments were then randomized for each
experimental treatment for participants can be found in Appendix A, with the experimental trials
shaded.
Each placement task trial lasted approximately 150 seconds with a total of 36 boxes moving
across the conveyors per trial. The SUS questionnaire and NASA-TLX were administered every
three trials. The HMD and HR monitor were not removed for the entirety of trials unless significant
discomfort was revealed by a participant. Following the completion of all experimental trials, the
participants sat still for 5 minutes to determine a baseline cardiac activity level, in terms of beats
per minute. Behavioral observations were noted by the experimenter during trials, looking for
common tendencies or unusual behavior.
4.7 Dependent variables 4.7.1 Percent task accuracy
Percent task accuracy was the number of accurate placements within a trial divided by 36
(i.e. the total number of boxes in a trial). Filters placed within a 7-inch diameter circle on the
bottom surface of the box were operationally defined as “accurate”, while placements outside of
the circle “inaccurate”. Placements outside of the box, due to boxes falling during conveyor
maneuver out of control of the participant, were excluded from the analysis. These cases made up
only 1.8 percent of all placement possibilities. A series of C# scripts were developed and utilized
in Unity to extract all relevant data.
4.7.2 Subjective presence
Two unique values derived from the same six-question SUS questionnaire (Slater et al.,
1994) responses were evaluated. First, mean values from responses of the 6-item SUS presence
questionnaire were calculated before analysis. Second, “high” SUS responses were calculated from
4.7.3 Subjective workload
An online NASA-TLX tool from Sharek (2011) was used for perceived workload
evaluation on this experiment. One of the fifteen pairwise comparisons can be found in Appendix
C. Ratings were combined to compute an overall workload score for each test trial. The overall
NASA-TLX score is the combined weighted response of from the subscales: demand, including
physical, mental, effort, performance, frustration, and temporal.
4.7.4 Mean percent HR increase
Heart rate was focused as a dependent physiological and objective presence response due
to ease of collection compared to brain imaging devices as well as accessibility. If HR is to be used
in VR training, it is important that researchers and training designers be able to easily access the
necessary technology. Additionally, modern HR recording devices are unobtrusive and do not pose
physical conflicts to VR technology. All HR observations were recorded and normalized to
account for individual differences. Normalization was achieved by subtracting mean resting HR
from test responses and dividing by the mean resting HR response for each participant.
4.8 Hypotheses
H1. It was hypothesized that greater immersion, characterized by vividness and extensiveness,
would lead to improved performance, which is characterized by increased task accuracy.
This positive relationship between task performance and immersion has been seen in
similar VR studies (Ma & Kaber, 2006; McMahan et al., 2012).
H2. It was also hypothesized that greater immersion would lead to higher subjective presence,
both in mean and high responses from the SUS questionnaire. Response on SUS
questionnaire has shown to be sensitive to increases in immersion via shadow adjustment
H3. NASA-TLX was hypothesized to be significantly affected by greater immersion. Perceived
workload by the NASA-TLX has shown to be a sensitive tool in VR studies, associated
with changes in extensiveness and presence (Draper & Blair, 1996; Ma & Kaber, 2006).
H4. Finally, it was hypothesized that greater immersion would significantly affect normalized
heart rate, recorded by a portable heart rate device. Prior literature shows a mixed
relationship between immersion and cardiac response (Meehan et al., 2005; Wiederhold et
al., 2001).
4.9 Data Analysis
Diagnostics were conducted on all response measures to assess normality and constant
variance assumptions of the ANOVA model. Shapiro-Wilk’s test was used for assessing
conformance with the residual normality assumption. Bartlett’s test was used to assess data
conformance with homoscedasticity. In the case of assumption violations, data transformations
were applied.
Two-way ANOVA models were developed to test the effect of vividness and extensiveness
on the dependent variables, with the level of statistical significance set at = 0.05. Based on the
experimental design, an Analysis of Variance (ANOVA) model was constructed to assess the
effects of vividness and extensiveness on the various response measures. The statistical model was
structured as follows:
Where = grand mean; i = vividness effect (i=1, 2, 3); j = extensiveness effect (j=1, 2);
k = participant effect (k=1 … 30); ij= interaction between vividness and extensiveness; Eijk:
Error.
Spearman’s correlation analysis was conducted between normalized heart rate and mean
5. Results
Among the response measures, SUS mean responses met all ANOVA normality
assumptions. Mean percent HR increase responses, task accuracy, SUS high responses, and
NASA-TLX responses were successfully transformed for analysis. Table 5.1 represents mean and
standard deviation values of each of the dependent variables values in regards to the immersive
level scenarios. As a note, SUS mean is on a 1 (low presence) through 7 (high presence) scale,
while SUS “high” count is on a 1 (low presence) through 6 (high presence) scale.
Table 5.1: Mean [SD] of dependent variable values by immersive level scenarios Immersive Level Percent task
accuracy SUS mean SUS “high” count NASA-TLX Mean percent HR increase
Low vividness; No audio 85.00% [17.33] 3.63 [1.26] 1.07 [1.60] 29.43 [15.48] 0.15 [0.07]
Medium vividness; No audio 85.18% [17.92] 4.07 [1.29] 1.34 [2.02] 26.66 [12.77] 0.14 [0.08]
High vividness; No audio 85.92% [17.76] 4.19 [1.10] 1.03 [1.67] 25.64 [12.27] 0.15 [0.09]
Low vividness; Audio 86.84% [13.56] 4.09 [1.41] 1.79 [1.94] 29.05 [16.24] 0.14 [0.08]
Medium vividness; Audio 86.51% [17.52] 4.14 [1.20] 1.72 [2.05] 30.60 [16.16] 0.16 [0.09]
High vividness; Audio 87.82% [14.08] 4.71 [1.19] 2.21 [2.09] 26.35 [12.03] 0.14 [0.08]
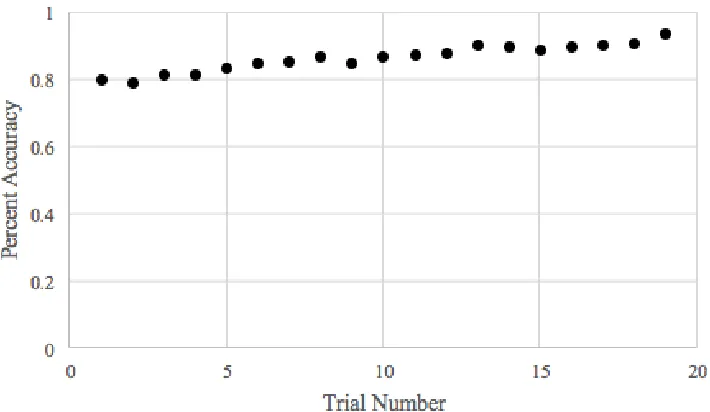
5.1 Percent task accuracy
Percent task accuracy was derived from the raw task accuracy data (number of accurate
placement divided by the total number of placement). Figure 5.1 shows mean percent task accuracy
across different levels of immersion. Box-Cox transformation was applied to the normalized
accuracy data for statistical analysis since they did not meet normality assumptions initially. A
0.1515) nor extensiveness (F (1, 139) = 0.7256, p = 0.3958). There was no statistically significant
interaction effect between vividness and extensiveness (F (2, 139) = 0.4013, p = 0.6702).
Figure 5.1. Mean percent task accuracy across different levels of vividness and extensiveness (+/- 1
SE).
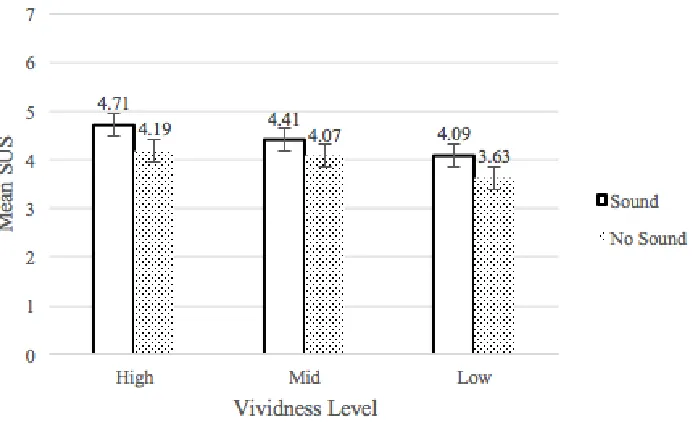
5.2 Subjective presence
Mean SUS rating across the 6-item questionnaire was used as the primary measure of
subjective presence, originally used in this format by Usoh et al. (2000). Mean SUS response data
met normality and homoscedasticity assumptions. A two-way ANOVA indicated a statistically
significant main effect of vividness (F (2, 145) = 9.9102, p < 0.01). A 0.20 decrease in SUS was
seen between high and mid-level vividness while mid and low-levels yielded a 0.92 decrease. A
statistically significant main effect was found for extensiveness (F (1, 145) = 21.5030, p < 0.01).
Removing the auditory cues from the scenario decreased the mean SUS response by an average of
0.44. No statistically significant interaction effect was found between vividness and extensiveness
high and low levels of vividness. Figure 5.2 shows mean subjective presence response in terms of
mean SUS score across different levels of immersion.
Figure 5.2: Mean SUS response across different levels of vividness and extensiveness (+/- 1 SE).
The average count of 6 or 7 responses across the 6-item SUS questionnaire were noted as
“high” SUS responses, initially used in this format by Usoh et al. (2000). “High” SUS response
data met normality and homoscedasticity assumptions. A two-way ANOVA indicated no
statistically significant main effect of vividness (F (2, 140) = 1.4380, p = 0.2409). A statistically
significant main effect was found for extensiveness (F (1, 140) = 15.8886, p < 0.01). Removing
the auditory cues from the scenario decreased the high SUS responses by an average of 0.75. No
statistically significant interaction effect was found between vividness and extensiveness (F (2,
145) = 1.1098, p = 0.3325). Figure 5.3 shows average “high” subjective presence responses across
Figure 5.3: Mean “high” SUS responses across different levels of vividness and extensiveness (+/- 1
SE).
5.3 Subjective workload
Aggregated NASA-TLX response data met normality and homoscedasticity assumptions.
A two-way ANOVA indicated a statistically significant main effect of vividness (F (2, 138) =
3.8304, p = 0.0240). A 2.65 increase in NASA-TLX was seen when going from high to mid-level
vividness while mid to low-levels yielded a 0.49 increase. No statistically significant main effect
was found for extensiveness (F (1, 138) = 1.1276, p = 0.2902). A marginally statistically significant
interaction effect was found between vividness and extensiveness (F (2, 138) = 2.8347, p =
0.0622). Figure 5.4 shows mean subjective workload response across different levels of
immersion. None of the weighted NASA-TLX subscales (mental demand, physical demand,
temporal demand, performance, effort, and frustration) were found to be significantly affected by
Figure 5.4: NASA-TLX response across different levels of vividness and extensiveness (± 1 SE)
5.4 Mean percent HR increase
Mean percent HR increase data were obtained by dividing the difference between raw heart
rate and baseline heart rate data by the baseline heart rate of the participant. Figure 5.5 shows mean
percent HR increase across different levels of immersion. Natural logarithmic transformation was
applied to the mean percent HR increase data for statistical analysis since they did not meet
normality assumptions initially. A two-way ANOVA revealed that there was no main effect of
vividness (F (2, 142) = 0.4213, p > 0.05) nor extensiveness (F (1, 142) = 0.3644, p > 0.05). There
was no statistically significant interaction effect between vividness and extensiveness (F (2, 142)
Figure 5.5: Mean percent HR increase across different levels of vividness and extensiveness (+/- 1
SE)
5.6 Correlation analysis
Previous studies have looked into correlations between subjective presence response and
examined objective measures (Slater, Usoh, & Steed, 1995; Usoh et al., 1999). Despite the
statistical insignificance in terms of main effect of mean percent HR increase, Spearman’s rho
correlation analysis revealed a statistically significant positive correlation between mean percent