Abstract
Shaw, Franklin Daniel (Danny). Decision-Makers’ Perception of Quality
Indicators for the Total County Extension Program. (under the direction of Dr. R.
David Mustian). The purpose of the study was to examine the relationship between
decision-makers’ perception of quality indicators and the socio-demographic factors,
organizational factors and spatial factors. Fourteen randomly selected counties
participated in the study. Local Extension decision-makers (county funding partners,
Extension staff, and advisory members) were targeted in each county along with
Extension administrators. Five hundred thirteen (513) survey instruments were
distributed with two hundred fifty nine usable instruments returned (259) for a
response rate of 50%.
Three focus groups were used to validate and select quality indicators for the
Total County Extension Program. The independent variables were
socio-demographic factors (age, gender, ethnic background, and educational level),
organizational factors (relational and primary role, length of association, intensity of
interaction) and spatial factors (accessibility, size of staff, resident status).
The research found that decision-makers’ perception of quality indicators
varied by organizational, spatial and socio-demographic factors. Organizational
factors such as role (relational, primary) of the decision-maker had an influence on
perception of quality. Intensity of interaction and accessibility (spatial) also has an
influence of the decision-makers’ perception of quality. Extension administrators
county partners, advisory members and local Extension staff. Other
socio-demographic factors such as age, gender, ethnicity had little influence on quality
indicators. Decision-makers’ educational level had significant influence on quality
indicators. Spatial factors of resident status and size of Extension staff had marginal
Decision-Makers’ Perception of Quality Indicators for the Total County
Extension Program
By
F. Daniel Shaw
A dissertation submitted to the Graduate Faculty of
North Carolina State University
In partial fulfillment of the
Requirements for the Degree of
Doctorate of Education
AGRICULTURAL AND EXTENSION EDUCATION
Raleigh
2005
APPROVED BY:
Richard T. Liles
James L. Flowers
Biography
Franklin Daniel (Danny) Shaw was born in Kinston, North Carolina on
September 19, 1953. He was raised on a small family farm in Onslow County near
the town of Richlands, North Carolina. Danny graduated from Richlands High School
in 1971 and entered North Carolina State University in the fall of the same year. He
graduated in 1974 with a Bachelor of Science degree in Agriculture Education with a
specialty in animal science.
In July of 1975 he began his professional career as the coordinator of the
vocational handicap program for the Onslow County Board of Education. The
following year he was employed as the vocational agriculture teacher at Jacksonville
Senior High School. In November of 1979 he accepted the Extension agent position
with the North Carolina Agriculture Extension Service at the Onslow Center. Shaw
received his master degree in crop science from North Carolina State University in
1988. In 1989 Shaw was appointed as County Extension Director in Onslow. Shaw
accepted the interim Southeast District Extension Director role in 1996 where he
remained for a year and a half before returning to Onslow County. In 2001 Shaw
was selected to serve as South Central District Extension Director.
Danny is the son of Starkey Shaw and Arlene Barbee. Danny has one brother
Jerome, and one sister, Melanie. Danny is married to Mary Jarman Shaw. They
Acknowledgements
The completion of this dissertation became a reality by the generous efforts of
many individuals. My sincere appreciation and gratitude to Dr. David Mustian,
chairman of my graduate committee, for his continued support and understanding
throughout this process. Dr. Mustian provided invaluable guidance, insight and
wisdom, while encouraging me to strive for excellence. I am grateful for the support
from, Dr. Jim Flowers, Dr. Greg Jennings, and Dr. Richard Liles, who as
encouraging members of my graduate committee, gave of their valuable time to
assist me in direction of this research.
Thanks to Dr. Jon Ort and Dr. Joe Zublena for their belief in the importance of
this research and their support in the project’s completion. Thanks to the many
decision-makers both internal and external from across North Carolina for their
commitment and support for the mission of Cooperative Extension. Their willingness
to assist in the dissemination of the survey and/or the thoughtful completion of the
survey instrument provided the raw information needed for this research.
Special wholehearted thanks to Susan Brame and Tracy Brown. Their professional
proofing and editing was invaluable to the completion of this document. Susan also
provided valuable insight in the final design of the document. Susan’s unselfish
attitude and willingness to help was instrumental in the attention to details that often
escaped the author.
Without the support and encouragement of my family, this research would not
an early age and gave me the confidence to follow my dreams. Dad, I’m sorry that
you did not get to see this dream fulfilled. My loving and faithful wife, Mary patiently
assisted in providing technical computer expertise and guidance in proper use of the
English language. Mary has unselfishly sacrificed many evenings and weekends
and provided unconditional moral support.
TABLE OF CONTENTS
Page
LIST OF TABLES...viii
LIST OF FIGURES ... xv
CHAPTER I... 1
Introduction ... 1
The Cooperative Extension Mission ... 4
The Cooperative Partnerships ... 5
Accountability, a Sense of Urgency ... 6
Need for the Study... 8
Quality Extension Programs Indicators... 10
Program Evaluation ... 12
Statement of the Problem ... 16
Major Decision-Makers ... 19
Advisory Leadership Volunteers ... 19
Cooperative Extension Administration ... 20
County Funding Partners ... 21
County Extension Staff ... 21
Definition of Terms... 22
Assumptions ... 25
Limitations... 25
Chapter Summary... 26
CHAPTER II... 27
Conceptual Schema and Review of the Literature... 27
Conceptual Framework... 27
Quality in Adult Education... 33
Quality in Cooperative Extension Programming Models ... 39
Needs Assessment... 42
Program Design and Implementation ... 44
Program Evaluation and Accountability ... 46
Perception... 49
Quality ... 50
Total Quality Management... 52
The Baldrige National Quality Program ... 54
Quality Program Impacts ... 57
Related Studies ... 58
Ellen Taylor-Powell, Mohammad Douglah and Key Stanek Study... 59
TABLE OF CONTENTS (CONTINUED)
Page
Linda M. Baldwin Study ... 65
Jimmy Lynn Shonkwiller Study ... 67
Belinda Maria Wallace Carberry Study ... 70
Karen Kauffman Pettit Study... 72
Carmen Leon Guerrero Pearson Study ... 73
Fletcher Barber, Jr. Study ... 74
Indicators of a quality program... 75
Community-based... 76
Customer-focused ... 77
Professional, Creditable Staff ... 78
Team Approach ... 80
The Quality Process ... 81
Accountable to Publics ... 82
CHAPTER III... 85
Methodology ... 85
Research Design ... 86
Population and Sample... 87
Instrumentation ... 88
Data Collection ... 89
Data Analysis... 89
Chapter Summary... 90
CHAPTER IV ... 92
Results... 92
Profile of Respondents ... 92
Respondents’ Relationship to Cooperative Extension ... 102
Role of Respondents ... 109
Respondents by Gender ... 121
Race/Ethnicity... 127
Education... 133
Age of Respondents ... 140
Resident Status ... 147
Size of Local Extension Staff ... 153
Level of Interaction (intensity) ... 160
Accessibility to the Extension Center... 166
Length of Association ... 173
TABLE OF CONTENTS (CONTINUED)
Page
CHAPTER V ... 184
Summary, Conclusions, Implications and Recommendations ... 184
Conclusions ... 185
Implications... 200
Recommendations for Future Research ... 202
Recommendations for Cooperative Extension... 203
REFERENCES ... 205
APPENDICES... 212
Appendix A. Survey Letter ... 213
Appendix B. Survey Instrument ... 214
List of Tables
Page
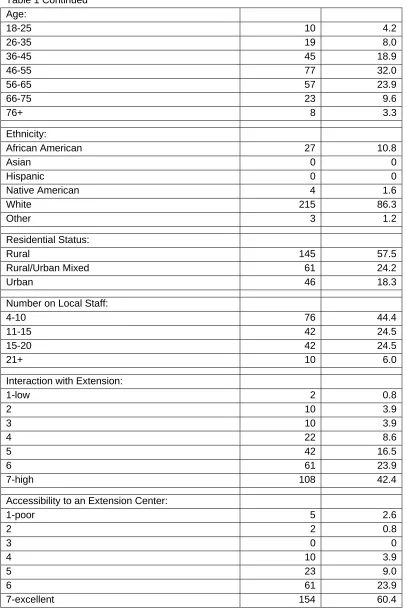
Table 1 Profile of Respondents ... 93
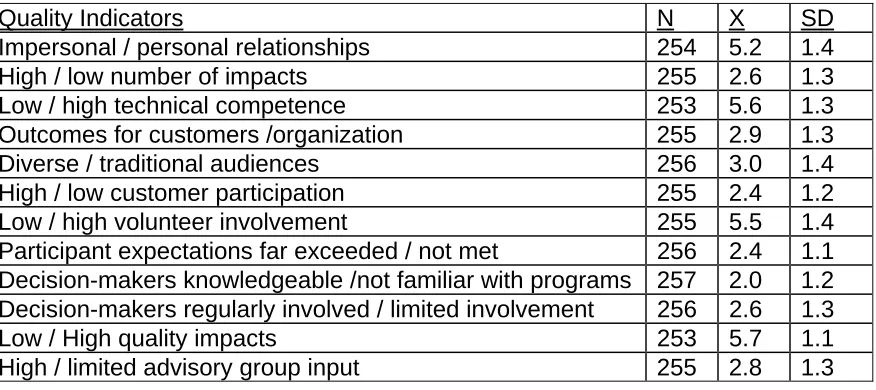
Table 2 Respondents’ perception of quality indicators for a Total
County Extension Program ... 97
Table 3 Respondents’ perception of quality indicators to ensure
customer-focus ... 97
Table 4 Respondents’ perception of quality indicators for the local staff ... 98
Table 5 Respondents’ perception of quality indicators for a
viable educational process ... 99
Table 6 Respondents’ perception of quality indicators in fulfilling
the mission... 100
Table 7 Respondents’ perception of the three most important
characteristics of a quality Total County Extension Program ... 100
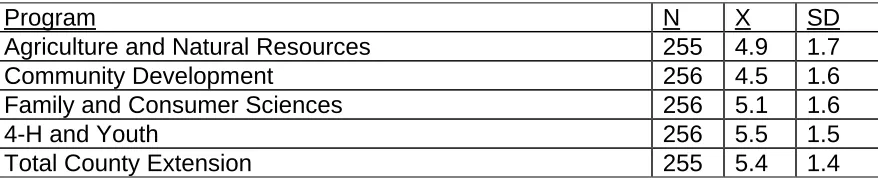
Table 8 Respondents’ level of awareness (Low=1 to High=7) for
Extension programs... 101
Table 9 Respondents’ perception of quality (Poor=1 to Excellent=7)
for Extension programs... 101
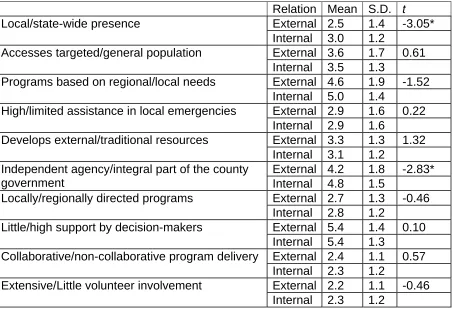
Table 10 Mean differences in Total County Extension Program indicators
by respondents’ relationship (External/Internal)... 103
Table 11 Mean differences in the customer-focused indicators by
respondents’ relationship (External/Internal) ... 104
Table 12 Mean differences in the staff indicators by respondents’
relationship (External/Internal) ... 105
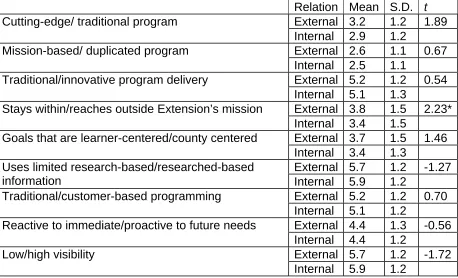
Table 13 Mean differences in educational process indicators by
respondents’ relationship (External/Internal) ... 106
Table 14 Mean differences in mission-based indicators by
respondents’ relationship (External/Internal) ... 107
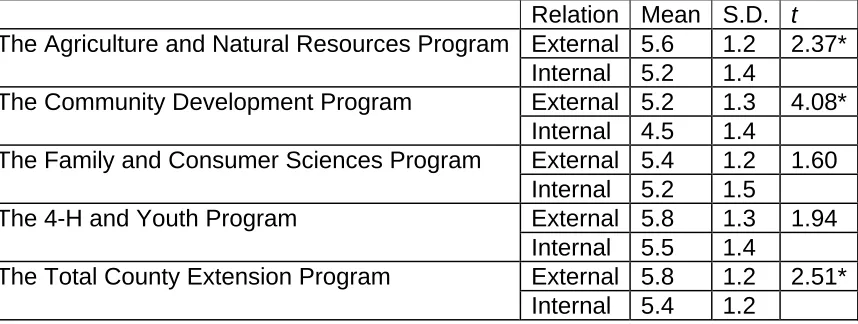
Table 15 Mean differences in program awareness by respondents’
List of Tables (Continued)
Page
Table 16 Mean differences in perception of program quality by
respondents’ relationship (External/Internal) ... 108
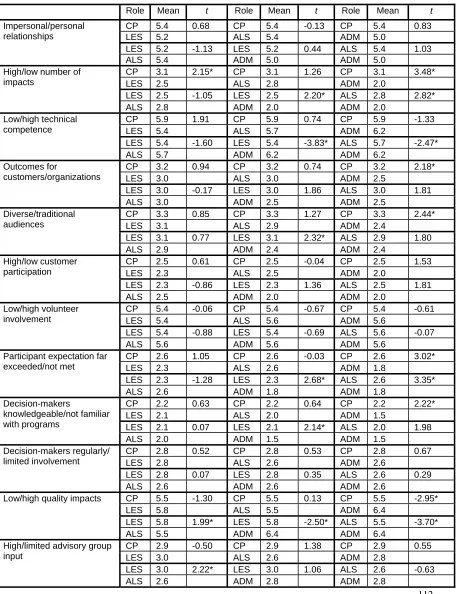
Table 17 Mean differences in Total County Extension Program indicators by respondents’ role (County Partner/Local Extension Staff/Advisory Leadership System/Extension
Administration)... 110
Table 18 Mean differences in the customer-focused indicators by respondents’ role (County Partner/Local
Extension Staff/Advisory Leadership System/Extension
Administration)... 112
Table 19 Mean differences in the staff indicators by respondents’ primary role (County Partner/Local
Extension Staff/Advisory Leadership System/Extension
Administration) ... 114
Table 20 Mean differences in educational process indicators by respondents’ primary role (County Partner/Local
Extension Staff/Advisory Leadership System/Extension
Administration)... 116
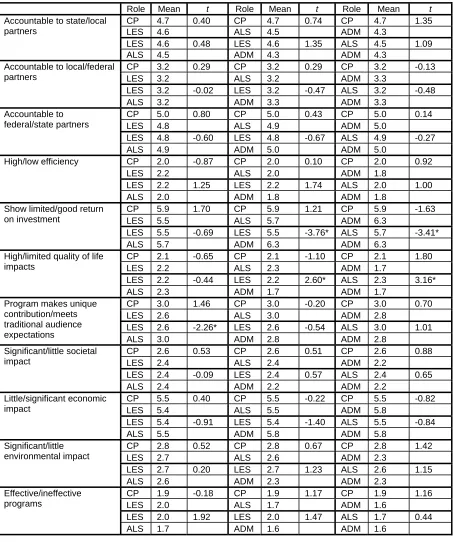
Table 21 Mean differences in mission-based indicators by respondents’ primary role (County Partner/Local
Extension Staff/Advisory Leadership System/Extension
Administration)... 118
Table 22 Mean differences in program awareness by respondents’ primary role (County Partner/Local Extension Staff/Advisory
Leadership System/Extension Administration)... 119
Table 23 Mean differences in perception of program quality by respondents’ primary role (County Partner/Local
Extension Staff/Advisory Leadership System/Extension
Administration)... 120
Table 24 Mean differences in educational process indicators by
List of Tables (Continued)
Page
Table 25 Mean differences in customer-focused indicators by
respondents’ gender (Female/Male) ... 122
Table 26 Mean differences in the staff indicators by respondents’ gender
(Female/Male)... 123
Table 27 Mean differences of quality indicators concerning a viable educational process for a Total County Extension Program
by gender (Female/Male)... 124
Table 28 Mean differences in mission-based indicators by respondents’
gender (Female/Male) ... 125
Table 29 Mean differences in program awareness by respondents’
gender (Female/Male) ... 126
Table 30 Mean differences in perception of program quality by
respondents’ gender (Female/Male) ... 126
Table 31 Mean differences in Total County Extension Program
indicators by respondents’ race (Non-white/White)... 127
Table 32 Mean differences in the customer-focused indicators by
respondents’ race (Non-white/White)... 128
Table 33 Mean differences in the staff indicators by respondents’
race (Non-white/White) ... 129
Table 34 Mean differences in educational process indicators by
respondents’ race (Non-white/White)... 130
Table 35 Mean differences in mission-based indicators by
respondents’ race (Non-white/White)... 131
Table 36 Mean differences in program awareness by
respondents’ race (Non-white/White)... 132
Table 37 Mean differences in perception of program quality by
List of Tables (Continued)
Page
Table 38 Mean differences in Total County Extension Program indicators by respondents’ education level (College
Graduate or less/Graduate Degree) ... 133
Table 39 Mean differences in the customer-focused indicators by respondents’ education level (College Graduate or less/
Graduate Degree)... 135
Table 40 Mean differences in the staff indicators by respondents’
education level (College Graduate or less/Graduate Degree) ... 136
Table 41 Mean differences in educational process indicators by respondents’ education level (College Graduate or less/
Graduate Degree)... 137
Table 42 Mean differences in mission-based indicators by respondents’
education level (College Graduate or less/Graduate Degree) ... 138
Table 43 Mean differences in program awareness by respondents’
education level (College Graduate or less/Graduate Degree) ... 139
Table 44 Mean differences in perception of program quality by respondents’ education level (College Graduate or less/
Graduate Degree)... 139
Table 45 Mean differences in Total County Extension Program
indicators by respondents’ age (less than fifty/fifty or greater) ... 141
Table 46 Mean differences in the customer-focused indicators by
respondents’ age (less than fifty/fifty or greater) ... 142
Table 47 Mean differences in the staff indicators by respondents’
age (less than fifty/fifty or greater) ... 143
Table 48 Mean differences in educational process indicators by
respondents’ age (less than fifty/fifty or greater) ... 144
Table 49 Mean differences in mission-based indicators by respondents’
age (less than fifty/fifty or greater) ... 145
Table 50 Mean differences in program awareness by respondents’
List of Tables (Continued)
Page
Table 51 Mean differences in perception of program quality by
respondents’ age (less than fifty/fifty or greater) ... 146
Table 52 Mean differences in Total County Extension Program indicators
by respondents’ resident status (Rural/Urban mixed) ... 147
Table 53 Mean differences in the customer-focused indicators by
respondents’ resident status (Rural/Urban mixed)... 148
Table 54 Mean differences in the staff indicators by respondents’
resident status (Rural/Urban mixed) ... 149
Table 55 Mean differences in educational process indicators by
respondents’ resident status (Rural/Urban mixed)... 150
Table 56 Mean differences in mission-based indicators by respondents’
resident status (Rural/Urban mixed) ... 151
Table 57 Mean differences in program awareness by respondents’
resident status (Rural/Urban mixed) ... 152
Table 58 Mean differences in perception of program quality by
respondents’ resident status (Rural/Urban mixed)... 152
Table 59 Mean differences in Total County Extension Program
indicators by respondents’ staff size (less than ten/ten or greater) .... 153
Table 60 Mean differences in the customer-focused indicators by
respondents’ staff size (less than ten/ten or greater) ... 154
Table 61 Mean differences in the staff indicators by respondents’
staff size (less than ten/ten or greater) ... 155
Table 62 Mean differences in educational process indicators by
respondents’ staff size (less than ten/ten or greater) ... 156
Table 63 Mean differences in mission-based indicators by respondents’
staff size (less than ten/ten or greater) ... 157
Table 64 Mean differences in program awareness by respondents’
List of Tables (Continued)
Page
Table 65 Mean differences in perception of program quality indicators by
respondents’ staff size (less than ten/ten or greater) ... 159
Table 66 Mean differences in Total County Extension Program
indicators by respondents’ level of interaction (Low/High) ... 160
Table 67 Mean differences in the customer-focused indicators by
respondents’ level of interaction (Low/High) ... 161
Table 68 Mean differences in the staff indicators by respondents’ level of
interaction (Low/High) ... 162
Table 69 Mean differences in educational process indicators by
respondents’ level of interaction (Low/High) ... 163
Table 70 Mean differences in mission-based indicators by respondents’
level of interaction (Low/High)... 164
Table 71 Mean differences in program awareness by respondents’ level
of interaction (Low/High) ... 165
Table 72 Mean differences in perception of program quality indicators by
respondents’ level of interaction (Low/High) ... 166
Table 73 Mean differences in Total County Extension Program indicators by respondents’ degree of accessibility to the local Extension
Center (Low/High)... 167
Table 74 Mean differences in the customer-focused indicators by respondents’ degree of accessibility to the local Extension
Center (Low/High)... 168
Table 75 Mean differences in the staff indicators by respondents’ degree of accessibility to the local Extension Center (Low/High)... 169
Table 76 Mean differences in educational process indicators by respondents’ degree of accessibility to the local Extension
Center (Low/High)... 170
Table 77 Mean differences in mission-based indicators by respondents’
List of Tables (Continued)
Page
Table 78 Mean differences in program awareness by respondents’ degree
of accessibility to the local Extension Center (Low/High)... 172
Table 79 Mean differences in perception of program quality by respondents’ degree of accessibility to the local Extension
Center (Low/High)... 173
Table 80 Mean differences in Total County Extension Program indicators
by respondents’ years of association (Low/High)... 174
Table 81 Mean differences in the customer-focused indicators by
respondents’ years of association (Low/High) ... 175
Table 82 Mean differences in the staff indicators by respondents’ years of
association (Low/High) ... 176
Table 83 Mean differences in educational process indicators by
respondents’ years of association (Low/High) ... 177
Table 84 Mean differences in mission-based indicators by respondents’
years of association (Low/High)... 178
Table 85 Mean differences in program awareness by respondents’ years of association (Low/High) ... 179
Table 86 Mean differences in perception of program quality by
respondents’ years of association (Low/High) ... 179
Table 87 Ranked characteristics of a Total County Extension Program
List of Figures
Page
Figure 1 Conceptual Schema: Factors associated with Cooperative Extension’s Decision-makers in determining indicators for
CHAPTER I
INTRODUCTION
Cooperative “Extension …….is recognized throughout the world as the most
effective informal adult education effort in history” (Patton, 1985, p. 4). Cooperative
Extension in America is the largest interactive and problem-solving educational
organization in the world (Blackburn, 1984). Cooperative Extension’s purpose has
deep roots in the American educational philosophy to provide practical education
available for the masses (North Carolina Cooperative Extension Service, 1998). The
evolution of the entire land grant complex with the segments of teaching, research,
and extension was built upon this premise (Hightower, 1970). The first and second
Morrill Act established land grant institutions from federally appropriated funds to
states in 1862 and 1890 respectively. Cooperative Extension’s origin was well
conceived long before that time by a genuine thirst for knowledge by rural America.
Early efforts to gain and disseminate knowledge through experimental farms, model
farms, agriculture societies, traveling agricultural trains, and others set the stage for
Cooperative Extension. The conceptual framework took on a uniquely effective
shape and became the premiere non-formal education institution for the masses
(Seevars, Graham, Gamon and Condlin, 1997).
The purpose of the land grant institutions was to provide education for the
working class in technical education (Reagan, 1987). The second component of the
The Hatch Act of 1887 provided federal funds to each state intended to
promote agricultural research and provide a knowledge base for students (NCCES,
1998). After that time, many research stations provided an educational component
in an effort to share research findings with innovators and early adopters. This
educational plan met with some early successes but was not effective in obtaining
far-reaching impact through society. An early sentiment by discontented farmers
was “We don’t want science floating in the skies; we want to bring it down and hook
it to our plows” (Seevers, Graham, Gamon, Conklin, 1997, p. 21). These farmers
were among the first to identify factors that were inherent for quality Extension
programs to exist and become effective. Many informal educational models were
tested to fulfill the true mission of the land grant system. Among those pioneering
leaders were Seaman Knapp and James Wilson. Wilson and Knapp believed that
research and knowledge should be delivered to every farm and every home. Knapp
saw first hand the value of positioning non-formal educational programs in individual
communities. Knapp’s vision for a highly effective quality educational program was
centered on taking the university researched-based knowledge to the people.
Knapp and Wilson further believed that through educating the rural masses, the
nation was best served. Their vision was the foundational component of the
Agricultural Extension Service, which was fundamental to the democratic stability of
this nation (Seevers et al, 1997).
Many factors played an important role in the development of the Extension
philosophy. “University extension” actually began in England in the form of off
libraries. Western civilization held an intrinsic belief that education should be
available to the masses. The majority of rural society was poor and far removed
from university research and knowledge. Cooperative Extension was born to take
university resources to where the people lived, positively engaging educational
programs to improve the quality of life for the entire nation.
Within this conceptual and philosophical framework, the passage of the
1914 Smith-Lever Act formally established the third leg and final component of the
land grant framework (Schaub, 1953). This provided federal funds to support
non-formal education led by local farm and home demonstration agents (Reagan, 1987).
The Smith-Lever Act was designed to eliminate much of the pre-existing duplicated
and unorganized extension work. Since agriculture was the primary thrust of early
American culture and the nation’s future, much of the early legislation centered on
technology-transfer in a rural setting.
Many other federal legislative actions have been directed toward funding and
specific program guidelines for Cooperative Extension since 1914. “The Smith–
Lever Act extended the benefits of federal aid to those colleges established under
the acts of 1862 and 1890. Its purpose was “to: ….inaugurate, in connection with
these colleges, Agriculture Extension work which shall be carried on in cooperation
with the United States Department of Agriculture… in order to aid in diffusing among
the people of the United States useful and practical information on subjects related
to Agriculture and Home Economics, and to encourage the application of the same”,
(Schaub, 1953, p. 36). One of the later federal legislative actions added the words,
economics and subjects related hereto” (Seevars et al., 1997, p. 36) which
authorized Extension activities in other non-traditional program areas. This small
change in wording was significant in Extension’s future and provided the flexibility
needed to move into a community based, problem-solving programming model.
The Cooperative Extension Mission
The Cooperative Extension mission was based on founding legislation. The
Cooperative Extension mission has evolved over the ninety years since the inception
of the Smith-Lever legislation. Societal factors forced Cooperative Extension to
adjust to serve a broader based programming focus and audience. The North
Carolina Cooperative Extension mission was to help put knowledge to work so
people could improve their lives (NCCES, 1998).
The land grant complex of teaching, research, and extension provides the
framework for this knowledge to be developed, tested, applied and delivered to the
masses. Early successes by agents in agriculture and home demonstration work
lead to the widespread adoption of this concept. The rapid development of
Extension as a non-formal education system provided strong support for
Cooperative Extension’s mission. Cooperative Extension continues to be a vehicle
for human development through non-formal, off campus education. This mission
has remained constant and unshaken even under scrutiny of frequent studies and
critiques (Seevers et al., 1997).
Though the Cooperative Extension mission has remained relatively constant
complex. The Cooperative Extension System is a large and complex organization
(Hightower, 1973). Hightower questioned in his book, Hard Tomatoes, Hard Times,
if Cooperative Extension, due to this complexity was remaining true to its mission
and original purpose. Periodic national and state reviews and studies of the
Extension System have suggested and often mandated Cooperative Extension’s
continued adaptation to current issues (Kellogg, 2001). Several studies have found
that legislators and the general public lack a clear understanding of Extension’s
mission (Adkins, 1981) and funding (Blalock, 1964). The understanding and support
of Cooperative Extension’s mission by decision-makers at each level of the funding
partnership has always been critical.
The Cooperative Partnerships
The word “Cooperative” in Cooperative Extension purports the unprecedented
partnership that existed in the establishment of this organization (NCCES, 1998).
Federal funding administered through the United States Department of Agriculture
was appropriated to the Land Grant Institutions for Extension work. These federal
funds were administered as formula funds for certain expenses. Funds contributed
would vary and were predetermined for each funding level. Thus the percentage of
funds for each level of the partnership (federal, state, county) was not
predetermined. State funds were also legislatively appropriated to the land grant
institutions for use in Extension education. These funds were subsequently joined
with county funds to provide a local Extension presence (Davis, 1998). A national
Offices was 47.5% state funds, 30.4% federal funds, 17.4% county funds and 4.7%
non-tax funds (Seevers et al., 1997). Generally non-tax funds were predominately
grant funds. Cooperative Extension’s use of these grant funds have increased
significantly as governmental budgets continued to shrink (Payne, 2004).
Cooperative Extension’s unique three-way partnership between federal, state,
and county government provided a non-formal education system to deliver
research-based programs focused on local needs. Extension’s tri-level partnership
determined program direction through funding accountability (Davis, 1998). The
concept of local non-formal educational programs promoted the idea that each
county Extension program was developed independently to address specific needs
within the local population. To this end, the cooperative partnerships must remain
flexible (Sykes, 1995) and the cooperative partnerships must match and align the
combined resources with the expressed needs (Boone, 1995). I. O. Schaub stated
“if the results (of Extension work) did not meet with the general approval on the part
of the public, it would soon reflect itself in the withdrawal of county financial support”
(Schaub, 1953, p. 39). “General approval on the part of the public” pointed out the
ever-increasing accountability demands from Cooperative Extension’s partners to
assure deliverance of quality Extension programs that make a difference locally.
Accountability, a Sense of Urgency
“The process of forming partnerships requires each partner to come to the
table with resources and frank discussion of outcomes and clearly recognized
and 60s, non-defensible funds such as those that built Cooperative Extension were
easily obtained. Cooperative Extension did very little to assess needs, plan
programs, expand clientele, and evaluate programs. Dynamic demographic and
cultural shifts required Cooperative Extension to transform along with society.
Today, Cooperative Extension faces escalating pressure from funding all partners to
enhance productivity, increase efficiency, expand clientele base, and eliminate
duplication (Bolt, 1988).
Funding partners within the Cooperative Extension System are
accountable to their publics for the resources expended in non-formal education
programs (Boone et al., 1970). With the increased emphasis on cost-benefit ratios,
the demand for high impact programs and continuous budgetary restraints;
Cooperative Extension struggles with effective ways to keep all partners informed on
significant program impacts. County Extension Programs are accountable to all
funding partners simultaneously. These partners often require different indicators of
quality programming (Taylor-Powell, Douglah, and Stanek, 1995). Effectively
communicating results and impacts to all levels of funding can be a challenge (Nall,
2000). Accountability becomes more complex when grant funds are also added to
support programming efforts. There are often differing expectations among funding
levels/partners when considering grant audits. For example, accountability for grant
programs is usually targeted toward specific achievement and progress toward
specific goals (Stevens, 1994). These differences in accountability caused by
budget constraints, downsizing, and changing demographics have forced
community-programming model (Seevers et al., 1997). Seaman Knapp recognized early in his
development of the Extension model that the regional approach was not effective.
He concluded that to have an effective (quality) Extension program “requires at least
an agent in every county” (Schaub, 1953, p.17).
Need for the Study
Total County Extension Programs are designed, implemented, and evaluated
within each county by county agents (Davis, 1998). Extension specialists provide
program support, agent training and technical expertise for the county agents. The
County Extension Director is responsible for the leadership, direction, and
supervision for each agent and the coordinated work of the local support staff. The
success of a total county Extension program is based on a multidisciplinary team
approach to solve local problems (Merriam, 1989).
County Extension Directors are accountable to all funding partners for
resources expended in delivering a high impact, quality Extension program. In
recent years, as funding has diminished or shifted, county Extension programs have
secured outside funding sources (grants, private funds, and fees for service),
(Payne, 2004). Thus, these new funding sources have become a larger player in
Extension programming, amounting to 16% of the total budget for North Carolina
Cooperative Extension Services (NCCES) in 2003. To date, and in the context of
compounded budget crises with local partners, the North Carolina Cooperative
Extension Service has maintained a local presence in each county. Under the
county for non-mandated programs will be attributed to the quality of local Extension
programs, the continued strong partnership with county government and recent
success in securing outside resources (NCCES, 1998).
Moreover, North Carolina’s local Extension staff size varies from two (2) to
twenty-three (23) employees depending on the county needs (NCCES, 1998). This
variance is based upon county support, local needs, farm diversification, farm
income, population and other factors (NCCES, 1993). Extension employees’ salary
sources vary depending on the funding partner’s involvement in that particular
program. Subsequently, County Extension Directors are charged to develop a staff
equipped to meet local needs and provide the local staff with administrative and
programming leadership. County Extension Directors also are responsible for
securing adequate resources based on these numerous mandates and expectations
from funding partners. Thus, every county Extension staff and total Extension
educational program is unique (Merriam, 1989). Decision-makers’ performance
expectations for Extension faculty are directly linked to the quality of programs
delivered. National, state, and county decision-makers need quantifiable program
impact data (Fetsch, 1997). These impact indicators are not the same for all funding
levels (Stevens, 1994). Mallilo and Millar (1992) reported that Extension
administration expectations were different from clientele expectations. Bennett
(1996) reported inconsistency across stakeholders and called for uniform program
performance indicators for reporting quality-controlled data. The constraints of
programming for national initiatives while meeting local needs without doubt affect
staff and specifically the County Extension Director are accountable for the quality of
the programs produced and impacts reported for all decision-makers at all levels
(Bennett, 1996). This study explored the relationships between decision-makers’
perception of quality indicators for Cooperative Extension programs. Many of these
characteristics or indicators were documented in the literature. Additional
descriptive research of the perceptions of decision-makers about quality indicators
was warranted.
Quality Extension Program Indicators
What constitutes a quality Extension program? Patton (1985) stated that
quality programs of the future would have the same characteristics as those of the
past. These Extension programs would be people-oriented, knowledge-based,
problem-oriented, and cost-effective. Patton added that quality programs came from
quality people. Considerable peer reviewed literature described these components
of successful non-formal Cooperative Extension education programs (Mustian,
1998). Mustian described successful Extension Program indicators as:
• Community-based.
• Customer focused.
• Delivered by professional creditable staff.
• Exhibiting a quality programming process.
• Promoting a team approach.
• Relevant and timely.
The elements of a quality program found in much of the literature are focused
on the individual program conducted by each Extension agent and not the Total
County Extension program. The literature does not adequately address the
likelihood that the individual program quality indicators and characteristics are either
cumulative or directly correlated to the composite of all county Extension program
activities and programming efforts for a particular unit. Bennett (1993) stated that
traditional research-transfer models do not adequately capture the roles,
expectations, and environment that Cooperative Extension currently operates.
Extension goes beyond the role of transferring information to helping clients make
informed decisions applicable to their situation. Bennett suggested that the
traditional models, while still part of the story, do not capture the modern, more
complex Cooperative Extension programming model. Even adult education models
do not describe all of the components and functions needed by Extension
professionals to be successful and deliver the level of quality expected and often
required by stakeholders. Bennett (1993) claimed that interdependent models could
help build a better understanding of Cooperative Extension’s processes and roles
and ultimately build stronger support for Extension with the differing expectation
levels of stakeholders groups.
The Total County Extension Program, as defined by the author, is a
composite of individual coordinated efforts from the local staff, Extension specialists,
various stakeholders, and volunteers. In North Carolina, the County Extension
Director represents the cohesive force providing oversight and leadership to
programming responsibilities, available resources, and the coordinated efforts of a
diverse professional staff to meet the various stakeholders’ needs and expectations.
The County Extension Director assures that these decision-makers are engaged in
the entire programming process either in an advisory role or as active participants
and play an active role in determining quality program indicators and impacts. The
ability to determine the utility of Extension was often based on summative evaluation
of the Total County Extension program during the traditional county program
reviews.
Program Evaluation
Adult education programming models from the earliest conception had a
major evaluative component. The “basics” as described by Tyler (1949) provide a
sequential framework for designing an educational model that places emphasis on
evaluation being continuous and applied to both for the individual’s assessment and
the program’s assessment. Evaluation, from Malcolm Knowles (1975) perspective,
was humanistic and should never be quantitative in nature. Complex economic,
political, and social factors affect development activities and evaluations
(International Program for Development Evaluation Training [IPDET], 2002).
Boone’s programming model relied on the educator to facilitate formative evaluation
throughout the programming process (Boone, Dolan and Shearon, 1975). A key
component of Boone’s model was the involvement of stakeholders, leaders, and
decision-makers early and continuously in the programming process. This early
and client. Furthermore, early engagement directly corresponded the clientele’s
ability to understand and support the organizational mission. Early clientele
involvement also provided the client with opportunities for input, evaluative feedback,
and positive advocacy with local decision-makers. When multiple stakeholders are
involved in program evaluations, more time must be invested in meaningful, clear,
abundant communication (IPDET, 2002). Participatory program evaluations add to
the complexity simply due to the number of people involved and the time
commitment by the educator/evaluator. Historically, North Carolina Cooperative
Extension Service had conduced participatory county program reviews to evaluate
the total county program, which included two types of reviews. The comprehensive
program review allowed for the review team to interact and gain insight from the
stakeholders over several days and was more thorough, while the regular program
reviews were limited to one day with little stakeholder involvement. Program reviews
specifically searched for quality indicators in the Total County Extension Program.
Recent efforts to conduct county program reviews had not been successful.
North Carolina’s last attempt to organize county Extension program reviews in the
year 2000 was initiated under the title of “Program Quality Enhancement”. This
effort met with overwhelming budgetary constraints and never got off the ground.
One of the fundamental goals of the County Program review was to “enhance the
quality of County Extension programs” (NCCES, 1988). In reference to the Quality
Enhancement Process, Dr. Jon Ort, Associate Dean and Director, North Carolina
Cooperative Extension Service (2000) identified the Program Quality Indicators that
The Program Quality Indicators listed by Dr. Ort were:
1. Mission/ Vision
• Program is consistent with the mission, philosophy, values, and capacity of North
Carolina Cooperative Extension. Programs are research-based.
2. Program Process A. Program Planning
• Program focuses on specifically identified needs for target audience in
county/state.
• Program effectively involves the advisory leadership system.
• Program addresses the county plan of work and the county unit’s strategic plan.
• People involvement in developing, delivering, and evaluating programs.
• Programs target and reach diverse audiences (both new and traditional) in ways
that are appropriate to the audiences
B. Program Design
• People involvement in developing, delivering, and evaluating programs.
• Programs are flexibly adapted and practical to audiences and situations
• Programs are available and accessible throughout county indicating balance in
service delivery.
• Collaboration with external agencies and community groups in the county/state.
• Programs target and reach diverse audiences (both new and traditional) in ways
C. Program Implementation
• Programs are timely and responsive to current needs.
• People involvement in developing, delivering, and evaluating programs.
• Programs target and reach diverse audiences (both new and traditional) in ways
that are appropriate to the audiences.
• Programs are available and accessible throughout county indicating balance in
service delivery.
• Programs use appropriate and innovative delivery methods related to audience
learning style by utilizing a variety of teaching strategies.
D. Program Process and Product Evaluation and Feedback
• Program has measurable objectives and impacts and incorporates evaluation.
• People involvement in developing, delivering, and evaluating programs.
• Accountable for program impacts, staff, and resources, and an acceptable use of
resources.
• Extension professionals have reputation for quality programs and are sought
after for expertise and collaboration.
3. Program Resource Development
• Accountable for program impacts, staff, and resources, and an acceptable use of
resources.
• Programs use appropriate university/county/area interdisciplinary team efforts.
• Available, appropriate, and sufficient resources are obtained to support program.
• Volunteer leadership is highly developed and effective in teaching, program
4. Program Marketing/Reporting
• Programs are timely and responsive to current needs.
• Program is visible and identifiable – marketed and marketable for its outstanding
feature, program impact, staff, and resource utilization.
• Program results are communicated to decision-makers, supporters, general
public, and peers.
5. Diversity
• Programs target and reach diverse audiences (both new and traditional) in ways
that are appropriate to the audiences (Ort, 2000, p. 6-7).
These county program reviews provided an opportunity for decision-maker input
concerning the impact and direction of the Total County Extension Program.
Program evaluators used program reviews to assess the process, client benefit, and
consequence to society. Program performance indicators were both qualitative and
quantitative. From this perspective, quality impact indicators should align with the
program’s objective or goal (Taylor, 2001). Evaluators need a battery of indicators
such as the ones included in the Ort letter to evaluate program quality.
Statement of the Problem
Stakeholders’ expectations for the Total Cooperative Extension Program are
not consistent across funding levels (Taylor-Powell et al., 1995). Multiple
stakeholders eventually have difficulty agreeing on the criteria for evaluation, support
Decision-makers are faced with increasingly tougher budget constraints resulting in
public outcry for continuous accountability at all levels (Bolt, 1988; Patton, 1986).
What specific factors may influence decision-makers’ expectations, measures of
accountability and decision making process for funding continuance?
This study identified and described the indicators of a quality total county
Extension program as perceived by the various decision-maker groups. A
comprehensive review of the literature in Chapter II addressed the major
characteristics of a quality program. The perceived indicators of quality for a Total
County Extension Program were described in their relationship with organizational,
socio-demographic, and spatial factors for decision-makers.
Organizational related factors such as the decision-makers’ primary role with
Cooperative Extension were examined by this study to determine their relationship
with key quality indicators. Other organizational factors included the
decision-makers’ length and intensity of the association with Cooperative Extension. These
factors were examined to describe their relationship with key indicators of quality
programs. The research findings surrounding these organizational factors were
explored in greater detail in the literature review.
Socio-demographic factors for decision-makers were also identified in this
study to explore their relationship with key indicators of quality. A review of the
literature found that often decision-makers’ differences in age, ethnicity, gender, and
education level might influence their perception of quality programs. This study
found significant research to warrant further study of these variables as they relate to
Spatial factors as related to the decision-makers were also part of this study.
Independent variables such as size of the Extension staff, accessibility to Extension
office, urban setting compared to rural setting, were explored for possible
relationship to the dependent variable of quality indicators by decision-makers.
The author’s research attempted to describe possible independent variables
that needed further study for linkages to indicators of quality Extension programs.
Each group of decision-makers as defined in this study, play a critical role in shaping
the future of Cooperative Extension. Decision-makers determine program direction,
scope, focus, staffing patterns and funding. The uniqueness of Cooperative
Extension’s funding partnership calls for innovative accountability to all partners
(NCCES, 1998).
The research questions included in the study were:
1. To what extent do decision-makers’ perceived indicators for a Quality Total
County Extension program vary by the socio-demographic factors of age,
gender, ethnicity, and educational level?
2. To what extent do decision-makers’ perceived indicators for a Quality Total
County Extension program vary by the organizational factors of role, length
and intensity of association?
3. To what extent do decision-makers’ perceived indicators for a Quality Total
County Extension program vary by spatial factors of size of staff, accessibility
to center and residential setting?
4. To what extent do decision-makers’ awareness and perception of program
Major Decision-Makers
Decision-makers are fundamental to the purpose of Cooperative Extension.
Major decision-makers surveyed in this study included the following groups:
1. Advisory leadership members
2. Cooperative Extension administrators
3. Cooperative Extension field faculty and staff
4. County funding partners (County Commissioners and County Manager).
These decision-makers craft the major framework by which Extension
programs are planned, designed, implemented, funded, evaluated, and held
accountable on the local, state, and federal level. Each group has specific roles and
responsibilities that lead to the development of a quality Extension program. Each
group has specific interests in developing strong relationships, partnerships, and
dependencies on the other groups to facilitate a highly efficient and effective
Extension program. For the purpose of this study, external roles are advisory
leadership members and county funding partners. Internal roles are local Extension
staff and Extension administration. Below is a brief description of each of these
decision maker groups.
Advisory Leadership Volunteers
The North Carolina Extension Advisory Leadership System engaged over
25,000 volunteers (NCCES, 1998) who assisted county agents with identifying and
prioritizing needs in each county. All counties have a county Extension advisory
council, which monitors and supports local programming to meet the identified needs
with various backgrounds and interests. A subset of the advisory council is the
program and specialized committees. These specialized committees often times
focus on specific commodities or program areas. Through the specialized
committees, targeted clients, external collaborators and local leaders assist in
identifying and prioritizing local needs, designing programs and appropriate delivery
methods and evaluating and supporting program efforts. The Advisory Leadership
System plays a vital role in advocacy for continued funding of Extension programs.
Many Advisory Councils conduct an annual Report to the Commissioners to highlight
Extension accomplishments and impacts (Groff, 1997). The Advisory members play
a vital role in telling the story of Cooperative Extension.
Cooperative Extension Administration
Extension administrators, for the purpose of this study, were the extended
administrative council, which included, seven County Extension Directors
representing each district, the District Extension Directors, Director of County
Operations and State Program Leaders, and Director of Cooperative Extension, and
representatives from North Carolina A and T Cooperative Extension Program
(NCA&T). Extension Administration is responsible for setting policy, allocation of
resources and program leadership. Extension administration promotes linkages with
university administration, department Extension leaders, and Extension partners
from the North Carolina A and T University Cooperative Extension Program.
Extension administration was also responsible for maintaining compliance
partnerships with the federal, state, and county. Enhancing funding arrangements,
leading organizational strategic planning, and supporting county operations are
major functions for this team.
County Funding Partners
County funding partners include the County Manager, Assistant County
Manager, and the County Commissioners. The County Manager and in some
cases, the Assistant or Deputy County Manager play an increasingly important role
in the decision making of county government. Often times the County Manager is
authorized by the Board of County Commissioners to act on their behalf. The
County Manager reviews and recommends to the commissioner the annual budget,
which includes Cooperative Extension. The County Commissioners are elected
officials that serve the publics’ interests. County Commissioners are increasingly
accountable for public funds and particularly sponsored non-mandated programs like
Cooperative Extension (Stienbarger, 2005). In North Carolina, county governments
invested in Cooperative Extension programs by providing local offices, infrastructure
needs, supplies, equipment, and a significant percentage of local staff salaries. This
partnership has remained strong in North Carolina by evidence of the continued
voluntary support to maintain a local staff in every North Carolina county and the
Cherokee Reservation (NCCES, 1998).
County Extension Staff
The county Extension staff includes the County Extension Director, county
Extension agents, program assistants, program associates, technicians, and support
staff. Extension staffs are diverse in educational background, experience, training
subjects in agriculture and natural resources, family and consumer sciences, 4-H
and youth, and community development. The support staffs, including secretaries
are the front line and most visible component of an Extension center for that initial
contact with clients (Martin-Milius, 1994). The County Extension Director is
responsible for program leadership, professional development, and personnel
evaluations for the staff. The County Extension Director is also the primary liaison
with the County Commissioners, the County Manager, and the Advisory Council.
Definition of Terms
County Extension Program - a group of planned, sequenced educational activities focused on meeting a predetermined goal. A County Extension Program is
often centered on single disciplinary areas but may be multidisciplinary and is often
under the direction of a county agent. For the purpose of this study, a county program was identified as organized individual county educational efforts in a
non-formal setting within specific local outcomes. Programs at this level are the
responsibility of the county agent (NCCES, 1998). Delivery modes may vary with
the target audience and program discipline. Essential programming components
include planning, design, implementation, marketing, evaluation, and accountability
(Boone, 1985).
County Extension Agent - a professional educator; a change agent that plans, implements and evaluates non-formal educational programs within the
mission and philosophy of Cooperative Extension. County Extension agents are
considered field faculty of North Carolina State University. In many cases, the local
County agent is the heart and soul of the Cooperative Extension Service (Seevers,
Graham, Gamon, Conklin, 1997).
County Extension Director - local administrator of the Total County Extension Program and staff. Responsible for securing needed resources for
operation of the program. The County Director is also responsible for enhancing
local partnerships with county government to strengthen the local partnership. The
CED provides leadership and direction for the staff and evaluates staff performance.
In addition, the County Extension Director in most counties has programming
responsibilities in specific disciplines. The County Director is often times considered
a department head by county government.
District Extension Director - one of seven administrators in the North Carolina Cooperative Extension System that provide administrative and program
leadership. District Directors support to County Extension Directors and the county
Extension agents across the state. Each DED is responsible for a district with 13 to
16 counties in a specific geographical region of the state. The DED is also
responsible for building, monitoring and strengthening relationships with campus and
county partners.
Program Assistant/Program Associate/ Technician - Program
assistants/associates/technicians are under the direction of a county Extension
agent and assist in coordinating and delivering focused educational activities in a
well-defined area. Generally program assistants/associates have very defined
duties in program delivery and are not responsible for development of the total
Support Staff - Administrative Secretaries and Extension secretaries that provide assistance in initial contact with the public. Often, support staffs provide
assistance in development and delivery of educational materials to clientele. The
support staffs are also responsible for clerical duties, handling funds, public
relations, and office management.
Total County Extension Program - For the purpose of this study, the author used the Total County Extension Program to describe all functions of the county
program and all duties of the entire staff. The Total County Extension Program was
described as an aggregation of the individual programs, programming components,
functions, and administrative duties associated with the daily operations of an
Extension center.
The County Extension Director leads the Total County Extension Program in
the traditional disciplines, which include agriculture, family and consumer education
(formerly home economics), 4-H and youth, and community development. The
County Extension Director seeks to develop an interdisciplinary team to address
local problems through a systems approach using available resources and expertise.
Patton stated that the systems approach makes all programs interdependent, thus
the whole is greater than the sum of its’ parts (Patton, 1987).
Programming - the conceptual schema using non-formal educational techniques to deliver planned educational activities to a target audience. These
activities are sequenced in a manner to reach a specific goal. Most programming
models agree that the core of any non-formal program include three phases;
Assumptions
The writer assumed that the participants (decision-makers) in this study were
honest in their responses. The author also assumed that participants responded of
their own free will without fear of reprisal. Considerable effort was taken to ensure
participants of the confidentiality of the individual respondent and also the identity of
specific county information. The study operated under the assumption that the
decision-makers were knowledgeable about the items contained in the instrument.
This assumption required that the instrument contained clear and well-understood
terms for the participants regardless of their level of association with Cooperative
Extension. The next assumption was that the timing and handling in administering
the instrument was not threatening or uncomfortable for the participants.
Limitations
This study was limited to the population of decision-makers within the North
Carolina Cooperative Extension Service. The population was limited to County
Commissioners, County Managers, Extension Administrators, Extension advisors,
and Extension staff at the County Centers. Further limitations resulted from the
variance of non-response rate among the various decision-maker groups within each
cluster. The two external decision-maker groups had the lowest response rate and
proved the most difficult to reach. These decision-makers were the advisory leaders
and the county commissioners. The highest response rate was from the county
Chapter Summary
This chapter introduced the reader to the foundational characteristics of
Cooperative Extension. The uniqueness of the funding partnership has created
special challenges and opportunities for Extension program accountability. Various
decision-maker groups’ perception of quality was based on many independent
variables. For the purpose of this study, the decision-makers are categorized into
Extension advisory council members, county government officials, County Extension
faculty and staff, and Extension administrators. Quality Extension Programs are
community-based, customer focused, relevant, timely and accountable to the public.
Successful county programs also exhibit a dynamic programming process under the
direction of a competent, creditable staff using a team approach for effective local
programming. The purpose of this research was to examine the decision-makers’
perceived characteristics of a Total County Extension Program and document
observed degree of variance of these characteristics. The next chapter will review
previous research findings in the literature surrounding the definition of quality
CHAPTER II
Conceptual Schema and Review of the Literature
This chapter presented the conceptual and theoretical framework for quality
Total County Extension Programs and the conceptual framework developed for the
focus of this study. The conceptual schema was a tool used to describe possible
contributing factors associated with decision-makers’ perception quality of Extension
programs. This conceptual model was developed as a result of an extensive review
of related studies found at the conclusion of the chapter. The remainder of the
chapter reviewed the evolution and development of the widely accepted
programming model. Within the review, many indicators of quality were identified.
The chapter also explored the literature on quality movement and how that has
influenced Cooperative Extension programs.
Conceptual Framework
The main objective of this study was to describe decision-makers’ perception
of quality indicators related to the Total County Extension program. Literature and
research findings surrounding decision-makers’ characteristics, decision-makers’
perception, and criteria of quality Extension programs were reviewed to build the
conceptual schema. Significant independent variables that may contribute to the
perception of quality were identified specifically for Extension programs. For the
determine their possible relationship with the dependent variable. The dependent
variable was the perception of indicators for quality Total County Extension program.
The literature suggested that perceptions are based on the individuals’
experiences, roles, background, beliefs, attitudes and values (Solvin, Berko, and
Wolvin, 1993). Substantial research supported the findings concerning the
variations within decision-makers’ perspectives. Research found the dependent
variable was related to stakeholders’ background, roles, and experiences (Pettit,
1993; Pearson, 1998; Osborne, 1991; Carberry, 2000; Baldwin, 2002). Therefore,
similar independent variables were measured in this study to explore their
relationship to the dependent variable. The independent variables measured by this
study were categorized as socio-demographic factors, organizational factors and
spatial factors.
The socio-demographic factors (independent variables) included in this study
were age, ethnicity, gender, and education level. Age, gender, and level of education
were determined to have an influence on decision-makers’ perception in the
Pearson (1998) and Pettit (1993) studies. Osborne (1991) identified age as an
independent variable that influenced perception of decision-makers. Pearson (1998)
found significant variation of images of decision-makers by ethnicity. Carberry
(2000) also identified age, ethnicity, and level of education as contributors to the
dependent variable. These socio-demographic factors identified some measurable
indicators of the decision-makers’ experiences that were foundational in shaping the
decision-makers’ perception of quality programs. Pearson reported that ethnicity
of service received by different ethnic groups. This independent variable could
interact with decision-makers’ level of contact and consequently, the perception of
Cooperative Extension.
The spatial category relates to the stakeholders’ environment at the time of
the study. Independent variables found in the research by Carberry (2000) included
size of staff, location of center, and urban/ rural community setting. Baldwin (2002)
and Shonkwiler (1995) reported in their research that location of Extension centers
was a key factor in decision-makers perception of Cooperative Extension. Pearson
(1998) also reported geographical variations for stakeholders’ perception included
accessibility to center, length of residence in the community, and the rural
community versus the urban settings. Taylor-Powell et al. (1995) found that
community background and local presence were factors in decision-makers’
perception of quality criteria. Baldwin (2002), Pettit (1993), Carberry (2000),
Shonkwiler (1995), found that size of staff, and the proximity of the office was
associated with the perception of the stakeholder. Shonkwiler (1995) and Osborne
(1991) reported that favorable external decision-makers’ perception were “at risk”
when the structure of the organization changed the staffing patterns and center
locations. The findings in the literature concluded that as size of staff increased the
perception was that quality increased. Also, as locations were more accessible to
the clientele the quality was perceived to increase.
Organizational factors were the third category of independent variables.
Factors such as stakeholders’ role, length of association, intensity of association,
(2002), Osborne (1995), Pettit (1993), Taylor-Powell et al. (1995) found that the role
of stakeholders could be subdivided into internal and external roles. Perceptions and
expectations within these two sub-groups were found to often be at different ends of
the spectrum. Baldwin (2002) found influence on stakeholders’ perception by the
length (time) of association with the organization, frequency or intensity of the
association (level of interaction) and role of the stakeholder (position). Of special
interest in this study, Baldwin examined the effect of length of relationship with
perception of quality. Baldwin’s findings indicated that organizational image was
higher for internal stakeholders over time, while external stakeholders perception of
organizational image decreased over time. Subsequently the literature supported
the concept that the role of the stakeholder influenced their perception (Shonkwiler,
1995; Baldwin, 2002). Pearson (1998) reported that perception of external
stakeholders was associated to the level of contact with Cooperative Extension. A
favorable perception from stakeholders was related to a moderate to high level of
contact with the organization. The stakeholders’ primary role was predicted to have
a major influence on the perception of quality in the total Extension program. This
certainly is supported by the research of Taylor-Powell et al. (1995). Other research
that supported the contribution of to the role/association of the stakeholders
included; Shonkwiler, (1995); Baldwin, (2002); Pettit, (1993); Osborne, (1991); and
Carberry, (2000).
Within the three categories of socio-demographic factors, spatial factors and
organizational factors there were a total of eleven independent variables to examine.