ABSTRACT
RUCKDASHEL, REBECCA ROSE. Dyeability of Polypropylene Nonwovens. (Under the direction of Behnam Pourdeyhimi.)
Polypropylene is the most prevalent type of material used in the nonwovens industry. Polypropylene’s high crystallinity and low affinity for dye molecules make it difficult to dye. One way to improve polypropylene’s dyeability is to blend it with nylon. However adding nylon may change the thermal and tensile properties of the overall material making it more difficult to process with polypropylene conditions. Polypropylene filaments and spunbond fabrics were made with one nylon based additive, EZ Dye Masterbatch from Aquadye Fibers Inc. The filaments were monocomponent or sheath/core bicomponent. Monocomponent filaments became weaker and stretchier with increasing concentration of the additive. Filaments with additive in the core had the highest disperse dyeability. The tenacity
Dyeability of Polypropylene Nonwovens
by
Rebecca Rose Ruckdashel
A thesis submitted to the Graduate Faculty of North Carolina State University
in partial fulfillment of the requirements for the Degree of
Master of Science
Textile Engineering
Raleigh, North Carolina 2015
APPROVED BY:
_______________________________ ______________________________
Behnam Pourdeyhimi Eunkyoung Shim
Committee Chair
DEDICATION
Dale Malone
Randy and Meg Ruckdashel
BIOGRAPHY
Since June 2002, Rebecca has been an avid hand knitter who is always excited to try new patterns and yarn materials. In 2012, Rebecca became a hand spinner so that she could have more control over the yarn she worked with as a knitter. She learned different
techniques for plying, including Navajo plying, in order to achieve different color patterns in her yarns. She has experimented with low batch dyeing of wool, including crock-pot, sun, and stove top methods.
Concurrently with her love of handcrafts, Rebecca has learned to study materials from a scientific perspective. Rebecca Ruckdashel received her Bachelor of Science in Engineering Physics from Cornell University in 2011. She completed an internship with Samsung’s Liquid Crystal Display Division as part of their Global Internship program in
Gihueng, Korea. During the internship she worked on process architecture, i.e. validating process parameters for scaling up production on the chemical deposition of liquid crystals and circuitry on display screens.
In late 2011, she returned to the USA as an Assistant Product Manager at Laserfiche in Long Beach, CA. She is a certified Pragmatic Product Marketer and Product Manager.
She moved to Raleigh in 2014 to pursue a master’s degree in Textile Engineering,
ACKNOWLEDGMENTS
Eunkyong Shim, Ph.D Behnam Pourdeyhimi, Ph. D. Harold Freeman, Ph. D.
Jeffrey Krauss: dyeing and screen printing Amy Minton: tensile and thermal properties Teresa White: linear density measurements
TABLE OF CONTENTS
LIST OF TABLES ... ix
LIST OF FIGURES ... xi
1. Introduction ... 1
1.1 Motivation for the research... 1
1.2 Research Aims ... 2
1.3 Research Method Overview ... 2
2. Literature Review ... 3
2.1 Dyeability of Polypropylene ... 3
2.1.1 Patents: Additives Impacting Dyeability ... 4
2.1.2 Literature: Improving Dyeability of PP ... 4
2.1.3 Bicomponent Fibers ... 9
2.2 What are nonwovens?... 11
2.2.1 Web Bonding: Surface Textures ... 11
2.3 Color and Color Assessment ... 13
2.3.1 What is color?... 13
2.3.2 Light interacts with matter ... 14
2.3.3 Light Interactions with Dye Molecules ... 16
2.3.5 Color Assessment Methods ... 18
2.3.5.1 CIELab, Color Spectrophotometry ... 18
2.3.6 Print Quality Assessment Methods ... 20
2.3.6.1 Nonwoven Printability ... 20
3. Experimental: Dyeability of PP Filaments ... 22
3.1 Sample Preparation ... 22
3.2 Dyeability: High Energy Disperse Dye ... 24
3.2.1 Analysis of High Energy Disperse Dyeability ... 25
3.3 Dyeability: Low Energy Disperse Dye Trial on Knitted Samples ... 28
3.3.1 Color and Surface Properties ... 29
3.3.1.1 Monocomponent ... 29
3.3.1.2 Bicomponent ... 33
3.4 Analysis of Tensile Properties of Filaments... 38
3.4.1 Linear Density ... 38
3.4.2 Tensile Properties ... 39
3.4.2.1 Monocomponent Filaments ... 40
3.4.2.2 Bicomponent Filaments ... 43
3.5 Analysis of the Thermal Properties: DSC ... 47
3.5.2 Bicomponent... 52
3.6 Conclusions ... 56
3.7 Future Research ... 57
Molecular Dynamics Simulations ... 57
Optical microscope assessment of dye penetration depth ... 58
Analysis of optical properties of sheath/core filaments ... 58
4. Experimental: Printability of EZ Dye PP spunbond fabric ... 59
4.1 Sample Preparation ... 59
4.2 Screen Printing Trial with Low Energy Disperse Dye ... 59
4.2.1 Analysis of Printing Trial: Monocomponent ... 60
4.2.2 Analysis of Printing Trial: Bicomponent ... 67
4.2.2.1 Color Assessment... 67
5.3 Preliminary Assessment of Acid Dyeability ... 70
5.3.1 Color assessment: CIE Lab ... 70
5.4 Conclusions ... 71
5.5 Future Research ... 72
Print Quality of Digital Inkjet Printing ... 72
Wash and UV Fastness ... 72
REFERENCES ... 73
APPENDICES ... 79
Appendix A: Definition of Terms ... 80
Tensile Property Terms ... 80
Color Property Terms ... 80
LIST OF TABLES
Table 1: Summary of filaments spun and their sample ID's. ... 24
Table 2: Comparison by concentration of additive for monocomponent. Standard was the PP with no additive. The Tolerances were 2.15 for DL*, 1.25 for Da* and 1.25 for Db*. ... 30
Table 3: Comparison of 2.5% overall concentration with different distributions. The standard was the monocomponent material with 2.5% additive. Tolerances were 1.80 for DL*,1.20 for Da* and 1.65 for Db*. ... 35
Table 4: Comparison of 5% overall concentration with different distributions. The standard was the monocomponent material with 5% additive. The tolerances were 1.60 for DL*, 1.25 for Da* and 1.80 for Db*. ... 35
Table 5: Summary of results from Vibromat... 39
Table 6: Print Paste Recipe ... 60
Table 7: Comparison of lightly bonded samples for increasing additive concentration. ... 63
Table 8: Comparison of single row hydro samples for increasing additive concentration. ... 64
Table 9: Comparison of double row hydro samples for increasing additive concentration. . 64
Table 10: Compare by hydro bonding jet strip type: Standard was 2.5% concentration monocomponent fibers lightly bonded printed samples. ... 64
Table 11: Compare by hydro bonding jet strip type: Standard was 5% concentration monocomponent fibers lightly bonded printed samples. ... 65
Table 12: Sheath distributed EZ-Dye additive compared to 2.5% additive in monocomponent distribution with the same bonding. ... 69
Table 14: Comparison of lightly bonded samples for increasing additive concentration. ... 82
Table 15: Comparison of single row hydro samples for increasing additive concentration. . 82
LIST OF FIGURES
Figure 1: Diagram comparing the two types of Jet Strips used in this research
(Anantharamaiah, Rompert, Tafreshi, & Pourdeyhimi, 2007). ... 12
Figure 2: The spectrophotometer illuminates the sample, detects reflectance at each
wavelength in the visible spectrum and translates the information into a coordinate in color
space. ... 19
Figure 3: Diagram of Hills Trico Spin Line. For monocomponent, the core and sheath
hoppers contained same concentration of additive. For bicomponent, the concentration
differed. ... 22
Figure 4: Diagram of EZ Dye additive distribution in PP filaments. Red represents EZ Dye
Additive, tan represents neat PP. Relative sizes are approximate. ... 23
Figure 5: Increasing EZ Dye additive percentage (left to right: 0%, 1%, 2.5%, 5%, and 10%)
increases the darkness of shade with 2% o.w.f. Dianix Navy S-2G. ... 25
Figure 6: Total EZ Dye additive concentration of 2.5% (mono, sheath or core). Top left is
mono. Other top are sheath (50% or 25% of fiber). Bottom row is core (50% or 25% of fiber)
with 2% o.w.f. Dianix Navy S-2G. ... 26
Figure 7: Total EZ Dye additive concentration of 5%. Top left is mono. Top right is sheath
(50%). Bottom is core (50%) with 2% o.w.f. Dianix Navy S-2G. ... 27
Figure 8: Photograph of dyed samples progressing from low to high additive concentration
from left to right. Fluorescent lighting and white paper background with 2% o.w.f. Dianix
Figure 9: Graphical representation of Db*, Da*, and DL* with regards to concentration.
(SAS Institute Inc, 1989-2007) ... 31
Figure 10: Linear fit of Db* by Concentration of EZ Dye Additive using JMP. R-square is
0.888169. Slope is -0.9989558 and y-intercept is -12.01233. (SAS Institute Inc, 1989-2007)32
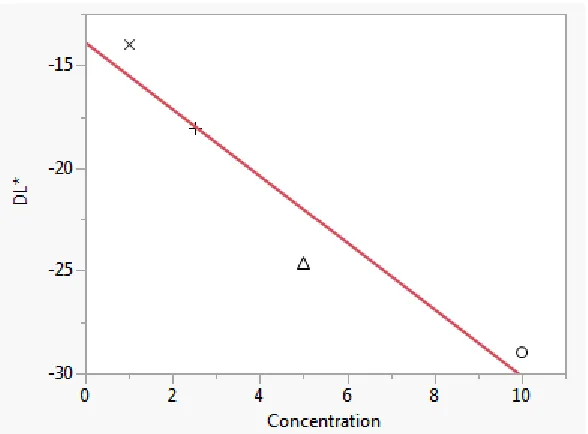
Figure 11: Linear fit of DL* with regards to concentration. Rsquare is 0.923089. Slope is
-1.6236412 and the y-intercept is -13.88316. (SAS Institute Inc, 1989-2007) ... 32
Figure 12: Total EZ Dye additive concentration of 2.5%. Top row is mono, sheath (50%) and
sheath (25%). Bottom row is core (50% or 25% of fiber cross section). 2% o.w.f. Dianix Blue
AC-E. ... 33
Figure 13: Total EZ Dye additive concentration of 5%. Top right is sheath. Middle left is
mono. Bottom right is core. 2% o.w.f. Dianix Blue AC-E. ... 34
Figure 14: Computer generated rendering of sample colors with 2% o.w.f. Dianix Blue
AC-E.. ... 35
Figure 15: Difference in blue between bicomponents and same total concentration
monocomponent versus additive concentration. Core (circles) and Sheath (squares). (SAS
Institute Inc, 1989-2007) ... 36
Figure 16: Difference in lightness between bicomponents and same total concentration
monocomponent versus additive concentration. Core (circles) and Sheath (squares). (SAS
Institute Inc, 1989-2007) ... 37
Figure 17: Linear fit of difference in blue versus concentration. R-square is 0.9962548. Core
-2.46. Note that the concentrations are given as decimals instead of %. (SAS Institute Inc,
1989-2007) ... 38
Figure 18: Tenacity of filaments with increasing concentration of EZ-Dye additive. ... 40
Figure 19: Elongation at break with increasing concentration of EZ Dye. ... 41
Figure 20: PP Stress Strain Curve ... 42
Figure 21: PP with 1% EZ Dye additive. ... 42
Figure 22: PP with 2.5% EZ Dye additive. ... 42
Figure 23: PP with 5% EZ Dye additive. ... 42
Figure 24: PP with 10% EZ Dye additive. ... 43
Figure 25: Tenacity for EZ Dye concentration of 2.5% and 5% overall. ... 44
Figure 26: Elongation at Break for EZ Dye concentration of 2.5% and 5% overall. ... 45
Figure 27: S5 ... 46
Figure 28: S10-25 ... 46
Figure 29: C5 ... 46
Figure 30: C10-25 ... 46
Figure 31: Sheath 10% (5% total). ... 47
Figure 32: Core 10% (5% total). ... 47
Figure 33: PP without additive... 48
Figure 34: PP with 1% EZ-Dye additive. ... 49
Figure 35: PP with 2.5% EZ-Dye additive. ... 49
Figure 36: PP with 5% EZ-Dye additive. ... 50
Figure 38: Percent Crystallinity as a function of concentration. (SAS Institute Inc,
1989-2007) ... 51
Figure 39: Crystallization onset temperature increases with concentration. (SAS Institute
Inc, 1989-2007) ... 51
Figure 40: 5% EZ-Dye additive in core for a total additive concentration of 2.5%. ... 52
Figure 41:10% EZ-Dye additive in core occupying 25% of fiber cross section for a total
additive concentration of 2.5%. ... 52
Figure 42: 10% EZ-Dye additive in core for a total additive concentration of 5%. ... 53
Figure 43: 5% EZ-Dye additive in sheath for a total additive concentration of 2.5%. ... 53
Figure 44:10% EZ-Dye additive in sheath occupying 25% of fiber cross section for a total
additive concentration of 2.5%. ... 54
Figure 45: 10% EZ-Dye additive in sheath for a total additive concentration of 5%... 54
Figure 46: Percent crystallinity over total EZ-Dye additive concentration. Core (circle).
Sheath (square). (SAS Institute Inc, 1989-2007) ... 55
Figure 47: Crystallization onset temperature over total EZ-Dye additive concentration. Core
(circle). Sheath (square). (SAS Institute Inc, 1989-2007) ... 56
Figure 48: Spunbond Continuous Process ... 59
Figure 49: Lightly bonded samples. Concentration of additive, from left to right, was 0%,
2.5%, and 5%.Screen printed with Dianix Blue AC-E print paste. ... 61
Figure 50: Single row jet strip hydroentangled samples. Concentration of additive, from left
Figure 51: Double row jet strip hydroentangled samples. Concentration of additive, from left
to right, was 0%, 2.5%, and 5%. Screen printed with Dianix Blue AC-E print paste. ... 62
Figure 52: White unprinted areas on PP after screenprinting with Dianix AC-E. ... 63
Figure 53: Staining on PP after screenprinting with Dianix AC-E... 63
Figure 54: Change in Blue from printed PP (no additive) versus concentration. Double
(triangle). Single (square). (SAS Institute Inc, 1989-2007) ... 66
Figure 55: Single row jet strip bonded samples, mono (left) and sheath (right), with same
concentration of EZ Dye additive. Screen printed with Dianix Blue AC-E print paste... 68
Figure 56: Double row jet strip bonded samples, mono (left) and sheath (right), with same
concentration of EZ Dye additive. Screen printed with Dianix Blue AC-E print paste... 69
Figure 57: Change in blue and lightness for bicomponent. Double (triangle). Single
(square). (SAS Institute Inc, 1989-2007) ... 70
1. Introduction
1.1 Motivation for the research
A polyolefin is a type of polymer made from materials derived from cracking
petroleum oil. Polyolefins are composed of carbon and hydrogen atoms. Polypropylene is the most prevalent polyolefin used in nonwovens (Spunmelt Polypropylene: The Leading Global Technology for Nonwoven Supply and Demand, 2015) (Grandview Research, n.d.).
Currently, color is added to polypropylene as pigments prior to extrusion of fibers; this is due to polypropylene’s low affinity for dye molecules and high crystallinity (Washington, DC: US Patent and Trademark Office Patent No. 8,759,430, 2014) . Polypropylene materials are colored in large batches and stored, adding costs for suppliers. Additional costs come from flushing systems in between different pigments to prevent contamination. Disperse dyes require high pressure, high temperature conditions in order to impart color (Houser, 2010). Dyeing polyolefins closer to the point of sale and under lower pressure conditions may decrease supplier costs. One way to make polypropylene dyeable closer to the point of sale is EZ Dye Masterbatch from Aqua Dye Fibers Inc.
However, there are a few concerns for EZ Dye Masterbatch not currently addressed by the literature. First, the increase in dyeability due to EZ Dye Masterbatch may come at the cost of reduced processability due to changes in tensile properties. Second, EZ Dye
determination should be made into the impact of surface features on nonwoven fabrics and ways to minimize these.
1.2 Research Aims
Goal: Investigate the dye and print properties of polypropylene due to EZ Dye Masterbatch additive to assess effectiveness of the additive.
Aim 1: Dyeable polypropylene filaments. Look at effects of the distribution and concentration of additive within the fiber cross-section. Effects include dyeability, thermal properties, and tensile properties.
Aim 2: Printable polypropylene spunbond mats. Look at printability as a function of distribution and additive concentration within the fiber cross-section as well as web bonding type.
1.3 Research Method Overview
2. Literature Review
2.1 Dyeability of Polypropylene
Polypropylene (PP) fibers are hydrophobic, highly crystalline, and non-polar. They are used in a variety of applications including packaging, consumer goods and hygiene products. Hydrophobic polymers do not contain the basic groups necessary to bond to acid, reactive, or direct dyes (United States of America Patent No. 3,305,603, 1967). In the case of disperse dyes, it is difficult for dye molecules to travel into the PP fiber’s polymer network due to PP’s high crystallinity (Dayioglu, 1992) (Kotek, 2004) (Yu, Zhu, Shong, & Chen,
2001) (Yan, Chen, Zhang, & Wu, 2010). Also, PP lacks affinity for dye molecules so that the fibers do not hold onto the dye molecules (Dayioglu, 1992) (Kotek, 2004) (Yu, Zhu, Shong, & Chen, 2001) (Yan, Chen, Zhang, & Wu, 2010).
Industry has been slow to adopt solutions from academic research which may make PP easier to dye (Son, Lim, & Chang, 1999). This slow adoption may be a result of several factors including cost, industrial demands, lack of method comparisons, and production scaling. The researched solutions may cost more than the current situation is costing suppliers, i.e. storage and waste. The solutions may not result in a high enough dyeability increase to meet customer’s requirements or may lose some of the material properties that
method, rather than the processing concerns of the solution or how it could be scaled up to meet industrial needs.
2.1.1 Patents: Additives Impacting Dyeability
The EZ-dye masterbatch additive is blended by weight percent as pellets with the polymer pellets pre-fiber extrusion (Washington, DC: US Patent and Trademark Office Patent No. 8,759,430, 2014). The additive is composed of 80% nylon, 6% malic anhydride modified PP, 1-6% nylon stabilizer, and 6% PP (Washington, DC: US Patent and Trademark Office Patent No. 8,759,430, 2014).
Malic Anhydride has been used before to increase the processability of PA6/PP blends so that more than 10% PA6 could be used (China Patent No. 10,313,044, 2013). The mixture of malic anhydride (1.2-1.8%), PP (73.14-78%), PA6 (20.14-25%), and initiator
(0.035-0.06%) required a maximum extruder temperature of 240C to 250C to spin blended
fibers (China Patent No. 10,313,044, 2013).
If 10% of EZ-Dye masterbatch is added to PP, then the mixture is 0.06% malic anhydride, 90.6% PP, 8% nylon and about 2% other components. The EZ-Dye Masterbatch results in spun fibers with a very high percentage of PP and increased disperse dyeability from PP.
2.1.2 Literature: Improving Dyeability of PP
It has been shown by the literature that there are numerous ways to increase the dyeability of melt spun polyolefins. Three ways to alter PP for increased disperse dyeability are copolymerizing, blending (Dayioglu, 1992) (Teli, Adivarekar, Ramani, & Sabale, 2004), or adding polymer particles (Dayioglu, 1992) (Son, Lim, & Chang, 1999) (Yu, Zhu, Shong, & Chen, 2001) (Yan, Chen, Zhang, & Wu, 2010) (Mizutani, Nago, & Kawamura, 1997) (Xu & Liu, 2009) (Liu, Huang, Huang, Li, & Xu, 2011) (Yu, Jiang, Chen, & Chen, 2009). Blending and copolymerizing lead to increased dyeability at the cost of fiber spinnability, as the non-PP component in the fibers is increased (Dayioglu, 1992) (Teli, Adivarekar, Ramani, & Sabale, 2004).
From the literature, blending appears to be the most common approach. PP has been blended with poly(ethylene-covinyl acetate) (Son, Lim, & Chang, 1999), nylon 6 (Kotek, 2004), PBT (Teli, Adivarekar, Ramani, & Sabale, 2004), Polystyrene (Teli, Adivarekar, Ramani, & Sabale, 2004), nano-ceria hybridized Polystyrene (Yu, Jiang, Chen, & Chen, 2009), low molecular weight Polystyrene (Yu, Zhu, Shong, & Chen, 2001) or glycidyl methacrylate-divinylbenzene (Godshall, White, & Wilkes, 2001). Overall, each of these polymers contain more functional groups, polarity or make packing more difficult. They appear to increase the affinity for dyes or the fiber amorphous regions or both.
Chen, & Chen, 2009). Again, the goal appears to be to lower the crystallinity of the whole and increase the affinity for dye.
Some of the literature pertains to changes in tensile properties as a result of additives. Increasing the copolymerization of high molecular weight PP with 2-vinyl pyridine/styrene to 4% resulted in fiber breakage during spinning (Dayioglu, 1992). Blending poly(ethylene-covinyl acetate) with PP increased the total fiber strain to failure and decreased the tenacity (Son, Lim, & Chang, 1999). PP-g-MAH in PP/Nylon 6 blends decreased tenacity of
monofilaments (Kotek, 2004). PBT and PS decreased tenacity, crystallinity and orientation (Teli, Adivarekar, Ramani, & Sabale, 2004). Nano-ceria hybridized PS decreased strength to break and crystallinity, but increased molecular orientation (Yu, Jiang, Chen, & Chen, 2009). Low molecular weight PS increased fiber shrinkage (Yu, Zhu, Shong, & Chen, 2001).
Dye properties noted by researchers vary, although all additive technologies increased dyeability. Copolymerizing with 2-vinyl pyridine/styrene increased the dye uptake
One group of researchers attempted to create a disperse dyeable PP that used chemical bonding to adhere the dye to the substrate; i.e. the dye bonded to GMA-DVB (Mizutani, Nago, & Kawamura, 1997). They removed any dye that was weakly adhered or dispersed in the fibers by washing with hot water, nonionic liquid detergent, and acetone (Mizutani, Nago, & Kawamura, 1997). This novel approach was likely taken to increase the fastness properties of the dyed material. GMA-DVB had no impact on the fiber crystallinity (Mizutani, Nago, & Kawamura, 1997). The dyeability was assessed visually, comparing the PP samples to the blended samples (Mizutani, Nago, & Kawamura, 1997). This approach and grading system was biased against PP since the researchers removed all of the dispersed dye prior to assessing color differences. A less biased approach would have been to assess color before the washing procedure and then again after, i.e. assess the wash fastness of both methods.
One group of researchers examined the impact of a compatibilizer, PP-g-MAH, on blended PP and Nylon 6 filaments (Kotek, 2004). The researchers used 2% o.w.f high energy disperse dyes (CI Disperse Blue 56, CI Disperse Blue 60 and CI Disperse Red 73) with a 130C dye bath for 30 min to dye knitted tubes of meltspun filaments (Kotek, 2004). The
may be an ideal fraction of compatibilizer and nylon 6 in the overall fiber make up. However, this fraction may be both dye and hue dependent and require a trade-off for the darkness of color on the dyed fibers, i.e. increasing nylon 6 increases darkness, but decreased the hue (blue in this case).
Researchers have dyed PP in disperse dye baths as low as 100C (for 60 min)
(Mizutani, Nago, & Kawamura, 1997) and as high as 130C (for 40 min) (Son, Lim, &
Chang, 1999). Increasing temperature decreases the amount of time it takes for the dye molecules to disperse into the fibers, however there is a limit to how hot the dye bath can be depending on the melting point of the polymer. Theoretically, this temperature is at
maximum below the onset of melting temperature of the fiber constitutes. The dye bath can range from 1 to 12.5% by weight of fibers with a liquor ratio of 20:1 or 50:1 (Dayioglu, 1992) (Son, Lim, & Chang, 1999) (Yu, Zhu, Shong, & Chen, 2001) (Yan, Chen, Zhang, & Wu, 2010). Dye bath constituents range by particular dye used and researcher preference, but most contain a dispersing agent (Dayioglu, 1992) (Son, Lim, & Chang, 1999) (Yu, Zhu, Shong, & Chen, 2001) (Yan, Chen, Zhang, & Wu, 2010). Other dye bath contents include carriers, leveling agents, and pH modifiers such as ammonium acetate, sodium acetate, or acetic acid (Dayioglu, 1992) (Son, Lim, & Chang, 1999) (Yu, Zhu, Shong, & Chen, 2001) (Yan, Chen, Zhang, & Wu, 2010) (Mizutani, Nago, & Kawamura, 1997).
While there are a variety of additives that can be used to increase disperse or acid dyeability of PP, no attempt has been made to rate the success of each additive relative to the others. This is due to the use of different methods to assess dyeability and to dye the
concentrations, dye bath time and temperature, dyestuffs, pre-treatment and post-treatment, and the method for assessing dyeability (visual, K/S, or CIELab). While some calculation could control for dye concentrations and convert measured values to reflectance at each wavelength, the other variables cannot be eliminated as sources of uncertainty.
Another way to increase dyeability of PP is through post-processing, such as plasma treatment or coating. Plasma treatments can functionalize the polymer surface for increased acid dyeability, but lead to increased crystallinity which decreases disperse dyeability (Yan, Chen, Zhang, & Wu, 2010). Down powder, waste down fiber ground into superfine down powder less than three micrometers in size, can functionalize the fiber improving acid dyeability, insulation, wettability, and degradation resistance (Xu & Liu, 2009) (Liu, Huang, Huang, Li, & Xu, 2011). Both methods improve acid dyeability, but may have trade-off such as cost and dye fastness.
In conclusion, researchers tended to approach improving disperse dyeability through additives and acid dyeability through post-processing. Each method had trade-offs ranging from changes in tensile properties to increasing crystallinity. Comparison between methods is risky due to differences in processing and testing procedures.
2.1.3 Bicomponent Fibers
Fibers can have a variety of shapes and cross-sections. Bicomponent fibers are composed of two types of material that differ in some way. Patents have been filed for bicomponent PP fibers across a wide range of industries, including medical, hygiene
section with two concentric circles of the two components. The circles can be distributed with equal area (50%) or one can be larger than the other (25%/75% for example).
Dyeable bicomponent fibers have had various, patented, formulations. Polyester and nylon 6 or nylon 6,6 bicomponent fibers have been shown to increase acid dyeability by counteracting the polyester’s high crystallinity and molecular orientation (United States of
America Patent No. 27,049, 2005). Nonwovens can be thermally bonded with PET or PBT or nylon co-extruded with malic anhydride/acid grafted onto PE as 0.1 to 1% of the grafted polymer as a circular sheath-core fiber (Europe Patent No. 496,734, 1999). PP was not
chosen because its melting point, 145C, was too high for it to function as a thermal binder with PET, PBT, or nylon (Europe Patent No. 496,734, 1999). The amount of malic
2.2 What are nonwovens?
Nonwovens are randomly oriented fiber structures bonded together through a mechanical, thermal or chemical mechanism. PP makes up the majority of nonwoven products with PET coming in a distant second (Grandview Research, n.d.). Nonwoven materials may be formed from staple fibers or polymer pellets. Staple fibers can be aligned into a web using carding and crosslapping. Polymer pellets can be formed into a web using a spunlaid process. Spunlaid materials are fast and economical to make and have a variety of applications, including diapers, hygiene protects, and protective apparel (Rupp, 2008). They are low weight, high strength, and comfortable materials (Rupp, 2008). Spunbond fabrics are spunlaid and then bonded. The spunbond process has higher processing speeds than carding and crosslapping.
2.2.1 Web Bonding: Surface Textures
Two web bonding mechanisms were used for this research: needlepunching and hydroentangling. Both methods entangle the fiber web through a mechanical mechanism. Needlepunching mechanically entangles fibers by penetrating the web with barbed needles. Hydroentangling mechanically entangles fibers by penetrating the web with fine, high pressure water jets (Anantharamaiah, Rompert, Tafreshi, & Pourdeyhimi, 2007) (Shim & Pourdeyhimi, 2005).
that appear on the surface of the material as a result of the jet strips because each orifice creates a stationary jet of water under which the web passes (Shim & Pourdeyhimi, 2005). This problem can be resolved with a double row jet strip (Anantharamaiah, Rompert, Tafreshi, & Pourdeyhimi, 2007).
Traditional single row jet strips have a spacing between nozzles of 500 to 600 µm and the same size orifice, 130 µm, throughout (Anantharamaiah, Rompert, Tafreshi, &
Pourdeyhimi, 2007). A double row jet strip has a row of standard sized nozzles and a second row of smaller nozzles, 100 µm, all with the standard spacing between them
(Anantharamaiah, Rompert, Tafreshi, & Pourdeyhimi, 2007) (Figure 1). The jets from the large nozzles, first row, wash away the previous streaks and make new ones while the
smaller jets, second row, wear away the new streaks (Anantharamaiah, Rompert, Tafreshi, & Pourdeyhimi, 2007). The double row jet strip increased tear strength by 30%
(Anantharamaiah, Rompert, Tafreshi, & Pourdeyhimi, 2007).
2.3 Color and Color Assessment
2.3.1 What is color?
Color can be a property or attribute of an object, a characteristic of light rays, or human perception of reflected light (Nassau, The Physics and Chemistry of Color: The Fifteen Causes of Color, 2001) (Tilley, 2000). It is the part of the electromagnetic spectrum running from 400 nm (violet) to 700 nm (red) which is interpreted by the human retina as a color, i.e. the visible spectrum (Rossotti, 1985) (Tilley, 2000). Opaque objects appear to be a color when they absorb some part of the visible spectrum, humans see the wavelengths that are reflected (Rossotti, 1985). Color is perceived by rods (brightness) and cones (color hues) on the retina of the eye (Rossotti, 1985) (Tilley, 2000). Each color can be represented by a unique ratio of the three cones. The signal is sent from the retina to the visual cortex where it is processed into a perception of color.
The eye cannot distinguish the components of a mixture of colors, instead humans perceive the mixture (Nassau, The Physics and Chemistry of Color: The Fifteen Causes of Color, 2001). For example, humans see purple when there is a mixture of red and blue paints and see white when there is a mixture of yellow and blue lights. Paint colors mix by
“subtractive color mixing” because each paint subtracts, absorbs, some wavelengths of the
selected print head colors (Tilley, 2000) (Rigg, 1997) (Nassau, The Physics and Chemistry of Color: The Fifteen Causes of Color, 2001). The colored lights also combine in an additive way (Rossotti, 1985).
Color can result from simple excitations and vibrations, ligand fields, molecular orbitals, energy bands, and geometric or physical optics (Nassau, Color for science, art and technology, 1998 ) (Rossotti, 1985). The strength of a color is related to the probability of that mechanism occurring, i.e. frequent events lead to stronger or darker colors (Rossotti, 1985).
2.3.2 Light interacts with matter
Light incident on a surface can be scattered, reflected, absorbed, transmitted, fluoresced, or some combination of those (Tilley, 2000) (Rossotti, 1985). As Newton discovered, only light that is fluoresced undergoes a change of color while interacting with matter, generally shifting from the ultraviolet range of wavelengths into the visible range (Germer, Tsai, & Zwinkels, 2014). Although the wavelength of light may be altered by interacting with matter, the perceived color remains the same (Nassau, The Physics and Chemistry of Color: The Fifteen Causes of Color, 2001).
The optical properties of a material are determined by its structure, i.e. the
geometrical arrangement of atoms, and morphology, i.e. surface features (Bordo & Rubahn, 2005).
passes through transparent objects; light does not pass through opaque objects; light is reflected from shiny objects; and light destructively interferes when reflected from the surface of matte objects (Rossotti, 1985).
Internal structures can shift the path of light traveling through or reflected from the object, the refractive index describes the amount of the shift. The refractive index of a material can be measured with oils, but light scattering from voids and fiber anisotropy can prevent an accurate measurement (Rhodes & Stein, 1964). Anisotropic materials may have more than one refractive index, suggesting that light is slowed to a different degree
depending on the incident direction (Nassau, The Physics and Chemistry of Color: The Fifteen Causes of Color, 2001). Fibers used for fiber optics have been shown to exhibit varying refractive indices across the fiber diameter depending on the number of modes within the fiber (Handbook of Optics, 1995). The refractive index of a material has been shown to influence the darkness of the color perceived (Yang & Huda, 2003). According to Fresnel’s equation, the reflectance of a material increases with increasing refractive index. The material’s measured color yield (K/S) can be written as a function of reflectance, such
that the color yield (darkness of color shade) decreases with increasing refractive index and increasing reflectance (Yang & Huda, 2003) .
The Kubelka-Munk equation for opaque samples describes the reflection from a sample at a given wavelength, R(λ), to be dependent on the absorption, K, and scattering, S
(Nassau, The Physics and Chemistry of Color: The Fifteen Causes of Color, 2001):
Using (1) and color yield values from research, the reflectance of a sample could be determined and compared.
2.3.3 Light Interactions with Dye Molecules
Light is absorbed and emitted as quantized energy by different structures within a molecule. Absorption of light leads to a transition in the molecule as an electron moves into an excited state. The available wavelengths for transitions for a molecule are determined by the selection rules (Nassau, The Physics and Chemistry of Color: The Fifteen Causes of Color, 2001). The emission of light accompanies the molecule, electron, returning to a less excited state.
Certain structures can be used to shift the energy of the quantized light needed to make a transition between states (Nassau, The Physics and Chemistry of Color: The Fifteen Causes of Color, 2001). Resonance structures are different electronic structures that a molecule may take on at the same level of energy. The presence of resonance structures lower the energy of available transitions so that it lies in the visible range (Nassau, The Physics and Chemistry of Color: The Fifteen Causes of Color, 2001). Dye molecules may contain repeated resonance structures in order to create vivid visible colors due to the transition energy being lowered into the visible range and the increase in frequency of the transition (Nassau, The Physics and Chemistry of Color: The Fifteen Causes of Color, 2001).
Conjugated systems are useful for lowering the energy of the transition between states (Nassau, The Physics and Chemistry of Color: The Fifteen Causes of Color, 2001)
2.3.4 Colorant Types and Applications
Pigments and dyes are the two major classes of colorants. Pigments are added pre-extrusion of fibers. Pigments are available in a limited gamut of colors (Yan, Chen, Zhang, & Wu, 2010) (Teli, Adivarekar, Ramani, & Sabale, 2004). Dyes are added as part of post processing either to yarns, fabric, or finished goods and are the preferred means of adding color by the traditional textile industry (Yan, Chen, Zhang, & Wu, 2010) (Teli, Adivarekar, Ramani, & Sabale, 2004).
There are several classes of dyes used depending on the substrate material including disperse and acid. Disperse dyes diffuse into the amorphous regions of the polymer network while acid dyes must bond to the substrate. Acid dyes require bath temperatures around
100C while disperse dyes can require temperatures in pressurized vessels of 130C. Both
types of dyes are applied in a mostly water bath with some pH modifier, although acid dyes are water soluble and disperse dyes are not. Acid dyes are used to dye wool. Dyes are added based on the weight of the material that is being dyed.
to the size of the dye molecules. High molecular weight molecules require a higher energy to penetrate into the fibers. Disperse dye molecules do not bond to the substrate.
Traditional pre-treatments for synthetic fibers include heat setting, desizing and scouring, fluorescent whitening/brightening, and pre-setting (Chemical Techonology in the Pre-treatment Processes of Textiles, 1999). These pretreatments are meant to aid with dye adhesion to the synthetic fibers and to improve the look of dyed fibers.
2.3.5 Color Assessment Methods
Color assessments use three terms to numerate color, 1) hue or color name, 2) value or lightness, 3) chroma or saturation (Tilley, 2000) (Gupte, 2010). The saturation of the color describes the amount of white light mixed into the hue, i.e. is it pale or washed out (Tilley, 2000). A color is saturated when adding more of it to a mixture does not change the shade of the mixture (Gupte, 2010).
Color can be assessed in a variety of ways including visual or colorimetric methods. Visual assessments are more closely tied to perception, but are more susceptible to individual differences in perception. Colorimetry, specifically CIELab color spectrophotometry, is less influenced by human perception differences, but it is farther removed from the human visual system, i.e. the numbers may not be informative on perceptible differences. CIELab color assessment focuses on the hue and the lightness of the color.
2.3.5.1 CIELab, Color Spectrophotometry
is measured by the spectrophotometer and interpreted into L, a*, and b* values, using a “Standard Observer” (Rigg, 1997) (Figure 2). The standard observer was created based on
the average of how human observers rated colors. It is an average, so it may not correlate to any one actual observer (Rigg, 1997). The size of the measurement orifice can impact the accuracy of the measurement, such that a larger orifice will give a better approximation of the entire object’s color (Rigg, 1997). Exact color is not as important as the differences in
color between two colored objects and color uniformity across a sample (Rigg, 1997).
Figure 2: The spectrophotometer illuminates the sample, detects reflectance at each wavelength in the visible spectrum and translates the information into a coordinate in color space.
CIELab spectrophotometry does not account for the object geometry, including gloss and surface features (Rigg, 1997). Calculated differences in color space use weighted difference formula, the tolerances of which are defined by ellipsoids that vary in size and curvature depending on the location in color space (X-Rite, Inc.).
distribution (fibers are parallel to each other) (Gangakhedkar, 2010). Unfortunately,
wrapping samples from a hank requires special care. Another method is to knit the filaments into a tube (Gangakhedkar, 2010). This allows for a uniform distribution within the samples (Gangakhedkar, 2010). Comparisons may only be made within one fabric type; all samples must be treated the same.
2.3.6 Print Quality Assessment Methods
Printing combines color and pattern, so printability, print quality, is an assessment of both color consistency and pattern distinction. Printed color can be assessed the same way as for dyed materials and may be impacted by the type of substrate.
Printed pattern distinction is more difficult to quantify and may be impacted by the surface texture of the fabric. Pattern traits may be assessed visually or optically/numerically, just as for color. Visual color assessments can be carried out by an individual with a
magnifying glass rating the perceived quality of various attributes (ASTM, 2008). Automated print quality assessment can be performed by making an image of the printed substrate and analyzing it using personal image analysis tools and ISO 13660 (Marks, Ujiie, & George, 2013) (Briggs, Klein, & Tse, 1999). The ISO 13660 standard to assess print quality of printed lines includes the attributes of average blur, average line width, and average rag (Marks, Ujiie, & George, 2013).
2.3.6.1 Nonwoven Printability
3. Experimental: Dyeability of PP Filaments
3.1 Sample Preparation
PP filaments were spun on the Hills Trico filament spinning line (Figure 3). The EZ Dye additive pellets were added by weight to commercial grade PP pellets, Braskem PP CP360H. The EZ Dye additive was used as received from Aquadye Fibers, Inc. For example, to achieve 10% EZ Dye additive in a monofilament 10g of EZ Dye additive were added to 100g of PP for both the sheath and core. Filaments had circular cross sections. To account for the addition of nylon due to EZ Dye additive, the melt temperature was increased to
248-249C. The filaments were spun at 2000m/min with 0.6 GHM throughput and drawn.
Monocomponent filaments were spun with 1%, 2.5%, 5%, and 10% EZ Dye additive. Filaments with 20% EZ Dye additive could be collected in free fall, but broke when drawn. These filaments broke as if they had been quenched for too long even though there was no quenching.
Bicomponent filaments were spun in a sheath/core configuration with a circular cross section (Figure 4). The EZ Dye additive was blended into the sheath or the core as either 5% or 10% of that section by weight. The sheath or core with EZ Dye additive could make up 25% or 50% of the total fiber cross section. A complete list of the spun bicomponent concentrations and distributions is given in Table 1.
Table 1: Summary of filaments spun and their sample ID's.
Sample ID % EZ Dye Additive
Distribution of Additive Total Additive Conc. (%)
PP 0 NA 0
Mono1 1 Monocomponent 1
Mono2.5 2.5 Monocomponent 2.5
Mono5 5 Monocomponent 5
Mono10 10 Monocomponent 10
S5 5 Sheath - 50% of filament 2.5
S10-50 10 Sheath - 50% of filament 5
S10-25 10 Sheath - 25% of filament 2.5
C5 5 Core - 50% of filament 2.5
C10-50 10 Core - 50% of filament 5
C10-25 25 Core - 25% of filament 2.5
3.2 Dyeability: High Energy Disperse Dye
Samples were wound into skeins, varying in mass from 3.25g to 8.53g, and placed into vessels of the Topspeed Datacolor automated dye machine with 2% of fiber weight fraction Dianix S-2G Navy (CI Disperse Blue 79) dye solution and four drops of acetic acid. The dye bath was brought up to 100mL with water so that the filaments were submerged.
Samples were heated to 130C, held there for 30 min, and then cooled off to room
temperature. Samples were rinsed in cool water until the run-off was colorless. The dye bath affluent was not colorless after the dyeing.
𝐴𝑚𝑜𝑢𝑛𝑡 𝐷𝑦𝑒 = 0.02 ∗ 𝑀𝑎𝑠𝑠 𝑜𝑓 𝑠𝑎𝑚𝑝𝑙𝑒 ∗1000
2 . (2)
3.2.1 Analysis of High Energy Disperse Dyeability
A qualitative assessment of the dyeability of the material was made visually. There were variable areas of darker color and lighter color in each sample, which may have been due to too short of a rinse cycle.
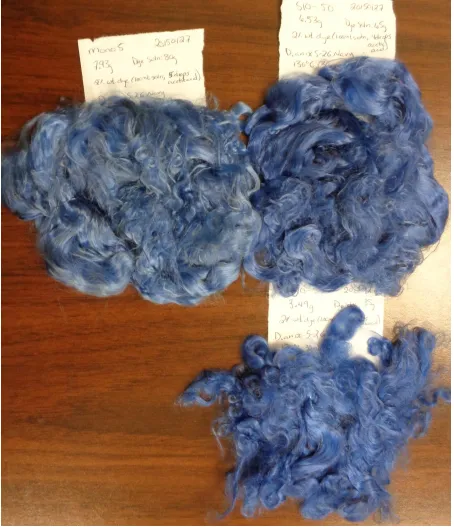
For monocomponent filaments, the darkness of the blue color increases with increasing EZ Dye additive from an extremely pale blue for neat PP to a medium blue for 10% EZ Dye additive (Figure 5).
Figure 5: Increasing EZ Dye additive percentage (left to right: 0%, 1%, 2.5%, 5%, and 10%) increases the darkness of shade with 2% o.w.f. Dianix Navy S-2G.
For the bicomponent filaments, changes in color were less apparent from a visual assessment.
core). Also, there appears to be little to no difference between samples for which the sheath and core were the same percentage of the entire filament and those for which the sheath or core (with the additive) occupied only a quarter of the entire fiber.
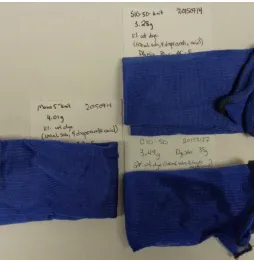
Figure 6: Total EZ Dye additive concentration of 2.5% (mono, sheath or core). Top left is mono. Other top are sheath (50% or 25% of fiber). Bottom row is core (50% or 25% of fiber) with 2% o.w.f. Dianix Navy S-2G.
Filaments with total concentrations of 5% EZ Dye additive were compared (Figure 7). The distributions with 10% EZ Dye in the sheath or core with the sheath or core
This visual assessment suggests the presence of differences between the bicomponent and monocomponent fibers. However, this visual assessment cannot be quantified and includes several sources of error, such as a variable light source (fluorescent overhead and flash photography), variable bundle density (casting shadows), and variable background (desk with wood grain aesthetic).
3.3 Dyeability: Low Energy Disperse Dye Trial on Knitted Samples
As discussed in section 2.3.5 , color differences can be quantitatively assessed with CIELab spectrophotometry on knit samples.
Samples were knit at a consistent gauge into about 8” long sections 3” in diameter on a circular knitting machine (Lawson-Hemphill). A grey cotton/polyester spacer was used between the segments. Samples were cut apart along the spacers and marked with fabric ink. Samples were weighed and then rinsed in a beaker of warm water in order to remove dust particles or lose contaminants with minimal stress to the fabric. Samples were moved to an
oven at 50C while the dye materials were prepared.
2% o.w.f. Dianix Blue AC-E (CI Unknown) dye solution, four drops of acetic acid, and samples were placed into vessels of the automated dye machine. The dye bath was brought up to 100mL with water so that the fabric was submerged. Samples were heated to
93C, held there for 30 mins, and then cooled off to room temperature. Samples were rinsed
3.3.1 Color and Surface Properties
The difference in lengths between samples appears to have increased during the dyeing process, so that some are much shorter than others. Also, some samples hold wrinkles more than others.
Color was assessed using the average of four measurements with the X-Rite Color spectrophotometer with the settings P/F equal to 1, Margin of 0.1 and l:c of 2. Samples were folded in half twice so that they appeared opaque to the spectrophotometer.
3.3.1.1 Monocomponent
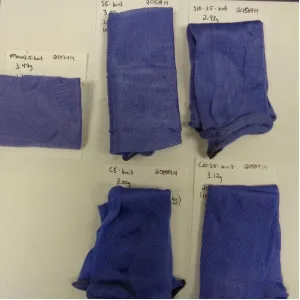
Briefly, the dyed samples were visually assessed, noting that the PP without additive appears purple (Figure 8).
Figure 8: Photograph of dyed samples progressing from low to high additive concentration from left to right. Fluorescent lighting and white paper background with 2% o.w.f. Dianix Blue AC-E.
Table 2: Comparison by concentration of additive for monocomponent. Standard was the PP with no additive. The Tolerances were 2.15 for DL*, 1.25 for Da* and 1.25 for Db*.
Additive Conc. DEcmc DL* Da* Db*
1% 11.91 -13.99 D -4.82 G -12.14 B
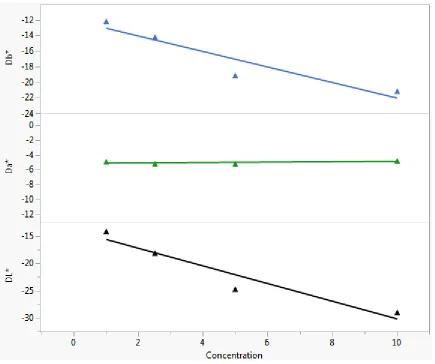
2.5% 13.96 -18.05 D -5.12 G -14.18 B
5% 17.95 -24.57 D -5.13 G -19.07 B
10% 19.92 -28.96 D -4.72 G -21.14 B
Figure 10: Linear fit of Db* by Concentration of EZ Dye Additive using JMP. R-square is 0.888169. Slope is -0.9989558 and y-intercept is -12.01233. (SAS Institute Inc, 1989-2007)
3.3.1.2 Bicomponent
Visually, there are differences between the core, sheath, and mono distributions of dyed PP filaments (Figure 12, Figure 13). The bicomponent fibers were compared to monocomponent fibers with the same concentration (Table 3, Table 4).
Figure 13: Total EZ Dye additive concentration of 5%. Top right is sheath. Middle left is mono. Bottom right is core. 2% o.w.f. Dianix Blue AC-E.
Table 3: Comparison of 2.5% overall concentration with different distributions. The standard was the monocomponent material with 2.5% additive. Tolerances were 1.80 for DL*,1.20 for Da* and 1.65 for Db*.
Name L* a* b* DEcmc DL* Da* Db*
S5 42.55 8.25 -29.65 1.12 -0.73 D -1.08 G -0.69 B
S10-25 40.5 8.36 -29.26 1.63 -2.78 D -0.97 G -0.29 B
C5 41.08 9.66 -33.06 2.38 -2.19 D 0.32 R -4.10 B
C10-25 42.3 10.19 -32.91 2.07 -0.98 D 0.85 R -3.95 B
For 5% total additive concentration, the sheath distribution was within the tolerance for lightness and Db*, it was greener than the standard by more than the tolerance. The core distribution difference values were all more than the tolerance. The fiber with 10% additive concentration in the core would be perceived as darker, redder and bluer than the standard.
Table 4: Comparison of 5% overall concentration with different distributions. The standard was the monocomponent material with 5% additive. The tolerances were 1.60 for DL*, 1.25 for Da* and 1.80 for Db*.
Name L* a* b* DEcmc DL* Da* Db*
S10-50 36.69 7.67 -32.38 1.31 -0.06 D -1.66 G 1.48 Y
C10-50 34.52 11.05 -36.22 1.93 -2.23 D 1.73 R -2.36 B
The core distribution appears slightly bluer and redder in the computer generated rendering of the three samples (Figure 14).
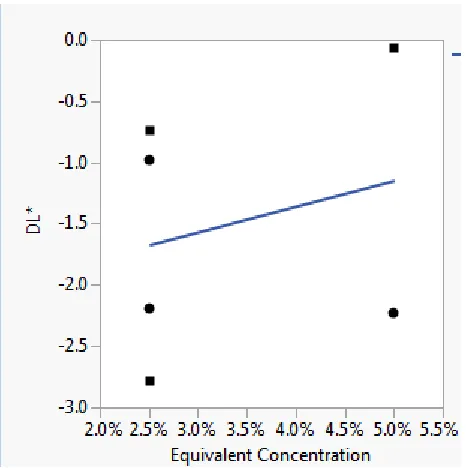
Graphically, the core distributions have a more negative Db* and DL* than the sheath distributions relative to the monocomponent with the same total concentration of additive (Figure 15, Figure 16). Although, the blueness and lightness are decreasing with increasing concentration of additive in the bicomponent fibers. This is likely a result of the
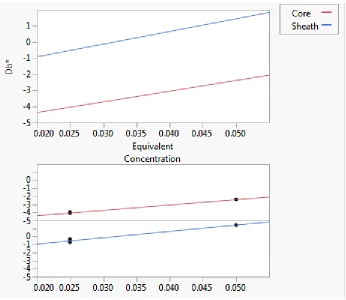
monocomponent filaments becoming darker and bluer with increasing concentration more so than the bicomonponent filaments. Statistically, this change in bicomponent blueness relative to monocomponent filaments is linear (Figure 17).
Figure 17: Linear fit of difference in blue versus concentration. R-square is 0.9962548. Core has a slope of 66.6 and a y-intercept of -5.69. Sheath has a slope of 78.8 and a y-y-intercept of -2.46. Note that the concentrations are given as decimals
instead of %. (SAS Institute Inc, 1989-2007)
3.4 Analysis of Tensile Properties of Filaments
3.4.1 Linear Density
1989-2007). The core fibers decreased in linear density with increasing additive (JMP linear fit R-square is 0.997813, y-intercept is 4.33 and slope is -0.074) (SAS Institute Inc, 1989-2007).
Table 5: Summary of results from Vibromat.
Sample ID CV LD (den) Min Max
Mono1 14 3.68 3.011 4.533
Mono2.5 20 4.05 2.761 5.188
Mono5 11 4.08 3.178 4.646
Mono10 14 4.21 3.376 5.251
S5 13 3.44 2.591 4.068
S10-50 11 4.43 3.81 5.277
S10-25 13 3.86 3.092 4.586
C5 12 4.14 3.197 4.794
C10-50 9 3.96 3.296 4.531
C10-25 18 4.15 3.346 5.54
PP 19 4.87 3.58 6.547
3.4.2 Tensile Properties
3.4.2.1 Monocomponent Filaments
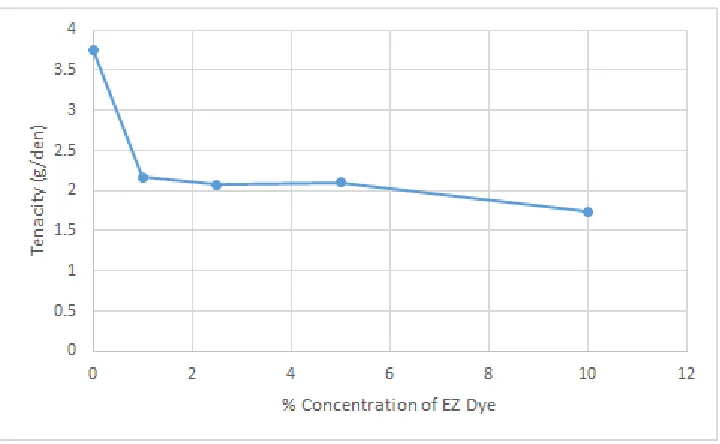
The tenacity of the mono-component filaments ranged from 1.74 g/den to 3.76g/den and decreased with increasing concentration of EZ Dye additive in agreement with literature. The filaments with 5% EZ Dye additive exhibited a slightly higher tenacity than 2.5% EZ Dye (2.1 g/den versus 2.07 g/den respectively) which may have been a result of variations within the small sample size.
Figure 18: Tenacity of filaments with increasing concentration of EZ-Dye additive.
Figure 19: Elongation at break with increasing concentration of EZ Dye.
Figure 20: PP Stress Strain Curve
Figure 21: PP with 1% EZ Dye additive.
Figure 22: PP with 2.5% EZ Dye additive.
Figure 24: PP with 10% EZ Dye additive.
3.4.2.2 Bicomponent Filaments
Figure 25: Tenacity for EZ Dye concentration of 2.5% and 5% overall.
Figure 26: Elongation at Break for EZ Dye concentration of 2.5% and 5% overall.
Figure 27: S5
Figure 28: S10-25
Figure 29: C5
Figure 30: C10-25
Figure 31: Sheath 10% (5% total).
Figure 32: Core 10% (5% total).
3.5 Analysis of the Thermal Properties: DSC
DSC was performed on 5-10 g of sample in the NWI Analytics Laboratory using a
20C (green) and then heated again to 180C (red). The onset temperature for crystallization
and enthalpy for each sample was determined using the TRIOS software. The theoretical PP enthalpy is 8700 J/mol (Blaine), the molecular weight of the PP monomer is 42g/mol, giving a PP heat of fusion of about 207.14 J/g. Crystallinity was determined with the following
equation: % 𝐶𝑟𝑦𝑠𝑡𝑎𝑙𝑙𝑖𝑛𝑖𝑡𝑦 =𝐸𝑛𝑡ℎ𝑎𝑙𝑝𝑦(𝑠𝑎𝑚𝑝𝑙𝑒)
𝐸𝑛𝑡ℎ𝑎𝑙𝑝𝑦 (𝑃𝑃) ∗ 100. (3)
This method assumed a low enough concentration of the additive so that the presence of nylon would not change the theoretical heat of fusion.
3.5.1 Monocomponent
The graphs for PP and PP with additive are included below Figure 33,Figure 34, Figure 35, Figure 36, Figure 37. PP was not included in the crystallinity graph due to the unusual shape of the melting curve.
Figure 34: PP with 1% EZ-Dye additive.
Figure 36: PP with 5% EZ-Dye additive.
Figure 37: PP with 10% EZ Dye Additive.
The percent crystallinity for the monocomponent filaments did not change significantly; it ranged from about 35.4% to 37.6% (Figure 38). However, the onset
y-intercept equal to 127.64554 (JMP). Thus for zero additive concentration, the expected onset
temperature would be about 1C more than what was measured for PP.
Figure 38: Percent Crystallinity as a function of concentration. (SAS Institute Inc, 1989-2007)
3.5.2 Bicomponent
The graphs for bicomponent PP and PP with additive are included below (Figure 40, Figure 41, Figure 42, Figure 43, Figure 44, Figure 45).
Figure 40: 5% EZ-Dye additive in core for a total additive concentration of 2.5%.
Figure 42: 10% EZ-Dye additive in core for a total additive concentration of 5%.
Figure 44:10% EZ-Dye additive in sheath occupying 25% of fiber cross section for a total additive concentration of 2.5%.
Figure 45: 10% EZ-Dye additive in sheath for a total additive concentration of 5%.
reveals an R-square value of 0.992471 with the slope equal to 0.8432 and the y-intercept equal to 129.423 (JMP). So, if this trend were continued to zero concentration of additive, the
onset temperature would be expected to be around 129C, which is about 3C higher than
was found.
Figure 47: Crystallization onset temperature over total EZ-Dye additive concentration. Core (circle). Sheath (square). (SAS Institute Inc, 1989-2007)
3.6 Conclusions
As a result of tensile testing and disperse dye trials, the following conclusions can be made: ● All samples with additive were high and low energy disperse dyeable.
● Low Energy Disperse Dye: Filaments with additive distributed in core were bluer
than monocomponent filaments with same concentration of additive. ● Tenacity decreases with increasing EZ Dye concentration.
● Elongation at break increases with increasing EZ Dye concentration. ● Distributions with EZ Dye in the core tend to exhibit higher tenacity.
● Distributions with EZ Dye in the sheath tend to exhibit higher elongation at break and
● A human may perceive the core distributions to be bluer than both the standard and
sheath distributions.
● Onset temperature of crystallization increased with additive concentration for
monocomponent and bicomponent fibers, although the percent crystallinity did not appear to be impacted by the additive concentration.
● Sheath/Core with 5% total filament EZ Dye concentration exhibited darker color than
filaments with the entire filament at 5% EZ Dye. These filaments had higher tenacity than the monocomponent. The elongation at break was slightly higher for sheath filaments than monocomponent, but lower for core filaments than monocomponent. ● Sheath/Core filaments with 2.5% total filament EZ Dye exhibited similar dyeability
to filaments with the entire filament at 5% EZ Dye. Sheath/Core filaments had higher tenacity and elongation at break than the monocomponent.
3.7 Future Research
Molecular Dynamics Simulations
Simulating the additive’s interactions with dye molecules could reveal how the additive is
improving the dyeability of PP, potentially leading to improvements in the additive itself.
Optical microscope assessment of dye penetration depth
Quantifying the distance dye molecules penetrate into the filament and the proportion of dye in the filament cross section could provide more information on why bicomponent filaments exhibit darker colors than monocomponent filaments. Does the darker hue come from a higher absorption of dye molecules?
Analysis of optical properties of sheath/core filaments
4. Experimental: Printability of EZ Dye PP spunbond fabric
4.1 Sample Preparation
EZ Dye Masterbatch additive was added by weight percent to PP pellets, Braskem PP CP360H, and mixed in a cement mixer. Spunbond fabrics were made on a Hills-Nordson
spunbond line at 0.6 GHM and 240C (Figure 48). The fabrics were 150gsm. Samples were
hydroentangled with a standard or double row jet strip (see discussion in section 2.2.1 Web Bonding: Surface Textures).
Figure 48: Spunbond Continuous Process
4.2 Screen Printing Trial with Low Energy Disperse Dye
Print Paste was composed of dye, water, acetic acid and thickener, Lyoprint PTU an acrylic acid polymer, and was combined with a standing mixer, about 30 min on medium speed (Table 6). There were some errors in measurements so that additional water and dye were added of not more than 1g each, since all samples were printed with the same print paste, this was assumed to not impact color or print differences. Paste viscosity was not measured, but was about 35,000 cP.
Samples were cut from rolls to fit the screen printing station, 23” to 24” square. A screen with three strips of varying widths was used, two with large widths and one with a
Rolled up Dried
Hydroentangled Laid down on
small width. The paste was pressed into the screen and onto the material using a squeegee that was narrow enough to print one line at a time. Samples were dried on a Precision Screen Machine conveyor belt at 130oC after printing, steam set in an Arioli Steamer with a 2 min dwell time, cut in half and then washed in cold water until the water ran colorless.
Table 6: Print Paste Recipe
Item Amount
Lyoprint PTU 20 g
Water 480 mL (actually used about 500 mL)
Dianix Blue AC-E dye 1g
Acetic Acid 3 drops
4.2.1 Analysis of Printing Trial: Monocomponent
Samples were observed to change color as a result of different stages in screen printing including steaming and drying.
The control samples (neat PP) appeared redder than the EZ dye samples, i.e. more purple like what was seen for the low energy disperse dye trial on filaments.
The Operator bounced the screen resulting in uneven print lines (dots at the edges of each printed line). This error was not seen on all samples because the operator corrected the procedure to reduce screen bouncing. As a result of this the line thicknesses were not measured.
Figure 49: Lightly bonded samples. Concentration of additive, from left to right, was 0%, 2.5%, and 5%.Screen printed with Dianix Blue AC-E print paste.
Figure 51: Double row jet strip hydroentangled samples. Concentration of additive, from left to right, was 0%, 2.5%, and 5%. Screen printed with Dianix Blue AC-E print paste.
CIELab color analysis was performed using four random sample areas on the smallest printed line width. Samples were folded so that four layers of fabric were between the device reader and the clamp, i.e. so that the samples appeared opaque. The stain and unprinted areas were analyzed be folding the area double. The unprinted areas were measured from the not rinsed half of the fabric.
Figure 52: White unprinted areas on PP after screenprinting with Dianix AC-E.
Figure 53: Staining on PP after screenprinting with Dianix AC-E.
The impact of concentration was determined by comparing to the printed control with the same bonding (Table 7, Table 8, Table 9).
For all bonding levels, increasing the concentration of EZ Dye additive increased the change in color (DEcmc), darkness (negative DL*), greenness (negative Da*), and blueness (negative Db*) relative to the control. Whether the differences between the two
concentrations (2.5% compared to 5%) would be perceptible is not determinable from this data.
Table 7: Comparison of lightly bonded samples for increasing additive concentration.
Name DEcmc DL* Da* Db*
2.5% additive 11.52 -8.92 -6.27 -12.51
5% additive 13.45 -10.83 -6.59 -12.53
Table 8: Comparison of single row hydro samples for increasing additive concentration.
Name DEcmc DL* Da* Db*
2.5% additive 11.26 -11.58 -4.59 -12.59
5% additive 12.66 -12.79 -5.44 -14.13
Tolerance NA 2.25 1.10 1.30
Table 9: Comparison of double row hydro samples for increasing additive concentration.
Name DEcmc DL* Da* Db*
2.5% additive 13.56 -10.66 -5.67 -15.66
5% additive 14.65 -13.60 -5.94 -16.71
Tolerances NA 2.25 1.10 1.25
The impact of bonding was determined by comparing to the lightly bonded printed sample with the same EZ Dye additive concentration.
For 2.5% EZ Dye additive concentration the change in color increased for both types of bonding from the lightly bonded standard, although the increase was higher for single row (Table 10). None of the changes in color values were significant since they were all less than the tolerance.
Table 10: Compare by hydro bonding jet strip type: Standard was 2.5% concentration monocomponent fibers lightly bonded printed samples.
Jet Strip Type DEcmc DL* Da* Db*
Single 0.73 0.07 0.65 0.81
Double 0.65 0.56 -0.09 -1.19
For 5% EZ Dye additive concentration the change in color increased for both types of bonding from the lightly bonded standard, although the increase was higher for single row (Table 11). Only the change in yellowness (positive Db*) for the single row jet strip hydroentangled fabric was higher than tolerance; i.e. it would appear yellower than the standard.
Table 11: Compare by hydro bonding jet strip type: Standard was 5% concentration monocomponent fibers lightly bonded printed samples.
Jet Strip Type DEcmc DL* Da* Db*
Single Row 1.15 0.75 0.12 2.29
Double Row 0.42 -0.48 -0.04 0.79
Tolerances (+/-) 2.00 1.15 1.85
Figure 54: Change in Blue from printed PP (no additive) versus concentration. Double (triangle). Single (square). (SAS Institute Inc, 1989-2007)
4.2.2 Analysis of Printing Trial: Bicomponent
During the screen-printing, the operator bounced the screen on the fabric, creating uneven surface features, i.e. the printed lines were blurry. As a result, only the color differences could be compared.
4.2.2.1 Color Assessment
The sheath (5% additive concentration) samples were compared to the
monocomponent with 2.5% and the same bonding (Figure 55, Figure 56)(Table 12). For both types of bonding, single row and double row, the change in color increased for the sheath configuration. This increase was smaller for the single row jet strip. The single row
Figure 56: Double row jet strip bonded samples, mono (left) and sheath (right), with same concentration of EZ Dye additive. Screen printed with Dianix Blue AC-E print paste.
Table 12: Sheath distributed EZ-Dye additive compared to 2.5% additive in monocomponent distribution with the same bonding.
Type of Bonding DEcmc DL* DL* tol Da* Da* tol Db* Db* tol
Single Row 0.78 1.75 2.05 -0.15 1.10 -0.28 1.70
Figure 57: Change in blue and lightness for bicomponent. Double (triangle). Single (square). (SAS Institute Inc, 1989-2007)
5.3 Preliminary Assessment of Acid Dyeability
The highest concentration EZ Dye PP (5%) and neat PP were dyed with acid dye using the same dye procedure as for low energy disperse dyes. 2% o.w.f. Telon Blue AGLF (Acid Blue 287) dye with a 1:1 Liquor ratio in water (g:L) was used with extra water added to submerge the samples and four drops of acetic acid to lower the pH. Each sample was sealed in a vessel. Samples were heated to 100C, held there for 30 mins, and then cooled off
to room temperature. Samples were rinsed in cool water until the run-off was clear.
5.3.1 Color assessment: CIE Lab
The effluent was a royal blue color. The EZ-dye PP appeared slightly darker than neat PP. Both appear light, pale blue (light and low saturation).