20th International Conference on Structural Mechanics in Reactor Technology (SMiRT 20) Espoo, Finland, August 9-14, 2009 SMiRT 20-Division V, Paper 1875
Experimental Study on Modal Identification
and Dynamic Amplification of a Steel Frame Structure
Sung Gook Cho
a, Yang Hee Joe
b, Seong Taeg Kim
c, Sang-Kook Lee
d, and Gi Sung Pang
e aDept. of R&D, JACE Korea, Gyeonggi, Korea, e-mail: [email protected] b
Dept. of Civil and Environmental Engineering, University of Incheon, Incheon, Korea c
Korea Hydro & Nuclear Power Company, Seoul, Korea d
Korea Institute of Nuclear Safety, Taejon, Korea e
Korea Institute of Energy Technology Evaluation and Planning, Seoul, Korea
Keywords: Modal Identification, Impact Hammer, Shaking Table, Dynamic Amplification, Seismic Qualification
1
ABSTRACT
Seismic qualification of equipment requires modal identification. Modal identification can be performed by a test and/or an analysis. In this study, a steel frame specimen with 1-bay and 3-stories has been fabricated and analyzed by the dynamic tests and analyses. This paper presents the modal parameters of the steel frame model which were identified by the impact hammer tests. The natural frequencies of the model were also computed by the analysis. The shaking table tests were performed for comparative study of the modal parameter identification and for analysis of the dynamic amplification of the model. The results of the detailed finite element analyses of the frame model were verified by comparing those from shaking table tests.
The results of the modal analysis show good agreement with those of the modal tests. The modal properties obtained from the impact hammer test are practically equal to those of shaking table test. And the finite element model can be effectively updated thru the stiffness modification based on the modal test results. Dynamic amplifications of the structure subjected to the El Centro earthquakes obtained by experimentally and numerically show good agreement each other. The results of the study imply that the impact hammer test can be applied to modal identification of simple equipment installed in operating nuclear power plant.
2
INTRODUCTION
Electrical equipment in nuclear power plants are seismically qualified by shaking table tests in normal case. However, the shaking table test cannot be used for the equipment that has already been installed in operating plants since they cannot be moved from the plants to mount on a test facility. In this case, a different seismic qualification method such as analysis or combination of analysis and test is required. In addition, if complex equipment is to be seismically qualified by an analysis, modal identification test is needed to reasonably consider the dynamic characteristics to the analytical model. In most cases, the dynamic properties of an electrical cabinet are calculated from an analysis using finite element method. In some cases, experimental data obtained from either an in-situ modal testing or the shaking table testing are also used to estimate the dynamic properties of the cabinet.
In-situ testing can be performed for the safety-related equipment located in operating nuclear power plants. As an example, modal testing can be performed for an electrical cabinet in the field to obtain its modal properties from which the in-cabinet response spectra may be calculated. This is a cost-effective alternative compared to de-energizing and moving out the equipment to a laboratory for a full level of shaking table test. So far, the shaking table test rather than the impact hammer test has been preferably selected to identify the dynamic characteristics of the structure. However, the impact hammer test has many advantages in its economical and easy application.
The generic amplification factors in EPRI report (EPRI, 1990) have been used to resolve USI A-46 for the older operating nuclear power plants. However, they are typically very conservative, and tend to give unrealistic spectra usually in significantly conservative side, and have resulted in some safety-related equipment being outliers in the USI A-46 application. One of the methods to resolve such outliers is to perform an in-situ modal testing to determine equipment-specific modal properties and to calculate the equipment specific amplification factors at the device mounting location. Alternatively, the in-situ modal testing can be used to validate a finite element model of the equipment.
Specifically complex equipment with small devices inside is not easy to be mathematically modelled. For this reason, the testing method is preferably selected for seismic qualification of the equipment. In the course of seismic qualification test program, a modal identification test for the dynamic characteristics of the equipment, usually called exploratory test, is performed prior to the main seismic proof tests to get useful information for the determination of the best method and interpretation of results of qualification tests. The modal identification test is also frequently used for the verification of analytical models used in seismic qualification by analysis.
In this study, the modal parameters of a steel frame structure were identified by impact hammer tests. The shaking table tests were also performed to comparatively study the modal parameter identification and the dynamic amplification of the model. The shaking table tests were conducted by using harmonic motions and a real earthquake motion. This paper introduces the frame model, experimental setup, and test methods and process. The dynamic characteristics and responses of the frame structure are discussed on this paper. The results of the finite element analyses are verified by comparing with the corresponding results from shaking table testing of the frame model
3
EXPERIMENTAL PROGRAMS
3.1 General
For this study, three dynamic experimental programs have been established and a steel frame specimen with 1-bay and 3-stories were fabricated. The first program is impact hammer tests, which were designed to identify the dynamic characteristics of the specimen. The second and third programs were performed by shaking table tests by using sine swept harmonic motion with varying frequencies, and the El Centro earthquake motion, respectively. The sine swept harmonic motion test was planned to verify the modal identification results obtained from impact hammer test. The earthquake motion test is to evaluate the dynamic amplification due to base excitation. All tests are performed only in the horizontal direction along the longitudinal axis of the structure.
3.2 Experimental Set-up
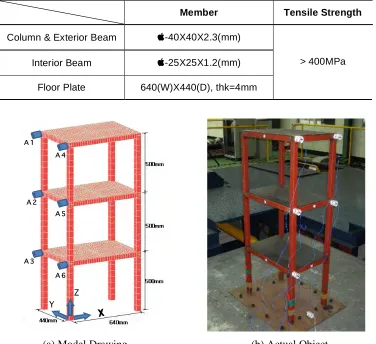
A three-story test frame structure was constructed as a test specimen. The structure is 1500mm tall, 640mm wide and 440mm deep. The structure weighs 77.0kg including the base plate which was affixed with bolts to the shaking table or reaction test frame. The pure structural weight excluding the base plate is 56.4kg. This structure was assembled with the elements shown in Table 1 by welding. The major members of the model are floor beams, slab plates and columns. The additional beams are stiffened under the slab plate. The members are rectangular steel pipes. The material of all members is SS400 carbon steel (ASTM A36) as rolled steel for general structures. The calculated weight of the specimen using standard weight density of the steel and dimensions coincides with the measured weight. The experimental set-up configuration is shown in Figure 1.
Member Tensile Strength
Column & Exterior Beam -40X40X2.3(mm)
Interior Beam -25X25X1.2(mm)
Floor Plate 640(W)X440(D), thk=4mm
> 400MPa
Y Z
A 4
A 5
A 6 A 1
A 2
A 3
(a) Model Drawing (b) Actual Object
Figure 1. Configuration and Instrumentation of Test Specimen
Six PCB 393B04 accelerometers having the sensitivity of 1000mV/g were attached at the corner of each floor to measure the acceleration responses of the structure subjected to impulse loadings. During shaking table testing, one accelerometer (A6) was moved on the shaking table to measure the table motions. This instrument can measure the frequency range of 0.06~450Hz. Impulse loadings were produced by a 3 pounds (1.36kg) impact hammer (DYTRAN 5802A model). The shaking table system was a 6-degrees-of-freedom exciting system of the Korea Electric Power Research Institute. The shaking table has the capacity of maximum loading of about 20kN, and maximum exciting acceleration of 6.0g at the frequency range of 1 ~ 60 Hz. A dynamic signal analyzer (OROS OR38 Model) was used to acquire the impulse, excitation, and response signals.
In the experimental tests, the impulse loading was applied to the x-direction at the middle of each floor and the shaking table also excited to the x-direction. The reference coordinate system of the model is illustrated in Figure 1(a). The x-directional acceleration responses were measured.
4
MODAL IDENTIFICATION
4.1 Modal Parameter Extraction Procedure
The dynamic system can be expressed by the transfer function as shown in equation (1).
)
(
)
(
)
(
s
H
s
F
s
X
=
(1)Where,
X
(
s
)
: Response in Laplace domain
H
(
s
)
: Transfer function in Laplace domains=
"
+i!
: Laplace variable!
: Modal damping!
: Modal frequencyThe transfer function for k-th mode can be written in terms of modal parameters as shown in equation (2) (Park, 1999).
) ( 2 ) ( 2 )
( *
*
k k
k k k
p s i
r p
s i
r s
H
!
+
!
= (2)
Where, p: Complex pole of modal property
r
: Modal complex residue* : Complex conjugate pair
In the actual modal test, only the values on the imaginary axis in the form of a frequency response function, rather than the total transfer function, were obtained. The first term and second term of the right-hand side of equation (2) represent positive and negative functions respectively and are symmetric. Thus, by selecting the positive term only and substituting s=
"
k +i!
k into equation (2), the transfer function can be reduced as equation (3).)
(
2
)
(
k k k
p
i
i
r
i
H
!
=
"
"
(3)The polynomial curve fitting algorithm is used to identify the modal properties from the test records. The transfer function is rearranged as equation (4) in a least squares curve-fitting technique.
)
(
2
)
(
1
0
)
2
(
)
(
)
(
22 2 1 2 2 2!
!
!
"
!
!
"
!
!
"
!
+
+
+
#
+
#
+
+
+
=
A
A
i
A
i
ir
r
r
i
H
k k
k
k k k k k
k (4)
Where, A0, A1, A2: Residual function coefficients
4.2 Modal Identification by Test
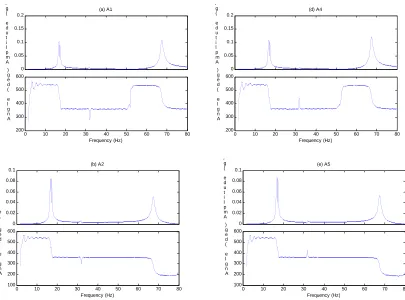
The transfer functions at the roof and 3rd floors with respect to the impact forces applied to the left corner and the centre of the roof are shown in Figure 2 and 3, respectively. The transfer functions at the various locations are similar in shape. By comparison of Figure 2 and 3, it is found that the torsional mode cannot be extracted when the impact force is applied to the centre of the model.
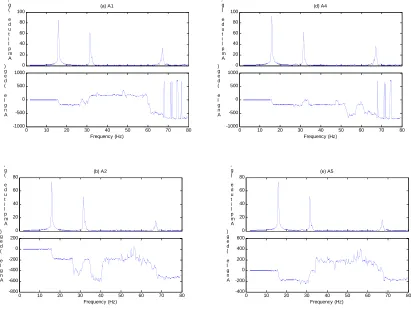
Figure 4 shows the transfer functions obtained from the shaking table test exciting by sine sweep motion. This study used the logarithmic sine sweep having the sweeping rate of 2 octaves per minutes varying from 2Hz to 32Hz and the amplitude of 0.1g. The locations of peaks of transfer functions obtained from the impulse test shows good agreement with those obtained from the sine sweep test.
0 0.05 0.1 0.15 0.2 (a) A1 A m p l i t u d e ( g / N )
0 10 20 30 40 50 60 70 80
300 400 500 600 Frequency (Hz) A n g l e ( d e g ) 0 0.05 0.1 0.15 0.2 (d) A4 A m p l i t u d e ( g / N )
0 10 20 30 40 50 60 70 80
-200 0 200 400 600 Frequency (Hz) A n g l e ( d e g ) 0 0.05 0.1 0.15 0.2 (b) A2 A m p l i t u d e ( g / N )
0 10 20 30 40 50 60 70 80
100 200 300 400 500 600 Frequency (Hz) A n g l e ( d e g ) 0 0.05 0.1 0.15 0.2 (e) A5 A m p l i t u d e ( g / N )
0 10 20 30 40 50 60 70 80
100 200 300 400 500 600 Frequency (Hz) A n g l e ( d e g )
Figure 2. Transfer Functions Measured from Top-left Corner Impulse Test
0 0.05 0.1 0.15 0.2 (a) A1 A m p l i t u d e ( g / N )
0 10 20 30 40 50 60 70 80
200 300 400 500 600 Frequency (Hz) A n g l e ( d e g ) 0 0.05 0.1 0.15 0.2 (d) A4 A m p l i t u d e ( g / N )
0 10 20 30 40 50 60 70 80
200 300 400 500 600 Frequency (Hz) A n g l e ( d e g ) 0 0.02 0.04 0.06 0.08 0.1 (b) A2 A m p l i t u d e ( g / N )
0 10 20 30 40 50 60 70 80
100 200 300 400 500 600 Frequency (Hz) A n g l e ( d e g ) 0 0.02 0.04 0.06 0.08 0.1 (e) A5 A m p l i t u d e ( g / N )
0 10 20 30 40 50 60 70 80
100 200 300 400 500 600 Frequency (Hz) A n g l e ( d e g )
0 20 40 60 80 100 (a) A1 A m p l i t u d e ( g / N )
0 10 20 30 40 50 60 70 80
-1000 -500 0 500 1000 Frequency (Hz) A n g l e ( d e g ) 0 20 40 60 80 100 (d) A4 A m p l i t u d e ( g / N )
0 10 20 30 40 50 60 70 80
-1000 -500 0 500 1000 Frequency (Hz) A n g l e ( d e g ) 0 20 40 60 80 (b) A2 A m p l i t u d e ( g / N )
0 10 20 30 40 50 60 70 80
-800 -600 -400 -200 0 200 Frequency (Hz) A n g l e ( d e g ) 0 20 40 60 80 (e) A5 A m p l i t u d e ( g / N )
0 10 20 30 40 50 60 70 80
-400 -200 0 200 400 600 Frequency (Hz) A n g l e ( d e g )
Figure 4. Transfer Functions Measured from Sine Sweep Test
(a) Left-top Corner (b) Right-Top Corner
Figure 5. Transfer Functions Measured from Sine Sweep Test
Table 2. Structural Members of the Test Specimen.
Frequency Mode
Impact Test Sine Sweep Difference (%)
Damping
1st Mode 16.62 Hz 15.92 Hz 4% 0.96 %
4.3 Modal Identification by Analysis
For comparison with the test results, the modal analysis of the specimen was performed through state-of-the-art modelling and analysis technique. The analytical model was constructed by using general beam elements and plate elements representing beams, columns and floor plates. The structure was assumed to have hinge supports at the base of each column. The weight density and the elastic modulus of the material are originally 7850 kg/cm3 and 200GPA respectively. The modal analysis was performed using the computer program SAP2000 (Computers and Structures, Inc., 2000). This original model was updated through modifying the weight density and the elastic modulus to adjust the measured weight and the fundamental frequency obtained from testing. Table 2 shows the material properties and the natural frequencies of the models. By multiplying 0.97 to the original weight density, the total weight of the updated model equals to the measured weight. Then, the original elastic modulus is reduced by a factor of 0.875 to match the fundamental frequency with the value identified by test.
Table 2. Structural Members of the Test Specimen.
Original Model Updated Model
Weight Density 7850 kg/cm3 7639 kg/cm3
Static Reaction 57.96 kg 56.4 kg
Elastic Modulus 200 GPa 175 GPa
1st Mode 17.52 Hz 16.62 Hz
Frequency (Hz)
2nd Mode 23.89 Hz 22.66 Hz
5
EARTHQUAKE RESPONSE
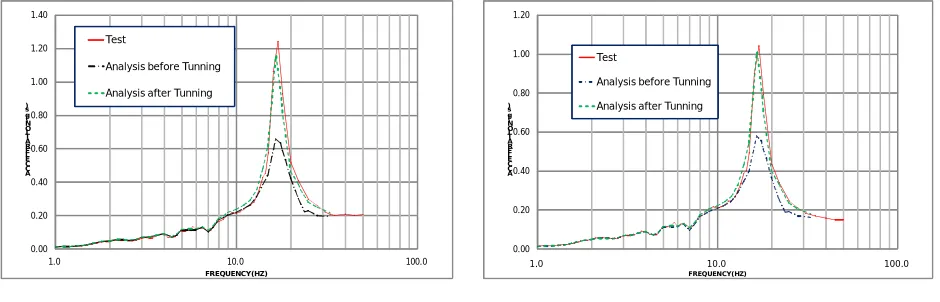
Dynamic analyses using SAP2000 program were performed to investigate the dynamic amplification of the two models: original model and tuned model. The time history analysis using mode superposition method was employed. The proportional modal dampings obtained by the modal identification were considered in analyses. The base motion is the acceleration time history measured at the shaking table during El Centro earthquake test. Figure 7 compares the floor response spectra at the top and 3rd floors, which were computed from the acceleration responses obtained by the analyses and measured from the test. Analysis for the original model produces low peak spectral acceleration, while Analysis results for the tuned model shows good agreement with the test results.
0.00 0.20 0.40 0.60 0.80 1.00 1.20 1.40
1.0 10.0 100.0 A
C C E L E R A T IO N (g 's )
FREQUENCY(HZ)
Test
Analysis before Tunning
Analysis after Tunning
0.00 0.20 0.40 0.60 0.80 1.00 1.20
1.0 10.0 100.0 A
C C E L E R A T IO N (g 's )
FREQUENCY(HZ) Test
Analysis before Tunning
Analysis after Tunning
(a) Top Floor (b) 3rd Floor
6
CONCLUSION
The modal parameters of a steel frame structure with 3-stories are satisfactorily identified from the measurement data of impact hammer test and shaking table test. The modal properties extracted from the measurements of the impact test are good agreement with those identified with the data obtained from shaking table test. It implies that the impact hammer test can be cost-effectively and easily applied to estimate the modal properties of equipment located in operating plants. Analysis using the modified analytical model by adjusting the stiffness and the total weight in accordance with the fundamental modal frequency identified by the impact hammer test yields more close results to the recorded response from the shaking table test.
Acknowledgements. This research was accomplished as part of the project, Development of Electronic Power Industry Researches, which was sponsored by the Ministry of Knowledge Economy (MKE) in Korea. The authors express their appreciation for the financial support.
REFERENCES
EPRI, 1990. Guidelines for Development of In-Cabinet Amplified Response Spectra for Electrical Benchboards and Panels. Electric Power Research Institute (EPRI), Palo Alto, CA. EPRI NP-7146. Research Project 2925-8.
Park, H.G., Joe, Y.H., Cho, S.G., 1999. Experimental Study on Modal Properties of ASME Globe Valve for Nuclear Power Plant. 15th International Conference on SmiRT. Paper No. K3-A4-KR. Seoul, Korea, Aug. 1999.
Spectral Dynamics, Inc. 1999. STAR User’s Guide.