Electronic Theses and Dissertations Theses, Dissertations, and Major Papers
5-8-2018
Physiological Effects of Adding a Percentage of Body Weight
Physiological Effects of Adding a Percentage of Body Weight
During a 7 Week Stair Climbing Sprint Interval Training Program
During a 7 Week Stair Climbing Sprint Interval Training Program
Remi Anthony Sovran University of Windsor
Follow this and additional works at: https://scholar.uwindsor.ca/etd
Recommended Citation Recommended Citation
Sovran, Remi Anthony, "Physiological Effects of Adding a Percentage of Body Weight During a 7 Week Stair Climbing Sprint Interval Training Program" (2018). Electronic Theses and Dissertations. 7453. https://scholar.uwindsor.ca/etd/7453
This online database contains the full-text of PhD dissertations and Masters’ theses of University of Windsor students from 1954 forward. These documents are made available for personal study and research purposes only, in accordance with the Canadian Copyright Act and the Creative Commons license—CC BY-NC-ND (Attribution, Non-Commercial, No Derivative Works). Under this license, works must always be attributed to the copyright holder (original author), cannot be used for any commercial purposes, and may not be altered. Any other use would require the permission of the copyright holder. Students may inquire about withdrawing their dissertation and/or thesis from this database. For additional inquiries, please contact the repository administrator via email
During a 7 Week Stair Climbing Sprint Interval Training Program
by
Remi Sovran
A Thesis
Submitted to the Faculty of Graduate Studies through the Department of Kinesiology in Partial Fulfillment of the Requirements for
the Degree of Master of Human Kinetics at the University of Windsor
Windsor, Ontario, Canada
2018
by
Remi Anthony Sovran
APPROVED BY:
______________________________________________ R. Carriveau
Department of Civil and Environmental Engineering
______________________________________________
K.J. Milne
Department of Kinesiology
______________________________________________ K.A. Kenno, Advisor
Department of Kinesiology
I hereby certify that I am the sole author of this thesis and that no part of this thesis has been published or submitted for publication.
I certify that, to the best of my knowledge, my thesis does not infringe upon anyone’s copyright nor violate any proprietary rights and that any ideas, techniques, quotations, or any other material from the work of other people included in my thesis, published or otherwise, are fully acknowledged in accordance with the standard referencing practices. Furthermore, to the extent that I have included copyrighted material that surpasses the bounds of fair dealing within the meaning of the Canada Copyright Act, I certify that I have obtained a written permission from the copyright owner(s) to include such material(s) in my thesis and have included copies of such copyright clearances to my appendix.
The purpose of this study was to determine the effect of adding a percentage of
bodyweight (BW) during a 7 week stair climbing (SC) sprint interval training (SIT)
program on maximal oxygen consumption, body composition, and lower body peak
power. Twenty-seven recreationally active males (22±2 yrs) were divided into 1 of 2
groups (non-weighted or weighted) and performed 4, 15 sec bouts of ‘all-out’ SC sprints
separated by 90 secs of rest, 3x/week, for 7 weeks. Non-weighted stair climbers
performed SC sprints without any additional load throughout the entire duration of the
study, and weighted stair climbers performed SC sprints with a progressive load of 10%
and 20% bodyweight (BW). After the first week of SC SIT, the weighted SC group
increased to 10% BW for weeks 2-4, and 20% BW for weeks 5-7. Lower body peak
power improvements were found after 4 and 7 weeks of SC SIT training, as well as
maximal oxygen consumption improvements after 7 weeks of SC SIT for both
non-weighted and non-weighted stair climbers with no significant differences between groups.
These improvements in lower body peak power and maximal oxygen consumption are
similar to previous SIT studies involving treadmills, cycle ergometers, and stair climbing.
Also, the results indicate that the addition of a progressive load (10-20% BW) as in a
weighted vest to SC SIT did not improve maximal oxygen consumption and lower body
peak power when compared to non-weighted SC SIT since no additional physiological
challenge (HR) was added with BW (10-20% BW) during SC SIT. Lastly, strength and
conditioning coaches or personal trainers need to be cautious about adding a weighted
vest to SC SIT since there is no added benefit in improving aerobic fitness or lower body
I would like to express my gratitude to my advisory committee, Dr. Rupp Carriveau, Dr.
Kevin Milne, and my direct advisor Dr. Kenji Kenno for all their assistance throughout
my thesis and graduate school experience. I would like to thank Don Clarke for his help
in setting up the lab and fixing any problems that managed to arise throughout the
duration of my study. I would also like to thank Professor Adriana Duquette for letting
me borrow her equipment and assist me through some of the obstacles that arose during
my study. Without her support, I would surely be lost, and would not have completed my
thesis in a timely manner.
As well, this study would not have been possible without the extensive support shown by
my 27 participants and the Kinesiology student volunteer who helped make the data
collection process efficient and effective. Without their participation, I would not have
been able to complete my thesis, and I cannot extend enough appreciation for their help.
I would also like to thank my family, friends, and colleagues for their on-going support
throughout the two and a half years of my Master's degree, and for making these years as
DECLARATION OF ORIGINALITY ...iii
ABSTRACT ... iv
ACKNOWLEDGEMENTS ... v
LIST OF TABLES ...viii
LIST OF FIGURES ... ix
LIST OF APPENDICES ... xi
LIST OF ABBREVIATIONS/SYMBOLS ... xii
INTRODUCTION ... 1
METHODS ... 10
Session 1: Documentation and Familiarization ... 10
Session 2: Baseline Testing Session ... 18
Stair Climbing SIT Sessions ... 27
Participant Confidentiality... 30
Sample Size ... 31
Statistics ... 31
RESULTS ... 32
Stair Climbing SIT Peak Heart Rate and Recovery Heart Rate Responses... 33
Stair Climbing SIT Rating of Perceived Exertion Responses ... 34
Stair Climbing SIT Stairs Climbed ... 36
Body Composition ... 38
BOD POD Analysis ... 38
Skeletal Muscle Power ... 39
Margaria Stair Climb ... 39
MVO2, Blood Lactate and Peak Heart Rate Data Collection ... 41
Blood Lactate and Peak Average Heart Rate Post MVO2 ... 41
Peak Average Heart Rate Post MVO2 ... 42
DISCUSSION... 45
CONCLUSION ... 52
LIMITATIONS ... 53
FUTURE RESEARCH ... 53
REFERENCES ... 55
APPENDICES ... 61
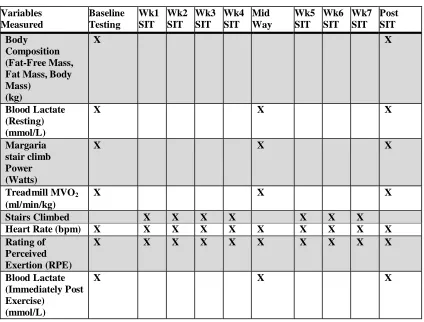
Table 1: The order of testing and data collection: “x” represented data collection points.
Baseline testing, during training wks 1-4, mid-way (testing after 4 wks of SC SIT), during the training wks 5-7, and post SC SIT. The first wk of SC SIT had all SC SIT groups using no load. During wks 2-4 SC weight for the Control group was 0%, and the 10/20% group added 10% of their bodyweight. The last 3 wks the Control group continued to use 0%, and the 10/20% Group added 20% of their body weight during SC SIT..…………....12 Table 2: The exercise protocol for wk 1 involved all three groups utilizing no weight to ensure that all groups became accustomed to SC SIT. The first wk of SC SIT involved all SC SIT groups using no load. During wks 2-4 SC SIT weight for the Control group was 0%BW, and the 10/20% group added 10% of their bodyweight. The last 3 wks the Control group continued to use 0%BW, and the 10/20% Group added 20% of their body
weight during SC SIT.……………….. ……….……...29
Table 3: The investigator recorded each participants SC SIT HR, RPE, stair number climbed and recovery HR during each session (1-21) in order to track physiological responses throughout the SC SIT study………...30
Table 4: Male Participant Characteristics……….32 Table 5: Summary of SC SIT body composition values pre and post SC training for
non-weighted and non-weighted participants………..………38
Table 6: Summary of average maximal treadmill MVO2, blood lactate concentrations and peak average heart rates values at 0 wks, after 4 wks of SC SIT and 7 wks of SC SIT for
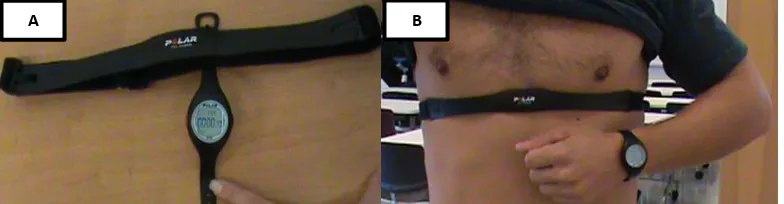
Figure 1: A was the Polar Heart Rate Monitor (Model E40) watch and the corresponding chest strap. B was the proper placement of the Polar Heart Rate Monitor chest strap. The chest strap rested below the nipples and was centered just below the sternum....13 Figure 2: A represented how the weighted vest was adjusted for each participant. Packets that weigh approximately 3 pounds were inserted or removed depending on the
individual’s body weight and which weight group they were in (10% or 10-20%). B represented how the weighted vest was worn by each participant. Participants placed their arms through the side of the vest and secured the front velcro strap in order to minimize vest movement during the SC SIT interval....15 Figure 3: Gymboss Interval Timer was pre-set to indicate the start and end of every work and rest period with a “beep”....15
Figure 4: Typical numbered staircase that the SC SIT sessions were performed on. The participant ran up the stairs as fast and as safe as possible using the handrail if
necessary for a total of 15 secs, which represented the completion of one work interval. The average step height and step width were 18.4cm and 28cm respectively as indicated by the arrows. Each step was numbered to give an indication to the participant and investigator the step reached upon completion of each 15-sec interval…………...16
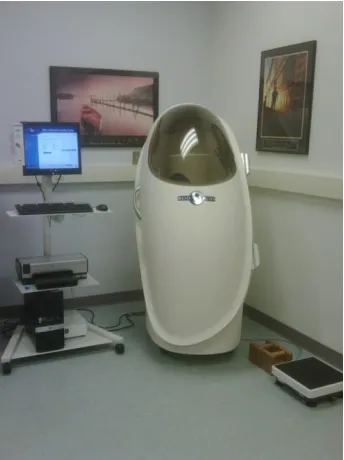
Figure 5: The BOD POD analysis was used to assess for changes in body composition at the start (0 wks) and end (7 wks) of SC SIT………18
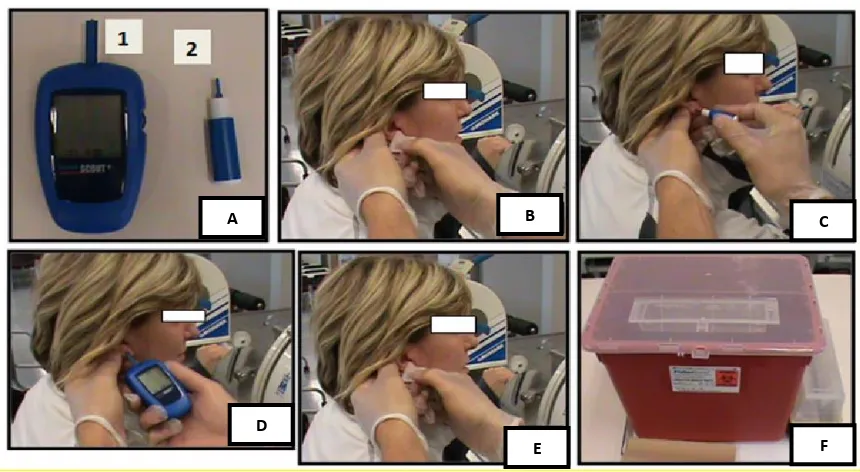
Figure 6: A was the Lactate Scout Analyzer (1) and Medlance 1.8 mm, 21G Autolancet (2) which was used for attaining a single blood droplet and analyzing it for lactic acid concentrations. B was the participant’s ear being cleaned with an alcohol swab while the investigator was wearing protective gloves before attaining a blood droplet. C was the use of the Medlance Autolancet which was held against the earlobe and pushed until it clicked. D was the Lactate Scout testing strip touched to the droplet of blood on the earlobe. Once the droplet touched the strip sufficiently, and reading was obtained by the Lactate Scout, the testing strip was disposed of into the sharps container. E was the earlobe being cleaned with a new alcohol whip post blood sample. The Medlance Autolancet lactate testing strip and alcohol wipe were disposed of into the sharps
container seen in F. All areas used were disinfected post-test, with the liquid disinfectant found in the lab....20 Figure 7: Represented the Margaria stair climb power test, which involved an individual starting 6 meters from the initial step and then running up as quick as possible by hitting every third step with their foot, until they got to the ninth step. At the third and ninth step, a pressurized mat was placed down in order to record the interval time between the third and ninth step, which was recorded and placed into a calculation formula to determine
lower body power………..……….…..22
climbing (SC) groups over the 7 wks of SC SIT. Values are means ± SD……....33 Figure 10: Average rating of perceived exertion for the non-weighted (n=13) and
weighted (n=14) stair climbing (SC) groups during the 7 wks of SC SIT. Values are means ± SD. ap < .05 between non-weighted SC and weighted SC groups for the
corresponding wk. bp < .05 from wk 1………35
Figure 11: Average stairs climbed for the non-weighted (n=13) and weighted (n=14) stair climbing (SC) groups. Values are means ± SD. ap < .05 between non-weighted SC and weighted SC groups for the corresponding wk. bp < .05 from wk 1…………….37
Figure 12: Non-weighted and weighted peak power output (Watts) during the Margaria Stair Climb at0 wks, after 4 wks of SC SIT and after 7 wks of SC SIT. Non-weighted SC SIT n=13, weighted SC SIT n=14. Values are means ± SD. ap<.05, 0 vs. 4 wks bp<.05 0 vs. 7 wks cp<.05 4 vs. 7 wks. No significant differences were found between groups...40
Figure 13: Treadmill MVO2 at 0 wks and following 4 and 7 wks of SC SIT for
non-weighted (n=13) and non-weighted (n=11) participants. Values are means ± SD. ap<.05 0 vs.
APPENDIX A... ...61
APPENDIX B...62
APPENDIX C...63
APPENDIX D...67
APPENDIX E ...71
APPENDIX F...75
APPENDIX G...76
APPENDIX H...78
APPENDIX I ...79
APPENDIX J ………...80
BLa = Blood Lactate
BPM = Beats Per Minute
BW = Bodyweight
HR = Heart Rate
Kcal/Min = Caloric Expenditure
Kg = Kilograms
M = Mass
Max HR = Maximum Heart Rate
Min – Minute
Mins - Minutes
mmol/L = millimoles per litre
Mph = Miles per Hour
MVO2 = Maximal Oxygen Consumption
PAR-Q+ = Physical Activity Readiness Questionnaire Plus
RHR = Recovery Heart Rate
RPE = Rating of Perceived Exertion
SC = Stair Climbing
SCAS = Stair Climbing Ascending Stairs
SCADS = Stair Climbing Ascending and Descending Stairs
SC SIT = Stair Climbing Sprint Interval Training
Sec – Second
Secs - Seconds
SD = Standard Deviations
Wk = Week
Wks = Weeks
Yrs = Years
VO2 = Oxygen Consumption
on a cycle ergometer or treadmill (Ghasemi et al., 2013; Patel et al., 2017; Schnohr,
O’Keefe, Marott, Lange & Jensen, 2015; Scribbans, Vecsey, Hankinson, Foster, & Gurd,
2016). Both cycle ergometer and treadmill aerobic exercise training studies have been
shown to significantly improve oxygen consumption (VO2) in all age ranges and genders
(Egana & Donne, 2004; Gillen et al., 2016; Loy et al., 1993; Tabata et al., 1996).
Similarly, stair climbing on a motorized stair climber or in a stairway is an
effective form of cardiovascular exercise. Stair climbing (SC) studies have been
performed at varying intensities for 2–45 mins for 6–12 wks or longer with 3-5 workouts
per wk and have resulted in improvements in maximal oxygen consumption (MVO2)and
lower body strength (Boreham et al., 2005; Loy et al., 1993; 1994).
In one of the first acute SC studies, Oldenburg, McCormack, Morse, & Jones
(1979) compared 6 participants (average 34 years(yrs)) using a self-paced SC protocol of
eight flights of stairs (79 steps, 14.8 metres) versus cycling at a resistance that was
comparable in workload to the SC protocol. They reported that SC and cycling had
similar acute heart rate (HR) and VO2 responses, but that cycling blood lactate levels
were significantly higher suggesting that lower body cycling ergometry stimulated more
skeletal muscle anaerobic glycolysis (Oldenburg, McCormack, Morse, & Jones, 1979).
In a 50 wk SC study, Cress et al. (1991) followed elderly females (72±6 yrs) who
high) per workout session. After 2 months of non-weighted SC, participants were then
fitted with progressively increasing sand-weighted backpacks to a maximum of 10% of
their body weight to improve leg strength over the next 4 months. Participants were
instructed to maintain a SC speed that evoked HR responses equal to 75% of HR reserve.
After 50 wks of SC, participants saw a 16% improvement in treadmill maximal oxygen
consumption (MVO2), a 9% increase in quadriceps strength, and muscle biopsies
revealed a 29% increase in type IIb muscle fiber size in the vastus lateralis muscle.
Loy et al. (1993) compared 9 wks of SC and treadmill running in 25 active
college women (average 21.8 yrs) training 4 times per wk for 30 mins at an intensity of
70-80% of maximum HR (max HR) progressing to 4 times per wk for 45 mins at 80-90%
of max HR. SC training resulted in a significant 12% increase in MVO2 and treadmill
running a 16% increase, with no statistically significant differences between groups,
indicating that SC was as effective as treadmill running for improving aerobic fitness.
In a follow-up study, Loy et al. (1994) conducted a 12 wk SC study in females
(average 55 yrs) training for 35 mins on a motorized SC (Stairmaster Gauntlet) with or
without a weighted vest for 12 wks. The non-weighted vest group performed 12 wks of
SC, versus a progressively increasing weighted vest group (no added weight for 5 wks,
+4% body weight (BW) at wk 6, +8% BW for wks 7-12). The added weight was
designed to improve lower body strength. Weighted SC HR was maintained at 80-85% of
age predicted max HR by reducing step count to ensure exercise intensity was the same
between the weighted and weighted SC groups. After 12 wks of SC, the
non-weighted group exhibited a significant 11.1% increase in treadmill MVO2 and a 9.6%
The authors also reported a significant improvement in quadriceps strength at 60 degrees
of knee angular velocity in the weighted-vest group. Loy et al. (1994) concluded that if
weighted SC exercise intensity (HR) is maintained, the addition of an external load (%
BW) has no effect on improving MVO2 or that the addition of 4-8% BW was an
insufficient stimulus to elicit any potential additional changes in MVO2.
In a 7 wk SC study, Boreham, Wallace & Nevill (2000) examined the VO2
changes with a SC protocol starting with 1 stair climb per session and progressing to 6
climbs, 5 days a wk, in sedentary females aged 18-22 yrs. The participants stair climbed
at a pace averaging 88 steps/min for a total of 199 steps (vertical displacement of 32.8
meters) per climb and then descended at their own pace. The researchers assessed VO2
changes using a standardized SC field test at 88 steps/min before and after the 7 wk
training protocol, monitoring both HR and VO2 during the test. They reported that when
performing the standardized SC test, the 7 wk SC group exhibited a significant reduction
in both VO2 (pre 27.1 ± 0.2 vs. post 24.8 ± 0.2) and lactate accumulation (pre 7.4 ± 0.87
vs. post 5.6 ± 0.57) representing an improvement in aerobic performance.
In 2004, Egana & Donne (2004) compared the MVO2 responses of 3 separate 12
wk training groups that involved SC, treadmill (TM) or elliptical exercise modalities in
24 moderately active females (average 29.6 yrs). Participants trained 3 times per wk for
30 mins at a HR of 70-75% HR max and progressively increased to 40 mins after wk 4
starting at a HR of 75-80% HR max and progressively increasing to 80-90% HR max for
the final 4 wks. They reported a significant increase in MVO2 following SC (4.4%),
differences between the training protocols (Egana & Donne, 2004) supporting the idea
that SC was comparable to TM or elliptical aerobic training.
Boreham et al., (2005) performed a follow-up study to their 2000 SC study
(Boreham et al. 2000), in which they attempted to replicate their previous VO2 findings
but utilized a MVO2 test versus a standardized SC field test VO2 determination. They
trained sedentary females (average 18.8 yrs) for 8 wks SC at 90 steps/min for a total of
199 steps (vertical displacement 32.8 meters) and allowed them to descend at their own
pace. Participants performed 2 climbs, 5 times per wk for the first 2 wks, and then
progressively increased one climb every 2 wks till participants were performing 5 stair
climbs, 5 days/wk. They reported that the progressively increasing SC routine elicited a
significant 17.2% improvement in cycle ergometer MVO2.
In summary, treadmill, cycle ergometer, elliptical, and SC training are
comparably effective at improving MVO2. However, all traditionally require 30-45 mins
of continuous training and may not be practical for an individual with a limited amount of
time to exercise. In contrast to endurance training, sprint interval training (SIT) involves
performing exercise at an ‘all-out’ or supramaximal intensity for 10-30 seconds (secs) on
a cycle ergometer or treadmill (Hazell, Macpherson, Gravelle & Lemon, 2010; Hazell,
Hamilton, Olver & Lemon 2014; MacInnis & Gibala, 2016; Whyte, Gill, Cathcart, 2010).
Each SIT exercise (work) session is separated by a period of active or inactive recovery
(rest), with work to rest ratios ranging from 1:1 to 1:24, (Allison et al., 2017;
Burgomaster, Heigenhauser, Gibala, 2006; Hazell, Macpherson, Gravelle & Lemon,
2010), repeated 2-7 times per session, with 2-3 workouts per wk for 2 to 16 wks (Allison
& Lemon, 2010; Metcalfe, Babraj Fawkner & Vollaard, 2012; Whyte, Gill, Cathcart,
2010). SIT produces the same MVO2 improvements as traditional endurance training
protocols, but the participants total exercising time (work + recovery) can be 90% less
than traditional endurance training. As little as 2 wks of SIT has been shown to produce
significant increases in MVO2, muscle oxidative capacity, muscle buffering capacity, and
anaerobic and aerobic enzyme activity (Allison et al., 2017; Burgomaster, Hughes,
Heigenhauser, Bradwell & Gibala, 2005; Burgomaster et al., 2008; Gibala et al., 2006;
Hazell, Macpherson, Gravelle & Lemon, 2010; MacInnis & Gibala, 2016; Metcalfe,
Babraj Fawkner & Vollaard, 2012; Whyte, Gill, Cathcart, 2010).
Given the success of aerobic-based SC and TM or cycle ergometer SIT, Allison
et al. (2017) recently examined the effectiveness of SC SIT. They determined MVO2 and
HR adaptations following 6 wks of SC SIT in 31 sedentary females (average 24 yrs)
using either a SC ascending stairs (SCAS) protocol or a SC ascending and descending
stairs protocol (SCADS). Participants were instructed to stair climb as fast and as safely
as possible using handrails if necessary. The SCAS (99 stairs; stair height = 0.195
meters) training study consisted of 3 sets, 3x/wk, at a 1:6 work to rest ratio (20 sec: 120
sec) and the SCADS (61 stairs; stair height = 0.205 meters) study consisted of 3 sets,
3x/wk, at a 1:1 work to rest ratio (60 sec: 60 sec). The SCAS SIT protocol elicited HR
responses that were 81% of age-predicted HR max and observed a significant 12%
increase in MVO2 during an incremental cycle ergometer test (pre 28.9 ± 3.4 ml kg-1 min
-1 vs. post 32.4 ± 3.6 ml kg-1 min-1). Additionally, the SCADS SIT protocol observed HR
responses that were 80% of age-predicted HR max and a significant 8% increase in
(2017) also compared blood lactate values following 3 separate sprint intervals involving
a work:rest ratio of 20 sec:120sec for SCAS (120 stairs; stair height = 0.135 meters)
versus cycle ergometer SIT set at .05% BW resistance. Both SCAS and cycle ergometry
SIT showed progressive increases in blood lactate concentrations and peak HR for each
subsequent bout, and there were no significant differences between the protocols
indicating a comparable exercise intensity. These results were the first to report that SC
SIT MVO2 improvements are comparable to TM and cycle ergometry SIT, but unlike
treadmill or cycle ergometer SIT sessions, SC SIT could be performed indoors or
outdoors with no associated equipment costs (Allison et al., 2017)
Typically, an increase in exercise intensity is used to further enhance MVO2
adaptations or performance and is accomplished by increasing treadmill speed/grade or
cycle ergometer workload resistance. However, for SC on a motorized stair climber, Loy
et al. (1994) added 4-8% bodyweight (BW) in their 12 wk SC study, but interestingly
chose to maintain exercise intensity (HR) similar to that seen in the control or no-load
group (0% BW), by reducing the number of stairs climbed (Loy et al., 1994). The added
4-8% BW had minimal effects on lower body muscular strength and had no effect on
MVO2 which they attributed to the maintenance of exercise intensity (HR) (Loy et al.,
1994).
Puthoff, Darter, Nielsen & Yack, 2006, examined the metabolic costs in male and
female participants (average 23.4 ± 1.7 yrs) walking at treadmill speeds varying from 2-4
miles per hour (mph) without (0%) and with a weighted vest of 10%, 15% and/or 20% of
an individual’s BW. They reported that in the majority of participants the addition of
speeds when compared to walking without a weighted vest (0%). Furthermore, Puthoff et
al., (2006) reported no significant increases in HR for 10% BW, but 15% BW at speeds
of 2.5, 3, 3.5 and 4mph, and 20% BW at speeds 3, 3.5 and 4mph, showed significant
increases in HR when compared to 0% BW. Their data suggested that the addition of
10%, 15% and 20% BW while walking on a treadmill was required to significantly
increase VO2 and that the addition of 15% or 20% BW was required in order to
significantly increase exercise intensity (HR) without increasing TM speed.
McCormick, Kravitz, Mermier & Gibson (2011), examined the metabolic
changes in untrained females (average 37 yrs) wearing 0%, 10% or 15% of their BW
walking at 2.5 mph with incremental gradient increases (0%, 5%, 10%, and 15%) every 4
mins (16 mins total walking time). They reported significant increases in VO2, caloric
expenditure (kcal/min), and exercise intensity (HR) for the 10% BW group at 5%, 10%,
and 15% gradient, and the 15% BW group at 0%, 5%, 10% and 15% gradient when
compared to walking without a load (0%). Additionally, they reported significant
increases in VO2, caloric expenditure (kcal/min), and exercise intensity (HR) from 10%
to 15% of BW for treadmill gradients of 0%, 5%, and 10%. These results indicate that the
addition of 10% and/or 15% BW was required to increase VO2, caloric energy
expenditure (kcal/min), and exercise intensity (HR) without increasing speed.
In summary, typically an increase in exercise intensity (HR) is used to enhance
VO2 gains and is accomplished by increasing cycle ergometer resistance or treadmill
speed/grade (McCormick et al., 2011; Puthoff et al., 2006). With stair climbing, Loy
added 4-8% BW but maintained exercise intensity (HR) similar to that seen with no load
improving MVO2 as exercise intensity (HR) was not elevated. While the addition of 10
-20% BW to TM walkers increases exercise intensity (HR), caloric expenditure, and VO2
when compared to walking without load (McCormick et al., 2011; Puthoff et al., 2006).
Combining the addition of 10-15% BW to TM walking with increasing TM grades (5%,
10% & 15%) also resulted in further significant increases in exercise intensity (HR),
caloric expenditure, and VO2 when compared to walking without a load (McCormick et
al., 2011). Collectively, given the reported effects of adding a % BW on improving SC
skeletal muscle strength, increasing TM exercise intensity (HR), caloric expenditure and
VO2 walking at increasing TM inclines and the recent report by Allison et al. (2017) on
SC SIT to improve MVO2, the question arises is what effect would adding a % BW do to
SC SIT exercise intensity, MVO2 and leg power. Therefore, the purpose of this
investigation was to determine the effect of adding weight during SC SIT on heart rate,
rating of perceived exertion, MVO2, and skeletal muscle power following a 7 wk SC SIT
protocol. The study consisted of 2 experimental groups:
1. Control Group - 7 wk non-weighted
2. 10/20% Group - 1 wk non-weighted + 3 wk with 10% BW + 3 wk with 20% BW
The specific objectives were to determine the changes from baseline to 4 wks and
following 7 wks of non-weighted and weighted SC SIT on:
treadmill MVO2
lower body skeletal muscle power
heart rate, and blood lactate accumulation during and following the SC SIT
programs
METHODS
Session 1: Documentation and Familiarization
This study was approved by the University of Windsor Research Ethics Board
(REB#17-155). Twenty-seven male participants were recruited between the ages of 18-30 years
who had been exercising at least 2 times per wk for the past 3 months and were not
following a stair climbing training program, strenuous aerobic-based training program,
high intensity interval training program or sprint interval training program or were
university or community elite athletes. This population was chosen due to their
familiarity with regular exercise (i.e., fatigue, muscle soreness, and exercising heart
rates). Only males were recruited as there were no SC SIT studies on males to date.
Participants were recruited from the University campus and the local community via
posters, e-mail, social media, and word of mouth (Appendices A and B). When an
interested participant responded, they were sent a letter of information (Appendix C)
via email.
Individuals who were still interested in participating were asked to visit the
Multipurpose Research Lab (room 202) for a documentation and familiarization
session in the Human Kinetics building, at the University of Windsor. Upon arrival,
participants were further informed about the purpose of the study both verbally and in
writing and were also asked to sign a written form of consent (Appendix D).
Participants were then asked to complete the Physical Activity Readiness
participants were free of any known risks that would have indicated possible issues in
participating in the physical exercise prescribed. If they passed the PAR-Q+, they were
asked to fill out the participant information questionnaire (Appendix F), in order to
collect normative data including age, month/year of birth, height, and weight.
Participants were then asked to fill out the Godin Leisure-Time Exercise Questionnaire
(Appendix G), in order determine their exercise status (i.e., strenuous, moderate, mild),
weekly ability to work up a sweat (i.e., often, sometimes, never) and to confirm
inclusion/exclusion exercise criteria stated during the recruitment process.
Participants were then asked to schedule a date for their baseline testing session
following a 24 hour period free of caffeine, alcohol, and exercise. Participants were
required to fast for at least 4 hours prior to testing. Alcohol is known to slow down
the central nervous system and may significantly reduce performance, whereas
caffeine is a stimulant that may provide an ergogenic benefit and may alter resting
and exercise heart rates.
Participants were shown and explained the SC SIT groups and experimental design
(Table 1):
1.Control Group - 7 wk non-weighted
Table 1: The order of testing and data collection: “x” represented data collection
points. Baseline testing, during training wks 1-4, mid-way (testing after 4 wks of SC SIT), during the training wks 5-7, and post SC SIT. The first wk of SC SIT had all SC SIT groups using no load. During wks 2-4 SC weight for the Control group was 0%, and the 10/20% group added 10% of their bodyweight. The last 3 wks the Control group continued to use 0%, and the 10/20% Group added 20% of their body weight during SC SIT.
Variables Measured Baseline Testing Wk1 SIT Wk2 SIT Wk3 SIT Wk4 SIT Mid Way Wk5 SIT Wk6 SIT Wk7 SIT Post SIT Body Composition (Fat-Free Mass, Fat Mass, Body Mass)
(kg)
X X
Blood Lactate (Resting) (mmol/L)
X X X
Margaria stair climb Power (Watts)
X X X
Treadmill MVO2
(ml/min/kg)
X X X
Stairs Climbed X X X X X X X
Heart Rate (bpm) X X X X X X X X X X Rating of
Perceived Exertion (RPE)
X X X X X X X X X X
Blood Lactate (Immediately Post Exercise)
(mmol/L)
X X X
The first “baseline testing” session was conducted prior to the start of SC SIT
training. Following baseline testing, the participants were randomly divided into
one of 2 experimental groups: 1. Control Group - 7 wk non-weighted, and 2.
10/20% Group – (1 wk non-weighted + 3 wk with 10% BW + 3 wk with 20% BW).
The first wk of non-weighted SC was designed for the purpose of familiarizing all
session was conducted after 4 wks (after 12 training sessions) of SC SIT for both
experimental groups. The last testing session was conducted after wk 7 (another 9
training sessions) of SC SIT for both experimental groups. Testing consisted of
body composition, Margaria stair climb power, and treadmill MVO2 protocol. Heart
rate (HR)(Figure 1), rating of perceived exertion (RPE) and pre and post ear-lobe
blood lactates were also collected prior to and immediately after the TM MVO2 test.
Figure 1: A represents the Polar Heart Rate Monitor (Model E40) watch and the corresponding chest strap. B represents the proper placement of the Polar Heart Rate Monitor chest strap. The chest strap rested below the nipples and was centered just below the sternum.
During the familiarization session, participants were also introduced to the RPE Borg
scale 6-20 (Appendix H) and fitted with a Polar HR monitor (Model E40; Figure 1).
The investigator then explained the SC SIT training protocol, which involved
participants performing 4 SC SIT sets, climbing stairs as fast and as safe as possible
using the handrail if needed, for 15 secs separated by 90 secs of rest. This 1:6 work to
rest ratio was selected as it had been shown to elicit improvements in MVO2 for
sedentary females performing SC SIT (Allison et al., 2017) and cycle ergometer SIT
MVO2 (Gillen et al., 2014, 2016). Fifteen-second (sec) work intervals were selected
due to the availability of staircases in the Department of Kinesiology that offered
enough steps to perform SC SIT and since as little as 10-sec intervals had been shown
to elicit improvements in SIT MVO2 (Hazell et al., 2010). The Kinesiology stairway
corridor was signed “testing in progress “and cordoned off during SC SIT to ensure
participant and tester safety. An emergency action plan for medical emergencies during
exercise testing and/or training had been established as a precautionary measure
(Appendix I).
After the SC SIT protocol was explained, participants were given 4 opportunities to
practice the SC SIT sessions. Participants started without any additional body weight,
then with 10% BW, then 20% BW and finally without weight again in order to ensure
they were familiar and comfortable with the different SC SIT training groups. Prior to
the SC SIT weighted practice trials, the investigator familiarized participants with the
weighted vest by inserting or removing the weighted packets (approximately 3 pounds)
from the vest in order to match the 10% or 20% BW (Figure 2A). The weight that each
participant was fitted with was based on their bodyweight, and it was recorded during
the familiarization session in order to ensure standardization throughout the study.
After the proper external weight was matched to the participant, the investigator
Figure 2: A represented how the weighted vest was adjusted for each participant. Packets that weigh approximately 3 pounds were inserted or removed depending on the
individual’s body weight and which weight group they were in (10% or 10-20%). B represented how the weighted vest was worn by each participant. Participants placed their arms through the side of the vest and secured the front velcro strap in order to minimize vest movement during the SC SIT interval.
The investigator timed each work and rest interval using the Gymboss interval
timer, and tracked the intervals using the Gymboss ‘beep’ to begin and stop the SC
SIT work (15 sec) and rest periods (90 sec) (Figure 3).
Figure 3: Gymboss Interval Timer was pre-set to indicate the start and end of every work and rest period with a “beep
Participants were instructed to inform the investigator of the step number reached (top
foot was taken) with the completion of each 15 sec SC SIT session (Figure 4). Each
step was numbered to make it easy to determine how many steps the participant had
completed during their SC SIT session.
Figure 4: Typical numbered staircase that the SC SIT sessions were performed on. The participant ran up the stairs as fast and as safe as possible using the handrail if necessary for a total of 15 secs, which represented the completion of one work interval. The average step height and step width were 18.4cm and 28cm
respectively as indicated by the arrows. Each step was numbered to give an indication to the participant and investigator the step reached upon completion of each 15-sec interval.
18.4cm
During the SC SIT, the investigator gave feedback and encouragement to the
participant so that for the first training session, participants already had a complete
understanding of how the training exercise would be performed (Appendix J). The
SC SIT practice sessions were performed at the end of the documentation and
Session 2: Baseline Testing Session
The baseline testing session took place in the Multipurpose Research Lab (room
209) at the University of Windsor’s Human Kinetics building. Each testing session
required approximately 80 mins of participation time including warm up, rest
intervals, testing exercises, and post-exercise cooldown. Participants were reminded
via email to fast for 4 hours and to be alcohol, caffeine and exercise free for 24 hours
before all testing sessions. All participants were asked to maintain their regular
nutritional and exercise habits outside of testing dates. All testing and training
sessions were separated by a minimum of 24 hours, to provide adequate time for
muscle recovery.
The first test that was conducted was a body composition analysis using
the BodPod (Figure 5).
BOD POD Testing Procedure Guidelines: (Heyward, 2010)
1) The participant was dressed in the appropriate attire (form-fitting speedo or single layer compression shorts) and had fasted for two hours, refrained from exercise for two-six hours and had used the restroom.
2) Participant identification number was entered into the computer.
3) The BOD POD was calibrated.
4) The participant’s mass was measured using a digital scale, height recorded,
and the measures were used to calculate body surface area.
5) The participant’s body volume was measured while sitting inside the BOD POD. 6) The participant’s Thoracic Gas Volume (TGV) was determined using a prediction
equation
7) Test results were recorded.
Before all testing sessions and all training sessions, participants were fitted with a
Polar HR monitor (Model E40) (Figure 1) that recorded their HR. On testing days
only, once the HR monitor had been fitted, participants were seated for 10 mins of
rest prior to the collection and determination of baseline ear-lobe blood lactate
concentration. Increases in baseline blood lactate concentrations following exercise
testing (treadmill) represented the contribution of anaerobic metabolism to energy
demand and was an indicator of exercise intensity (Goodwin, Harris, Hernandez &
Gladden, 2007). For blood lactate determination, the standard earlobe technique
Figure 6: A was the Lactate Scout Analyzer (1) and Medlance 1.8 mm, 21G
Autolancet (2) which was used for attaining a single blood droplet and analyzing it for lactic acid concentrations. B was the participant’s ear being cleaned with an alcohol swab while the investigator was wearing protective gloves before attaining a blood droplet. C was the use of the Medlance Autolancet which was held against the earlobe and pushed until it clicked. D was the Lactate Scout testing strip touched to the droplet of blood on the earlobe. Once the droplet touched the strip
sufficiently, and reading was obtained by the Lactate Scout, the testing strip was disposed of into the sharps container. E was the earlobe being cleaned with a new alcohol whip post blood sample. The Medlance Autolancet lactate testing strip and alcohol wipe were disposed of into the sharps container seen in F. All areas used were disinfected post-test, with the liquid disinfectant found in the lab.
Participants with long hair were asked to pull or tie their hair to expose their
ears. The investigator wore disposable latex gloves, and then wiped the earlobe of
the participants with an alcohol swab and dried the area (Figure 6B). The earlobe
was pricked using a single-use Medlance 1.8mm, 21G auto-lancet to collect a single
drop of venous blood (Figure 6C) onto a Lactate Scout Analyzer disposable lactate
test strip (Figure 6D). Directly following the collection of venous blood, the
investigator wiped the earlobe with a new alcohol wipe (Figure 6E), recorded the
lactate value from the Lactate Scout, and immediately disposed of the lactate testing
A B C
D
strip into the sharps container (Figure 6F). Also, ear blood lactate measurements
were taken immediately post-treadmill testing, and 5 mins post-testing, to facilitate
the determination of peak lactate due to diffusion of intramuscular lactate into the
bloodstream (Cheetham et al., 1986; MacRae et al., 1992; Plowman & Smith, 2014).
The lactate measurements were taken from alternate earlobes in order to improve
participant comfort.
Following blood lactate collection, a standardized dynamic warm-up took
place to prepare participants for movements associated with baseline testing and
consisted of 10 forward/backward leg swings, 10 horizontal side to side leg swings,
10 knee to butt kicks and 10 side twists. Following the warm-up, a 3-min rest break
was taken prior to the initiation of the muscular strength, speed and power tests to
The first skeletal muscle performance test was the ‘Margaria stair climb Power
test’ (Figure 7) used to assess muscular power changes due to SC SIT.
Figure 7: Represented the Margaria stair climb power test, which involved an individual starting 6 meters from the initial step and then running up as quick as possible by hitting every third step with their foot, until they got to the ninth step. At the third and ninth step, a pressurized mat was placed down in order to record the interval time between the third and ninth step, which was recorded and placed into a calculation formula to determine lower body power (Baechle & Earle, 2008).
Prior to the beginning of the Margaria stair climb test, the investigator demonstrated
the Margaria stair climb to the participants (Margaria, Aghemo & Rovelli; 1966). The
participants started 6 meters from the bottom of the steps and then ran up the steps
three at a time, stepping on the third, sixth and ninth steps. The interval between the
participant placing a foot on the third and ninth step was timed using pressurized time
mats to accurately determine the interval time between the 3rd and 9th stair. The
participant was allowed to practice the stair climb 2 times prior to testing. Participants
(walking down the stairs and standing) and their fastest time was recorded for data
purposes. After the participants’ fastest time was recorded, it was inserted into a
calculation formula to determine lower body muscular power.
Formula
Power (Watts) = G (Acceleration due to Gravity) x M (Mass) x H (vertical height between 3rd and 9th step)
T (time between 3rd and 9th step)
After the Margaria stair climb, participants were given 5 mins of rest to recover prior to
doing the treadmill (MVO2 test. The treadmill MVO2test determined the participant’s
To determine the MVO2, participants completed a graded exercise test to
exhaustion, which was performed on a motorized treadmill (Figure 8).
Before the treadmill test, the investigator began recording data with the
previously fitted Polar HR monitor. Each participant was shown a Borg RPE 6-20
point scale which measured the degree of difficulty experienced by each
participant throughout different stages of testing and training sessions (Appendix
H, Appendix K). During the treadmill test, the investigator held up an RPE chart at
the end of each 2-minute (min) session, and signal indicated by nodding to the
effort they perceived. The participant was also fitted with a Hans Rudolph
facemask (Model V2) which was attached to the VO2 testing apparatus (Cosmed
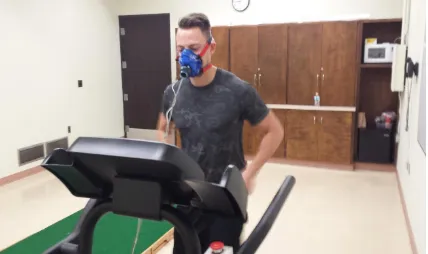
Figure 8: Illustrates the MVO2 Treadmill Protocol being performed with Hans Rudolph Mask attached to the participants head.
Following a 5-min treadmill warm-up, each participant ran at a self-selected
pace (5–7 miles per hour) with incremental increases in grade (2%) applied
every 2 min until volitional fatigue (Miller, Dougherty, Green, Crouse, 2007;
Schealder & Devor, 2015). HR was recorded every 2 mins throughout the test
using the Polar HR monitor. MVO2 was taken when1 of the following criteria
were met: (i) greatest 30-s average in the presence of a plateau in VO2 values
(<1.35 mL.kg−1.min−1 increase) despite increasing workload, (ii) achievement
of a HR max (<10 beats.min−1 of age-predicted maximum (220 − age), and/or
(iii) voluntary exhaustion (Miller, Dougherty, Green, Crouse, 2007; Schealder &
Devor, 2015). Upon completion of the treadmill protocol and a reduction in
measurement was obtained. Water was readily available in the lab for the
Stair Climbing SIT Sessions
When participants arrived for the first SC SIT session, they were fitted once
again with the Polar HR monitor, were shown a copy of the Borg RPE 6-20 scale
(Appendix H), aand were given an explanation of the SC SIT protocol. The
participant was reminded to note the stair number reached during the completion of
each 15 sec SC SIT interval in order to keep track of potential differences from
interval to interval as fatigue set in. The Gymboss Interval Timer (Figure 3) was
used to track time of the intervals using a “beep” to notify the participant to begin
and stop the SC SIT work and the rest periods.
A standardized dynamic warm-up took place consisting of 10 jumping jacks,
10 forward/backward leg swings, 10 horizontal side to side leg swings, and
ascending/descending 2 flights of stairs that got participants accustomed to moving
up the stairs prior to SC SIT.. Following the warm-up, participants were seated for 2
mins prior to the initiation of the SC SIT training to allow adequate recovery from
the warm-up. Participants were told that they would perform four SC SIT sets
climbing stairs as fast and as safe as possible using the handrail if necessary.
Participants were reminded that they would perform 4, 15 sec bouts of SC SIT
separated by 90 secs of rest, a 1:6 work to rest ratio. This work to rest ratio was
chosen because it has been previously reported in a SC SIT study (Allison et al.,
2017) and two separate cycle ergometer SIT studies (Gillen et al., 2014 2016) to
elicit significant MVO2 responses. Total training session time was approximately 20
The participants climbed as many stairs as possible in a 15-sec bout without
weight. For both groups (Table 2), no-weight was used during the first wk of SC
SIT to ensure all participants became familiarized with SC SIT. Upon completion of
the first wk, participants continued with SC SIT in their respective training groups:
Control Group - 7 wk non-weighted, and 10/20% BW Group – (1 wk non-weighted
+ 3 wk with 10% BW + 3wk with 20% BW). The purpose of increasing the weight
was to provide a progressive overload and determine if further improvements in
MVO2 and skeletal muscle performance could be elicited during weighted SC. The
addition of 10% and 20% BW had been previously used in treadmill and stair
climbing exercise training studies (Cress et al., 1991; Puthoff et al., 2006;
McCormick et al., 2011). Additionally, as fatigue began to set in during SC SIT, it
was the job of the investigator to constantly monitor participant technique and
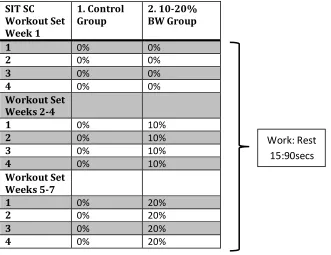
Table 2: The exercise protocol for wk 1 involved all three groups utilizing no weight to ensure that all groups became accustomed to SC SIT. The first wk of SC SIT involved all SC SIT groups using no load. During wks 2-4 SC SIT weight for the Control group was 0%BW, and the 10/20% group added 10% of their bodyweight. The last 3 wks the Control group continued to use 0%BW, and the 10/20% Group added 20% of their body weight during SC SIT.
At the end of each SC SIT work interval, participants reported their HR,
RPE, and step number attained to the investigator which were then recorded during
all 21 SC SIT sessions (Table 3). After the SC work interval was finished,
participants were given a rest time of 90 secs, during which time they walked down
to the bottom at their own pace to prepare for the next interval. When participants
reached the bottom of the stairs, they were allowed to stand or walk around for the
remaining rest interval. Ten secs before the end of the rest interval, participants were
instructed to move to the start of the stairs in preparation for the next SC interval.
SIT SC Workout Set Week 1
1. Control
Group 2. 10-20% BW Group
1 0% 0%
2 0% 0%
3 0% 0%
4 0% 0%
Workout Set Weeks 2-4
1 0% 10%
2 0% 10%
3 0% 10%
4 0% 10%
Workout Set Weeks 5-7
1 0% 20%
2 0% 20%
3 0% 20%
4 0% 20%
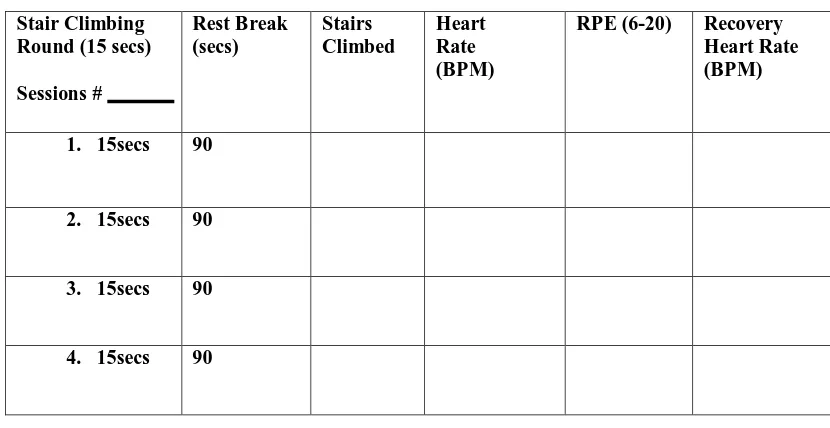
Table 3: The investigator recorded each participant's SC SIT HR, RPE, stair number climbed and recovery HR during each session (1-21) in order to track physiological responses throughout the SC SIT study.
Stair Climbing Round (15 secs)
Sessions # Rest Break (secs) Stairs Climbed Heart Rate (BPM)
RPE (6-20) Recovery Heart Rate (BPM)
1. 15secs 90
2. 15secs 90
3. 15secs 90
4. 15secs 90
At the end of each testing and SC SIT session participants completed a cool down
routine, where each participant walked at a self-selected pace for 2-5 mins or until
they achieved a pre-exercise resting heart rate value. A foam roller was provided as
well to aid in participant recovery post-exercise. After each training session, the Polar
HR monitor was sterilized with disposable alcohol wipes.
Participant Confidentiality
Participant’s personal information and testing results were stored confidentially.
All digital data was on a password protected computer with hard copies locked in the
investigator's office away. All VO2 data was stored on a password-protected computer
in the Undergraduate Laboratory. All personal data was stored as a unique
identification number, instead of a participant’s name to further keep the data
no longer participate in this research study, they could withdraw from the
investigation at any point in time.
Sample Size
The purpose of this study was to examine if there were any physiological adaptations
in lower body power, lower body strength, treadmill MVO2, heart rate, and metabolic
adaptations in exercising lactate concentration. With an alpha level of 0.05, an effect size
of 0.25, and a power of 0.8, the sample size necessary to detect significant changes was
24 participants, with 12 required for each of the two training groups. For the purpose of
this study, the aim was to recruit 30 participants to account for potential dropouts.
Statistics
Statistical analyses were performed using SPSS 21. All data including descriptive
statistics were presented as means and standard deviations (SD). Discriminative
analyses using factorial ANOVA between within interaction was conducted on Body
Composition, Margaria stair climb power, treadmill MVO2, resting blood lactate,
blood lactate post MVO2, peak HR, peak RHR and RPE that investigated and
identified relationships throughout the training protocol. All ANOVA’s required
repeated measures on the factor of time (baseline, mid-way, and post SIT). For the
analysis of lactate values, a 2 (resting and immediately after) x 3 (baseline, mid-way,
and post SIT) factorial ANOVA between within interaction was used. Mean
Participant characteristics in the two experimental groups are outlined in Table 4.
Table 4: Male Participant Characteristics
Group Age (yrs) Weight
(kg)
Height (m) Non-Weighted
(n=13)
22.69 ± 2.91 80.43 ± 14.28 1.78 ± 0.04
Weighted 22.30 ± 2.26 80.63 ± 9.02 1.79 ± 0.06
(n=14)
Values are mean ± SD
All participants performed the same protocol for the first wk of SC SIT, which involved
completing 4, 15 sec bouts of SC SIT separated by 90 secs of rest, a 1:6 work to rest ratio
without a weighted vest. Upon the completion of wk 1, participants were randomly
assigned into one of the two experimental groups (weighted or weighted). The
non-weighted stair climbers performed the additional 6 wks of SC SIT without any additional
load, whereas the weighted stair climbers added 10% BW through wks 2 -4 and then
increased to 20% BW for the final 3 wks of the SC SIT protocol. The addition of BW
was added to the weighted stair climbers in an attempt to increase exercise intensity and
lead to further increases in performance.
Two stair climbers in the non-weighted group had to withdraw from the study: one due to
an injury obtained outside of the study, and other due to an inability to adhere to the time
commitment of the training protocol. Three stair climbers in the weighted group were
included in the mid-way calculations
Stair Climbing SIT Peak Heart Rate and Recovery Heart Rate Responses
Statistical analyses for non-weighted and weighted stair climbers determined there were
no significant differences in average peak heart rate responses between the 2 groups for
any of the SC SIT bouts over the 7 wks of SC SIT. (Figure 9).
Figure 9: Average peak heart rate during stair climbing (15 sec) and recovery heart rate (RHR) responses (90 sec) for the non-weighted (n=13) and weighted (n=14) stair
climbing (SC) groups over the 7 wks of SC SIT. Percentage of age-predicted maximum heart rate (Max HR) was 84% for both stair climbing (SC) groups. Values are means ± SD.
Stair climbing recovery HR responses were collected 20 secs before the next SIT interval
and were determined once the participants had walked down the stairs to start the next
SIT SIT SIT SIT SIT SIT SIT
120 140 160 180
1 2 3 4 5 6 7
A ver ag e Ma x H ea rt R at e
Weeks of Training
Non-Weighted Weighted
RHR RHR RHR RHR RHR RHR
determined there were no significant differences in average recovery heart rates for any
of the 7 wks of SC SIT recovery periods.
Stair Climbing SIT Rating of Perceived Exertion Responses
Statistical analyses for non-weighted stair climbers determined there were no significant
differences in rating of perceived exertion (RPE) throughout the 7 wks of SC SIT.
(Figure 10). Statistical analysis for weighted stair climbers found significant differences
in rating of perceived exertion (RPE) from wk 1 of SC SIT to wk 2 of SC SIT (10% BW)
(F (1,13) = 4.670, p<0.05), no significant differences from wk 1 of SC SIT to wk 3 of SC
SIT (10% BW) (F (1, 13) = 2.209, p=0.161), significant difference found from wk 1 of
SC SIT to wk 4 of SC SIT (10% BW) (F (1,13) = 4.472, p<0.05). Further, for weighted
stair climbers, significant differences were found from wk 1 of SC SIT to wk 5 of SC SIT
(20% BW) (F (1,13) = 20.351, p<0.05), wk 1 of SC SIT to wk 6 of SC SIT (20% BW) (F
(1,13) = 23.248, p<0.05), and wk 1 of SC SIT to wk 7 of SC SIT (20% BW) (F (1,13) =
Figure 10: Average rating of perceived exertion for the non-weighted (n=13) and weighted (n=14) stair climbing (SC) groups during the 7 wks of SC SIT. Values are means ± SD. ap < .05 between non-weighted SC and weighted SC groups for the corresponding wk. bp < .05 from wk 1.
When comparing rating of perceived exertion between non-weighted and weighted stair
climbers, there was no significant differences found between groups at wk 1 (F (1,26) =
0.081, p=0.781), and wk 2 (10% BW added to weighted stair climbers) (F (1,26) = .748,
p=0.395), wk 3 (10% BW added to weighted stair climbers) (F (1,26) = .796, p=0.381)
and wk 4 (10% BW added to weighted stair climbers) (F (1,26) = 0.641, p=0.439) of SC
SIT. However there was a significant RPE differences found at wk 5 of SC SIT (20%
BW added to weighted stair climbers) (F (1,26) = 13.508, p<0.05), wk 6 of SC SIT (20%
BW added to weighted stair climbers) (F (1,26) = 12.983, p<0.05), and wk 7 of SC SIT
(20% BW added to weighted stair climbers) (F (1,26) = 8.427, p<0.05).
10% BW 20% BW
a a a
b b 11.5 12 12.5 13 13.5 14 14.5 15 15.5
1 2 3 4 5 6 7
R at in g o f P er cei ved E xer ti o n
Weeks of Training
Statistical analyses for non-weighted stair climbers determined there were no significant
differences in the average number of stairs climbed during the first 3 wks of SC SIT.
(Figure 11). However, there was a significant increase found following 4 wks of SC SIT
(F (1,12) = 6.230, p<0.05), 5 wks of SC SIT (F (1,12) = 9.753, p<0.05), 6 wks of SC
SIT (F (1,12) = 7.647, p<0.05), and 7 wks of SC SIT (F (1,12) = 14.751, p<0.05).
Similarly, when 10% BW was added the weighted stair climbers demonstrated no
significant differences in stairs climbed from wk 1 to wk 2 of SC SIT (F (1,12) = 1.243,
p<.285), wk 1 to wk 3 of SC SIT (F (1,12) = .081, p<0.250) and wk 1 to wk 4 of SC SIT
(F (1,12) = 0.001, p<0.280 ).
However, with addition of another 10% BW to a total additional 20% BW load at wk 5
there was a significant decrease in the number of stairs climbed at wk 5 of SC SIT (F
(1,12) = 9.837, p<0.05), wk 6 of SC SIT (F (1,12) = 8.315, p<0.05), and wk 7 of SC SIT
Figure 11. Average stairs climbed for the non-weighted (n=13) and weighted (n=14) stair climbing (SC) groups. Values are means ± SD. ap < .05 between non-weighted SC and weighted SC groups for the corresponding wk. bp < .05 from wk 1.
Comparing average stairs climbed there were no significant differences found between
the weighted and weight stair climbers for the first 3 wks of SC SIT. Between
non-weighted and non-weighted stair climbers, a significant difference was only found when 20%
BW was added (see Figure 11) at wk 5 of SC SIT (F (1,26) = 66.753, p<0.05), wk 6 of
SC SIT (F (1,26) = 37.634, p<0.05), and after wk 7 of SC SIT (F (1,26) = 35.597,
p<0.005). a a a b b b 46 48 50 52 54 56 58 60
1 2 3 4 5 6 7
St ai rs Cl im b ed ( N )
Weeks of Training
Non-Weighted Weighted
BOD POD Analysis
Body composition changes were only assessed for baseline and post 7 wks as it was
believed that 4 wks would not have been a sufficient time stimulus to produce any
significant results.
For non-weighted stair climbers, changes in body composition following 7 wks SC SIT
observed no significant improvements in Body Mass (kg) Fat-Free Mass (kg) Fat Mass
(kg), Fat Mass and Fat-Free Mass Post. Similarly, weighted stair climbers, observed no
significant improvements in Body Mass (kg), Fat-Free Mass (kg), Fat Mass (kg), Fat
Mass %, and Fat-Free Mass Post % following 7 wks SC SIT.
Table 5: Summary of SC SIT body composition values pre and post SC training for non-weighted and non-weighted participants.
Group Wks Body Mass
(kg) Fat-Free Mass (kg) Fat Mass (kg) Fat Mass % Fat-Free Mass Post %
Non-Weighted
0 81.18 ± 14.10 65.19 ± 6.65 15.44 ± 10.16 18.14 ± 7.61 81.86 ± 7.61
(n=13) 7 80.63 ± 14.28 65.86 ± 7.20 15.31 ± 9.08 18.04 ± 6.73 81.96 ± 6.76
Weighted 0 80.36 ± 12.31 65.52 ± 7.60 14.84 ± 4.71 18.39 ± 5.03 81.65 ± 5.00
(n=14) 7 80.39 ± 9.02 66.02 ± 7.79 14.53 ± 6.35 17.82 ± 6.61 82.17 ± 6.61
Values are mean ± SD
Comparing differences in body composition values over the baseline testing period
between non-weighted and weighted stair climbers observed no significant differences
between groups for Body Mass (kg), Fat-Free Mass (kg), Fat Mass (kg), Fat %, Free
Mass (kg), Fat-Free Mass (kg), Fat Mass (kg), Fat %, and Fat-Free Mass % (Table 5).
Skeletal Muscle Power
Margaria Stair Climb
The Margaria Stair Climb was performed to measure changes in lower body leg power,
as it involves an individual running up a flight of stairs (landing on the 3rd step and 9th
step) and simulates the action associated with SC SIT (Figure 7). The repeated ANOVA
analyses, for non-weighted stair climbers, demonstrated a significant improvement in
skeletal muscle power production for the Margaria Stair Climb test after the first 4 wks of
SC SIT (F (1,12) = 6.693, p<0.05), as well as significant improvements from 0 wks to 7
wks (F (1,12) = 8.773, p<0.05). No significant improvements were found in
Figure 12: Non-weighted and weighted peak power output (Watts) during the Margaria Stair Climb at0 wks, after 4 wks of SC SIT and after 7 wks of SC SIT. Non-weighted SC SIT n=13, weighted SC SIT n=14. Values are means ± SD. ap<.05, 0 vs. 4 wks bp<.05 0 vs. 7 wks cp<.05 4 vs. 7 wks. No significant differences were found between groups.
Similarly, weighted (10% BW) stair climbers observed similar significant improvements
after the first 4 wks of SC SIT (F (1,13) = 11.691, p<0.05), when BW was increased to
20% BW from wks 4 to 7 of SC SIT (20% BW) (F (1,13) = 5.007, p<0.05), and
significant improvements from 0 wks to 7 wks (F (1,13) = 34.575, p<0.001).
Comparing differences between non-weighted and weighted stair climbers in skeletal
muscle power over the three testing periods 0 wks, 4 wks SC SIT, post 7 wks SC SIT, no
significant differences were observed at 0 wks( F (1,26) = 2.473, p=0.142) and after 4
wks of SC SIT (F (1,26) = 2.478, p=0.141), along with no significant differences post 7
c b 0 500 1000 1500 2000 2500 3000 Non-Weighted Weighted Pea k Po wer O u tp u t (Wa tt s)
Weeks of Training
0 Weeks 4 Weeks 7 Weeks
weighted stair climbers in attempts to further increase skeletal muscle power.
MVO2, Blood Lactate and Peak Heart Rate Data Collection
Earlobe blood lactate(BLa) concentrations were taken before and after each MVO2 testto
measure the contribution of anaerobic glycolysis to exercise and peak heart responses
were recorded after each MVO2 to measure exercise intensity.
Blood Lactate and Peak Average Heart Rate Post MVO2
Blood lactate (BLa) concentrations before and after each MVO2 test, as well peak average
heart rates during the MVO2 for non-weighted and weighted stair climbers are shown in
Table 6.
Table 6: Summary of average treadmill MVO2, blood lactate concentrations and peak average heart rates values at 0 wks, after 4 wks of SC SIT and 7 wks of SC SIT for non-weighted and non-weighted (10-20% BW) stair climbers.
Group Resting Blood
Lactate (mmol/L) Post MVO2 Blood Lactate (mmol/L) Peak Average Heart Rate Post VO2 (bpm)
Non-Weighted 0 Wks 1.82 ± 0.29 9.1 ± 2.01a 191.07 ± 9.0
(n=13) 4 Wks 1.81 ± 0.30 9.36 ± 1.97a 191.67 ± 9.5
7 Wks 1.86 ± 0.22 8.9 ± 2.24a 188.46 ± 8.8
Weighted 0 Wks 1.92 ± 0.40 10.2 ± 2.07a 191.14 ± 10.1
(n=11) 4 Wks 1.87 ± 0.33 10.44 ± 3.4a 189.74 ± 9.5
7 Wks 1.96 ± 0.31 11.8 ± 4.2a 189.21 ± 9.8
Values are mean ± SD a
Resting vs. Immediately Post at 0, 4 and 7 wks. No significant differences were found between non-weighted and weighted stair
climbers (10-20% BW) for any of the testing periods.
In non-weighted and weighted stair climbers, there were no significant differences were
for the 0 wks testing session F (1,12) = 147.200, p<0.001, after 4 wks of SC SIT testing
session (F (1,12) = 173.69, p<0.001), and after 7 wks of SC (F (1,12) = 108.659,
p<0.001). Weighted stair climbers observed similar results demonstrating that resting
BLa also rose significantly immediately after the treadmill MVO2 test in the 0 wks testing
session (F (1,10) = 228.95, p<0.001), after the 4 wks of SC SIT testing session (F (1,10)
= 64.436, p<0.001), and after 7 wks of SC training (F (1,10) = 88.044, p<0.001) (Table
6). In non-weighted and weighted stair climbers, there were no significant differences
were in resting BLa at any of the testing wks.
Comparing differences between BLa values over the three testing periods, between
non-weighted and non-weighted stair climbers, there were no significant differences observed
between the two experimental SC groups.
Peak Average Heart Rate Post MVO2
Comparing differences between peak average heart rate values during the MVO2 over the
three testing periods (0 wks, 4 wks, post 7 wks SC SIT), in both non-weighted and
weighted stair climbers, no significant differences were observed.
Comparing differences between peak average heart rate values post MVO2 over the three
testing periods (0 wks, 4 wks, post 7 wks SC SIT), between non-weighted and weighted