Jurnal Teknologi, 49(F) Dis. 2008: 1–7 © Universiti Teknologi Malaysia
POTENTIAL RISK OF PARAFFIN WAX – RELATED PROBLEMS IN MALAYSIAN OIL FIELDS
EKEH MODESTY KELECHUKWU1* & ABU AZAM MD YASSIN2
Abstract. Paraffin wax deposition in production system constitutes a critical concern to crude exploration and production operations. The unwanted effect of wax deposition can cause serious production impairment and other associated hazardous risk. While its curative approaches and production losses adds to colossal economic sabotage to the petroleum industry. The strategy employed in this study was to use temperature and fluid characterization analysis of Malaysian crude to predict the potential for paraffin wax related problems in Malaysian oilfields. This approach defined the oilfields with probably high risk of wax deposition potential amongst Malaysian crude. The synopsis of this paper proved that some Malaysian oilfield presents a potentially serious problem.
Keywords: Paraffin wax; deposition tendency; risk
1.0 INTRODUCTION
Wax deposition problems constitute critical production concerns to the oil exploration practitioners. Waxes are typically long, straight n-paraffin chains within the produced oil. At elevated temperatures, they usually remain dissolved within the oil. At temperatures below the cloud point, the n-paraffin components begin to crystallize into solid wax particles.
Deposition of n-paraffin typically occurs when the wax – containing oil comes in contact with any surface having a temperature below the cloud point, providing a heat sink and concentration gradient. The deposition process can ultimately lead to reduction of the internal diameter of the tubular, restricting and complete blockage of pipeline and can increase surface roughness on the pipe wall, causing increased pumping pressure and reduce throughput.
All of these problems may result in production shutdowns and hazardous conditions and will require extensive workovers, production losses and possibly irreparable damage requiring equipment abandonment and replacement. The occurrences of this problem are not allocated to any particular geographical area nor is it limited to a specific type of crude (Sudbury et al., 1955).
The operating temperature, its decrease and paraffinic hydrocarbon content of crude oil are known to play a pivotal role for potential wax problem. Once a radial temperature
1&2Department of Petroleum Engineering, Faculty of Chemical and Natural Resources Engineering,
difference is established between the crude oil and the pipe wall, it leads to concentration gradient, and hence the oil temperature decreases below the wax appearance temperature (WAT) of the oil, there would be a high possibility of wax deposition (Creek et al., 1999; Rebbapragada, 2004). Hence the solubility of paraffin in the oil is a dependent of the decreasing function of temperature and molecular weight of its constituents, (Paso and Fogler, 2003).
However, accurate fluid characterization is an important component of any development, production, or intervention strategy for managing waxy crude. Understanding the potential and threat to deposit can help avoid high cost resulting from output reductions or other associated production risk. Either situation can occur when production facilities or intervention strategy are designed on the basis of incomplete estimate of the potential of wax related problems.
Therefore, this study employed the use of temperature and fluid characterization analysis of Malaysian crude to predict the potential for paraffin wax related problems in Malaysian oil fields.
2.0 EVOLUTION OF WAX DEPOSITION PROCESS
Wax deposition is initiated by the precipitation of wax directly on the pipe wall and the formation of a network (Singh et al., 2002), of wax crystals (wax-oil gel), with significant amount of oil trapped in it, as temperature change super-saturate the system (Weingarten and Euchner, 1988). When a waxy crude is cooled, it gels due to the formation of a network of wax crystals, which exhibits strong physical interaction and affinity that precipitates in the formation of stable wax crystals that inter-lock to form a solid network (Wardhaugh and Boger, 1991). The high molecular weight paraffins (waxes) are known to be responsible for some of the problems that are encountered during crude production. At a high temperature and pressure in the reservoir, the solubility of these compounds is sufficiently high to keep them fully dissolved in the mixture (Norman, F. C., 1989), and the crude oil behaves as a Newtonian fluid with a low viscosity.
Once the crude oil leaves the reservoir and flows through the tubing and pipelines, its temperature begins to drop due to the ambient conditions.
The fact that solubility of high molecular weight paraffins decreases drastically with decreasing temperature, leads to the formation of stable wax crystals at low temperatures. The wax particles start appearing in the crude oil, when the oil temperature drops below its solubility limit.
3.0 WAX DEPOSITION MECHANISM
The mechanism of paraffin wax deposition area governed by molecular diffusion of wax molecules; shear dispersion of wax crystallites and Brownian diffusion of wax crystallites. Gravity settling of paraffin crystals in flow line conditions is negligible, because it’s dominated by shear dispersion (Burger et al., 1981). Molecular diffusion is the deposition mechanism prevalent for tubing deposition in flowing well that maintains oil temperature, well above the cloud point until the oil is coming up the tubing (Bern et al., 1980; Leiroz and Azevedo, 2005)
Deposition is enhanced as result of lateral transportation by the above named factors. In wax deposition mechanism process, a concentration gradient is produced in the oil as a result of temperature gradient profile, due to increasing solubility of waxes with increasing temperature. The concentration caused waxes in solution to diffuse from the warmer oil, which has a greater concentration of dissolved waxes, to the colder oil, which has a lower concentration, resulting to molecular diffusion of the paraffin crystals towards the surface wall.
4.0 FACTORS RELATING TO PARAFFIN DEPOSITION PROBLEMS
The solubility of the paraffin waxes is very sensitive to temperature variation. Paraffin can precipitate from crude when equilibrium conditions change slightly, causing a loss of solubility of the paraffin in the crude. The point of deposition in the well producing system is normally determined by how close the crude is to its solubility saturation point and the amount of paraffin in the crude, (Allen and Roberts, 1993).
The temperature is probably the most common cause of paraffin deposition, though many other factors can affect the process, because paraffin solubility in crude decreases as the temperature is lowered. Cooling of crude occurs in many places in the well production system.
Expansion of oil and associated gas at the reservoir, through casing perforations, or through bottom hole screen causes cooling. As the crude moves upwards through the tubing, surface choke, through the flow line, it experiences additional cooling. At some point in the system, the temperature drops below the wax melting point, and paraffin may start to accumulate on production equipment.
Loss of gas and light hydrocarbons from crude also decreases paraffin solubility. This effect facilitates paraffin deposition in production system. High gas-oil ratio magnifies paraffin deposition problems.
5.0 CHARACTERIZATION OF MALAYSIAN CRUDES
Table 1 presents preliminary results of crude samples from various oil fields in Malaysia, generated at the unipem laboratory of the Universiti Teknologi Malaysia. The oils vary in vary greatly in their characteristics.
They vary in colour from black to light brown, and density measured at 15°C,
varies from 0.80 to 0.98 g/cm3, viscosity at 40 °C varied between 3.83 to 37.50 cSt and
at 70 °C varies from 2.25 to 32.50 cSt.
Water content in all the sampled crude were very minimum, (less than 1% vol.). The API Gravity ranges from light oil to heavy crude oil, (12.6 to 44.5) respectively,
while pour point varies between 18 to 36 °C.
The result data of the samples understudy showed that Penara contains the highest percentage of wax content followed by Bunga Kekwa and Dulang, while Tapis had the lowest wax percentage.
There was also a clear correlation between high density and low API Gravity, while a qualitative correlation confirmed higher pour point with higher wax content amongst the analyzed samples.
6.0 RESULTS AND DISCUSSION
Five crude samples from different oil fields around Malaysia were analyzed in this study.
Table 1 identifies the crude oils and presents some of their general properties. Working on the premises that a difference in the wax content wt % amongst these various crudes was responsible for the difference in viscosity behavior as temperature decreases. The more wax content, the more increase in wax appearance temperature (WAT) of crude oil, and the higher the cloud point of a crude oil is the more paraffin problems will be encountered in a well or oilfield.
Consequently their tendency to wax problem will also differ. Even though the waxy components in some crude are directly responsible for the high pour point, previous attempts from the open literatures, to correlate the pour point with the wax content of crude have not proven very successful.
Table 1 Physiochemical properties of some Malaysian oil fields
Types of Density Viscosity Viscosity API Pour Water Wax
Malaysian g/cm3 (cSt) (cSt) Gravity point content content
Crude @ 15°°°°°C @ 40°°°°°C @70°°°°°C oC % vol. % wt
Penara 0.9165 37.50 32.50 22.8 36 0.5 18 Bunga 0.9255 14.52 4.119 21.3 36 0.2 20.2 Kekwa
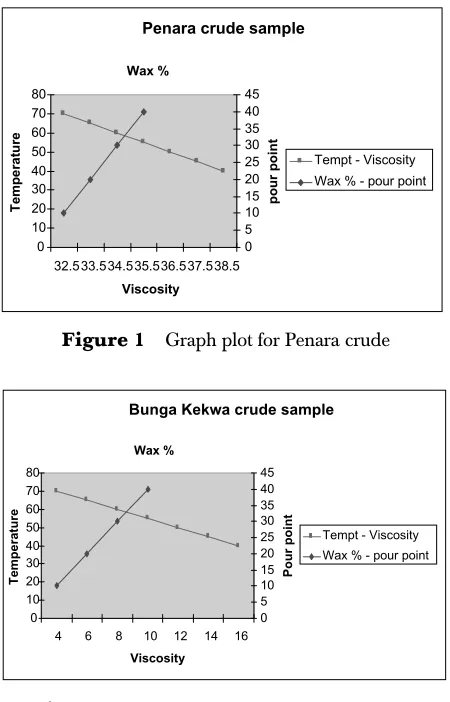
Figure 1 Graph plot for Penara crude
Figure 2 Graph plot for Bunga Kekwa crude
Bunga Kekwa crude sample
0 10 20 30 40 50 60 70 80
4 6 8 10 12 14 16
Viscosity Te mpe ra ture 0 5 10 15 20 25 30 35 40 45 Wax % Pour point
Tempt - Viscosity Wax % - pour point Penara crude sample
0 10 20 30 40 50 60 70 80 32.533.534.535.536.537.538.5 Viscosity Te m p er at ur e 0 5 10 15 20 25 30 35 40 45 Wax % po ur p o int
Tempt - Viscosity Wax % - pour point
For crudes used in this study, qualitative correlation showed an average fit between the pour point and the wt % waxes present, as reported by Ralulowski et al., 2000 and Norman, J. H., 1995. The viscosity behavior of most of the crudes were very sensitive to temperature change. The increase in viscosity as the temperature decreases exhibited in this study showed a good agreement with previous work done by P. Singh et al., 2001.
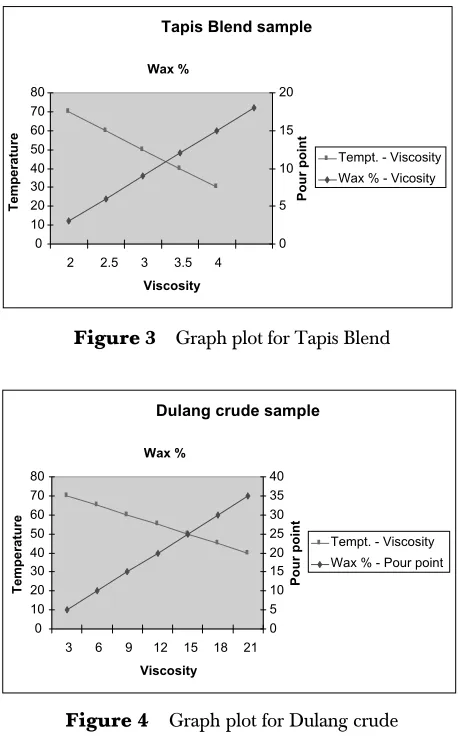
Figures1 to 4 shows the characteristic temperature-viscosity and its equivalent plots for crude samples from Penara, Bunga Kekwa, Tapis and Dulang oil fields in Malaysia. It’s evident from these plots that these crudes differ in their rheological properties due to differences in wax wt % content.
From the plots of the analyzed samples presented in Figures 1 to 4.
The same scenario is average for Dulang crude as observed in Figure 4.
As regards Tapis Blend, plot presented in Figure 3, indicated the least possibility of waxing tendency conformable as the parameters understudy remained minimum at low temperature.
7.0 CONCLUSION
This study offers a preliminary explanation for the probable unfavorable characteristics of some Malaysian crude, and attempts to facilitate a better understanding between the crude properties and its behavior at ambient conditions.
From the oilfield samples evaluated in this study, majority of the crude properties may influence not only its behaviors at ambient conditions, but may exhibits several non-Newtonian behavior, i.e. viscosity varying by several orders of magnitude at a given temperature which has propensity for potential wax problems during production and shutdown operations.
Figure 4 Graph plot for Dulang crude
Figure 3 Graph plot for Tapis Blend
Tapis Blend sample
0 10 20 30 40 50 60 70 80
2 2.5 3 3.5 4
Viscosity Temp er atur e 0 5 10 15 20 Wax % P o ur po in t
Tempt. - Viscosity Wax % - Vicosity
Dulang crude sample
0 10 20 30 40 50 60 70 80
3 6 9 12 15 18 21
Viscosity Te mper ature 0 5 10 15 20 25 30 35 40 Wax % Pou r po int
In addition to temperature and viscosity, the pour point of these oils is also influenced by the percentage of wax content in the crude.
This approach can be used to evaluate the rheological behavior and wax deposition tendencies of other crudes.
REFERENCES
[1] Sanjay, M., B. Simanta and S. Kulwant. 1995. Paraffin Problems in Crude Oil Production and Transportation: A Review. SPE, Oil and gas corp. Ltd., SPE prod. And Facilities, Feb.
[2] Garcia, M. C. 2001. Paraffin Deposition in Oil Production. SPE 64992, SPE int. symposium. On Oilfield Chemistry, Houston, TX, Feb. 13-16.
[3] Weingten J. S., J. A., Euchner. 1986. Methods for Predicting Wax Precipitation and Deposition. SPE 15654, 61st Annual Technical Conference and Exhibition – New Orleans, Oct.
[4] Buger, E. D., T. K. Perkins, J. H. Striegler. 1981. Studies of Wax Deposition in the Trans Alaska Pipeline”, JPT, June.
[5] Wardhaugh, L. T., D. V. Boger. 1991. Flow Characteristics of Waxy Crude Oils: Application to Pipeline Designs, AIChe Journal, June.
[6] Hunt, E. B., Jr. 1962. Laboratory Studies of Paraffin Deposition, JPT. 1259-1269. [7] Jorda, R. M. 1966. Paraffin Deposition and Prevention in Oil Wells. JPT. 1605-1612.
[8] Victor, A. Adewusi. 1997. Prediction of Wax Deposition Potential of Hydrocarbon Systems from Viscosity-Pressure Correlations.
[9] Zulkania, A., B. Pramudono, H. B. Mat, A. K. Idris and M. Manan. 2001. Malaysian Crude Oil Emulsions: Physical and Chemical Characterizations.
[10] Elsharkawy, A. M., T. A. Al-Shhaf, M. A. Fahim. 2000. Wax Deposition from Middle East Crudes. [11] Maria Del Carmen Garcia. 2001. Paraffin Deposition in Oil Production.
[12] Nagar, A., V. K. Mangla, S. P. Singh and J. Kachari. 2006. Paraffin Deposition Problems of Mumbai High. [13] Thomas, S. Golezynski. 2006. Understanding Wax Problems Leads to Deepwater Flow Assurance Solutions:
Interpretation of Lab Measurements Provides Pigging and Treating Rules of Thumb. [14] Norman, F. Carnahan. 1989. Paraffin Deposition in Petroleum Production.