Abstract
Berger, Rebecca Riley. Fiber Reactive Dyes with Improved Affinity and Fixation Efficiency. (Under the direction of Dr. C. Brent Smith and Dr. Harold S. Freeman)
Although fiber reactive dyes are widely used in the dyeing of cellulosic materials, several economical and environmental problems are associated with their application. Problems include residual color in wastewater, cost of wastewater treatment, raw material cost (salt, dye, and water), and quality of goods produced are examples of areas where improvements are needed. The afforementioned costs could be reduced by increasing the fixation efficiency and exhaustion of reactive dyes. In turn, fixation efficiency and exhaustion could be increased by increasing dye-fiber affinity.
Commercial Yellow Dye
N N Cl
N N
Cl
HN N
SO3H HO3S
SO3H H2N-C-HN
O N N N Cl Cl N SCH 2CHRNH N N N
SCH2CHRNH
HN N
SO3H HO3S
SO3H H2N-C-HN
O N N N Cl Cl N SCH
2CHRNH2
N
N N
SCH2CHRNH2
HN N
SO3H HO3S
SO3H H2N-C-HN
O
Synthesis of types 1 (R = CO2H) and 2 (R = H) Teegafix yellow dyes.
N N Cl
N N
SCH2CHRNH
HN N
SO3H HO3S
SO3H
H2NCHN
O N N
N N Cl N H N
HO3S
SO3H
HO3S
NHCNH2
O Commercial Yellow Dye
N N Cl
N N
Cl
HN N
SO3H HO3S
SO3H H2N-C-HN
O
N N Cl
N N
SCH2CHRNH2
HN N
SO3H HO3S
SO3H H2N-C-HN
O
OH NH2
HO3S SO3H
N N HO3S
SO3H N
N SO3H HN N N N Cl Cl
SO3H NH
OH
HO3S N N SO3H
N N N
Cl
Cl
Commercial red (left) and blue (right) dyes used in this study.
In this study, the affinity of the new structures has been assessed using equilibrium exhaustion and dyeing experiments. Equilibrium exhaustion experiments were conducted on the four dye types at two temperatures and four salt concentrations. Types 2 and 4 dyes had a greater affinity on cotton than the corresponding commercial dyes. These two dye types were examined further in dyeing experiments.
Fiber Reactive Dyes with Improved
Affinity and Fixation Efficiency
by
Rebecca R. Berger
A thesis submitted to the Graduate Faculty of North Carolina
State University in partial fulfillment of the requirements for the
Degree of Masters of Science
Textile Chemistry
Raleigh
2005
Approved By:
__________________________ __________________________ Dr. C. Brent Smith Dr. Harold S. Freeman Co-chair of Advisory Committee Co-chair of Advisory Committee
__________________________ __________________________
Dedication
Biography
Acknowledgments
I would like to thank Dr. Smith and Dr. Freeman for their guidance and
support throughout this work. A special thank you to Aaron Horton for his hard work and time with the collection of data and other laboratory tasks. Also thanks to Dr. Malgorzata Szymczyk for the synthesis of the dyes that were used in the
experiments and to Dr. Ahmed El-Shafei for his work on structures and modeling. I would like to thank the Institute of Textile Technology for their financial support and expertise. Thanks to Dr. Henry Boyter, Jr., Mr. Chris Moses, Dr. Lei Qian, Mr. Shiqi Li, and Mrs. Patrice Hill for their time, support and knowledge. I greatly appreciate the honor of being an ITT Fellow it was a wonderful opportunity and experience. Also I would like to thank Mrs. Jaime Pisczek and Mr. Kevin Hyde for listening, helping and time during this work.
Special thank you goes to my parents who have always supported and believed in me. Also thanks to Clay for teaching me how to color in the lines and ride my bike, and for being the best big brother. Lastly and most important, I would like to thank my husband, Mike, for pushing me to try something new and for
Table of Contents
LIST OF FIGURES………….………...VII
LIST OF TABLE…….……….IX
1. INTRODUCTION ... 1
2. LITERATURE REVIEW... 2
2.1 CELLULOSIC FIBERS... 2
2.1.2 Cellulose Chemical Structure ... 2
2.1.2 Cellulose in the Presence of Alkali ... 4
2.2 REACTIVE DYES... 4
2.2.1 History of Reactive Dyes... 5
2.2.2 Reactive Groups ... 8
2.2.3 Dye Classes (Chromogens) ...12
2.2.4 Kinetics ... 16
2.2.5 Application of Reactive Dyes ... 19
2.2.5.1 Substantivity... 20
2.2.5.2 Electrolyte...21
2.2.5.3 Bath ratio ...21
2.2.5.4 Alkali... 22
2.2.5.5 Temperature ... 23
2.2.5.6 Typical Procedure ... 24
2.2.5.7 Continuous Dyeing... 24
2.3 ENVIRONMENTAL CONSIDERATIONS... 26
2.3.1 Color... 26
2.3.2 Salt ... 28
2.4 PROJECT PROPOSAL... 29
2.4.1 Types of Dyes ... 29
2.4.2 Dye Characteristics ... 30
2.4.3 Dye Synthesis ... 31
2.4.4 Chromophore Moiety... 33
2.4.5 Linking Groups ... 34
2.4.6 Leaving Groups ... 35
3. EXPERIMENTAL METHODS AND PROCEDURES... 36
3.1 GENERAL INFORMATION... 36
3.2 DYEING PROCEDURES... 37
3.2.1 End-of-process Dyebath Analysis Procedures ... 37
3.2.2 Equilibrium Exhaustion Procedure ... 38
3.2.2.1 Dye Exhaustion studies for Commercial, Types 1, 2, and 3 Dyes... 39
3.2.2.2 Dye Exhaustion studies for Type 4 Dyes ... 39
3.2.3 Laboratory Dyeing Procedure ...40
3.2.2.1 Temperature... 41
3.2.2.2 Salt ... 42
3.2.2.3 Alkali... 42
3.2.3 Washing Procedure ... 42
3.2.4 K/S Data Collection ... 43
3.3 PHYSICAL TESTING PROCEDURES... 43
3.3.1 Color Fastness to Light ... 43
3.3.3 Color Fastness to Crocking... 44
3.4 COMPUTATIONAL PROCEDURES... 45
3.4.1 Determination of Dye in Solution (cs) ... 45
3.4.2 Calculation of Dye in the Fiber (cf) ... 45
3.4.3 Calculation of Percent Exhaustion (%E) ... 46
3.4.4 Calculation of Percent Fixation (%F)... 46
3.4.5 Calculation of the Substantivity Ratio (K)... 46
3.3.6 Calculation of Apparent Standard Affinity (-∆µ°)... 46
3.3.7 Calculation of Apparent Standard Heat of Dyeing (∆H°) ... 47
4. RESULTS AND DISCUSSION... 49
4.1 SUBSTANTIVITY RATIO... 49
4.1.1 Equilibrium Exhaustion... 49
4.1.2 Laboratory Dyeings ... 58
4.1.2.1 Fixation Ratio ... 60
4.2 K/SDATA... 68
4.2.1 Equilibrium Exhaustion... 69
4.2.2 Laboratory Dyeings ... 72
4.4 APPARENT STANDARD AFFINITY AND HEATS OF DYEING... 75
4.4.1 Equilibrium Exhaustion Experiments ... 76
4.4.2 Laboratory Dyeings... 86
4.5 STRUCTURES AND REACTIVITY... 87
4.6 PHYSICAL TESTING... 91
4.6.1 Color Fastness to Light... 91
4.6.2 Color Fastness to Water ... 92
4.6.3 Color Fastness to Crocking ... 92
5. CONCLUSIONS ... 94
6. RECOMMENDATIONS FOR FUTURE WORK ... 96
7. WORK CITED... 97
APPENDIX A...101
APPENDIX B...120
List of Figures
FIGURE 2.1CELLULOSE (200-10,000 DP)... 3
FIGURE 2.2TREATMENT OF CELLULOSE. ... 6
FIGURE 2.3MOLECULAR STRUCTURE OF A FIBER REACTIVE DYE... 7
FIGURE 2.4PRODUCTS OF DICHLOROTRIAZINES. ... 8
FIGURE 2.5REACTION OF MONOCHLOROTRIAZINES WITH FLUORINE AND TERTIARY AMINE. ... 9
FIGURE 2.6REACTION REMAZOL DYES WITH CELLULOSE. ... 9
FIGURE 2.7HALOPYRIMIDINE... 10
FIGURE 2.8DICHLOROQUINOXALINES. ... 10
FIGURE 2.9C.I.REACTIVE RED 120. ...11
FIGURE 2.10 BIREACTIVE DYE WITH MONOCHLOROTRIAZINYL... 11
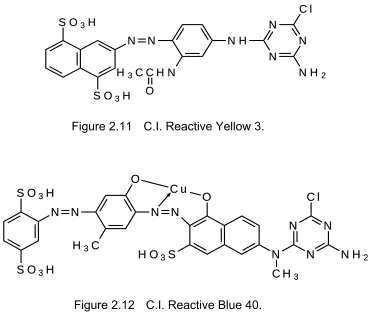
FIGURE 2.11C.I.REACTIVE YELLOW 3. ... 13
FIGURE 2.12C.I.REACTIVE BLUE 40... 13
FIGURE 2.13C.I.REACTIVE BLUE 5... 14
FIGURE 2.14CIREACTIVE BLUE 204...14
FIGURE 2.15FORMAZAN DYE STRUCTURE... 15
FIGURE 2.16C.I.REACTIVE BLUE 7... 16
FIGURE 2.17TYPE 1 YELLOW DYE. ... 29
FIGURE 2.18TYPE 2 YELLOW DYE. ... 30
FIGURE 2.19TYPE 3 YELLOW DYE. ... 30
FIGURE 2.20TYPE 4 YELLOW DYE. ... 30
FIGURE 2.21 SYNTHESIS OF TYPES 1 AND 2TEEGAFIX YELLOW DYE………..…....…….32
FIGURE 2.22 SYNTHESIS OF TYPES 3 AND 4TEEGAFIX YELLOW DYES …..……….….32
FIGURE 2.23TYPES 1 AND 2TEEGAFIX RED DYES ………..……….…33
FIGURE 2.24TYPES 3 AND 4TEEGAFIX RED DYES ………...……….. 33
FIGURE 2.25TYPES 1 AND 2TEEGAFIX BLUE DYES………...34
FIGURE 2.25TYPES 1 AND 2TEEGAFIX BLUE DYES………...34
FIGURE 4.1K VALUES FOR EXHAUSTION EQUILIBRIUM OF YELLOW DYES AT 30°C. ... 52
FIGURE 4.2K VALUES FOR EXHAUSTION EQUILIBRIUM OF BLUE DYES AT 30°C... 53
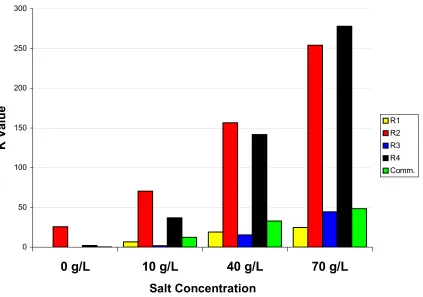
FIGURE 4.3K VALUES FOR EXHAUSTION EQUILIBRIUM OF RED DYES AT 30°C. ... 54
FIGURE 4.4PERCENT EXHAUSTION FOR EXHAUSTION EQUILIBRIUM OF YELLOW DYES AT 30°C. ... 55
FIGURE 4.5PERCENT EXHAUSTION FOR EXHAUSTION EQUILIBRIUM OF BLUE DYES AT 30°C... 56
FIGURE 4.6PERCENT EXHAUSTION FOR EXHAUSTION EQUILIBRIUM OF RED DYES AT 30°C. ... 57
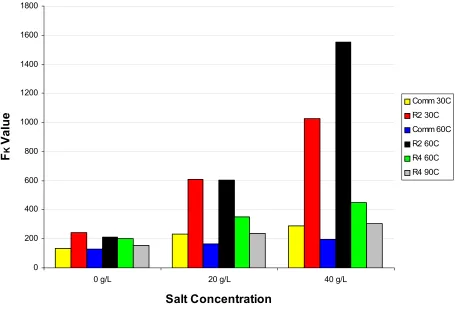
FIGURE 4.7FK VALUES FOR LABORATORY DYEINGS AT 0.25% FOR THE RED DYES... 63
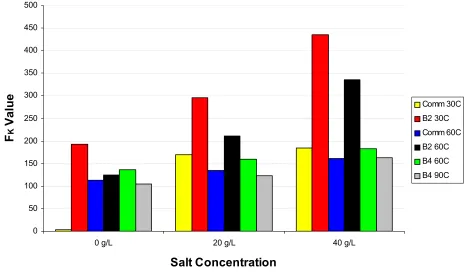
FIGURE 4.8FK VALUES FOR LABORATORY DYEINGS AT 0.25% FOR THE BLUE DYES. ... 64
FIGURE 4.9FK VALUES FOR LABORATORY DYEINGS AT 0.25% FOR THE YELLOW DYES... 65
FIGURE 4.10PERCENT FIXATION FOR LABORATORY DYEINGS AT 0.25% FOR RED DYES. ... 66
FIGURE 4.11PERCENT FIXATION FOR LABORATORY DYEINGS AT 0.25% FOR BLUE DYES... 67
FIGURE 4.12PERCENT FIXATION FOR LABORATORY DYEINGS AT 0.25% FOR YELLOW DYES. ... 68
FIGURE 4.13K/S VALUES FOR EXHAUSTION EQUILIBRIUM OF YELLOW DYES AT 30°C... 70
FIGURE 4.14K/S VALUES FOR EXHAUSTION EQUILIBRIUM OF RED DYES AT 30°C... 71
FIGURE 4.15K/S VALUES FOR EXHAUSTION EQUILIBRIUM OF BLUE DYES AT 30°C. ... 72
FIGURE 4.16K/S VALUES FOR RED DYES AT 1.00%(OWF)... 73
FIGURE 4.17K/S VALUES FOR BLUE DYES AT 1.00%(OWF). ... 74
FIGURE 4.18K/S VALUES FOR YELLOW DYES AT 1.00%(OWF)... 75
FIGURE 4.19APPARENT STANDARD AFFINITY FOR THE RED DYES IN EQUILIBRIUM EXHAUSTION EXPER... 75
FIGURE 4.20APPARENT STANDARD AFFINITY FOR THE BLUE DYES IN EQUILIBRIUM EXHAUSTION EXPER.. .... 78
FIGURE 4.21APPARENT STANDARD AFFINITY FOR THE YELLOW DYES IN EQUILIBRIUM EXHAUSTION EXPER... 79
FIGURE 4.22 TEMPERATURE DEPENDENCE OF EQUILIBRIUM CONSTANT FOR RED DYES. ... 83
FIGURE 4.23TEMPERATURE DEPENDENCE OF EQUILIBRIUM CONSTANT FOR BLUE DYES. ... 84
FIGURE 4.25TYPE 1YELLOW DYE STRUCTURE... 88
FIGURE 4.26TYPE 2YELLOW DYE STRUCTURE... 88
FIGURE 4.27TYPE 3YELLOW DYE STRUCTURE... 89
List of Tables
TABLE 3.1CHEMICAL LIST AND SUPPLIERS. ... 37
TABLE 3.2ADDITION OF SALT SOLUTION TO TYPE 4 DYES... 40
TABLE 3.3DYEING PROCEDURE OUTLINE. ... 41
TABLE 3.4WASHING PROCEDURE... 43
TABLE 4.1KVALUES FOR EQUILIBRIUM EXHAUSTION OF RED DYES AS A FUNCTION OF TEMPERATURE & SALT CONCENTRATION. ... 51
TABLE 4.2KVALUES FOR EQUILIBRIUM EXHAUSTION OF BLUE DYES AS A FUNCTION OF TEMPERATURE & SALT CONCENTRATION. ... 51
TABLE 4.3KVALUES FOR EQUILIBRIUM EXHAUSTION OF YELLOW DYES AS A FUNCTION OF TEMPERATURE & SALT CONCENTRATION. ... 51
TABLE 4.4EXPERIMENTAL DESIGN FOR RED DYES... 59
TABLE 4.5FK VALUES FOR LABORATORY DYEINGS INVOLVING YELLOW DYES. ... 61
TABLE 4.6FK VALUES FOR LABORATORY DYEINGS INVOLVING BLUE DYES... 62
1. Introduction
Numerous reactive dyes are commercially available for coloration of cellulosic substrates. Although reactive dyes are one of the most common dyes utilized in the dyeing of cotton and other fibers, they still cause significant environmental concerns for the textile industry in the USA and Europe. Wastewater treatment of pollutants (color and salt) from dyeing is difficult to conduct economically. One method to reduce residual color in wastewater is to increase exhaustion (E) and fixation (F) values of reactive dyes. Increasing the exhaustion and fixation not only decreases the level of color in the effluent, but the application will require lower levels of electrolytes, with an associated reduction of aquatic toxicity of effluent.
This purpose of this research was to evaluate the performance of four homobifunctional reactive dyes that were synthesized by a straightforward modification of commercially available fiber reactive dyes. Based on the
2. Literature Review
2.1 Cellulosic
Fibers
Cellulose is the most abundant naturally occurring polymer. Land plants produce cellulose as one of the main structural units, the cell wall. Cellulose has proven useful as a raw material for many industrial products. The textile industry uses many types of cellulosic materials: cotton, flax, hemp, jute, and regenerated cellulosic fibers such as Rayon, Tencel and Lyocell (Preston, 1986).
The Gossypium plants produce seed hair, which is commonly known as
cotton. Throughout the world there are many species of cotton produced for their own unique properties. Species variations can include staple length, strength, elongation at break, uniformity ratio, fineness (micronaire), color and trash content. For the calendar year 2000, it was determined that ~42% of all textile raw materials were derived from cotton (Taylor, 2000). The vast majority of these products were dyed.
2.1.2 Cellulose Chemical Structure
O H O H H H O H
C H2O H
H O O H O H H H O H
C H2O H
H O O 6 5 4 3 2 1 n
Figure 2.1 Structure of Cellulose (200-10,000 dp).
Cellulose forms a ribbon-like structure, which is capable of bending and twisting due to the oxygen bridges that connect the glucose rings. Six hydroxyl groups protrude from each cellobiose repeat unit in the chain. These aid in the stability of the molecule by forming intermolecular and intramolecular hydrogen bonding (Salmon, S. 1995 and Sangwatanaroi, U, 1995). The hydrogen bonds in the chains help connect the neighboring chains together in the structure. Intermolecular hydrogen bonds formed between the O-6-H and the O-3 are to stabilize the structure of Cellulose I (Klemm et al, 1998). The degree of polymerization (DP) for cellulose depends on the source. The DP can be as low as 200 for regenerated celluloses and as high as 10,000 for natural cellulose fibers such as cotton (Morton et al, 1993).
spiral angle for cellulose depends on the source. Cotton has a spiral angle of 20°- 30°. Flax, jute and hemp have a smaller spiral angle of 6°, which provide these fibers with higher strength (Morton et al, 1993).
2.1.2 Cellulose in the Presence of Alkali
When cellulose (CellOH) is treated with alkali (OH⎯), a cellulosate anion (CellO⎯) is formed. The ionization equation for this reaction is:
CellOH
+
OH⎯↔
CellO⎯+
H20This anion is capable of reacting with suitable dyes by nucleophilic substitution or additions to form covalent bonds (Rattee, 1969). Vickerstaff provided the evidence for reactive dyes forming covalent bond with the cellulosate anion (Vickerstaff, 1957).
Esterification of cellulose is possible with most inorganic and organic acids by methods similarly used with simple alcohols. Through the esterification reaction of the cellulose molecules acetates can be formed. Acetates are important textile fibers and are used in the formation of industrial products (sheeting and moulded plastics). Acetylation is usually achieved through the addition of acetic anhydride and an added acid catalyst (Preston, 1986). The reaction can be written as:
CellOH + (CH
3CO)
2O + Acetic Acid
→
CellOCOCH
3+ CH
3COOH
2.2 Reactive
Dyes
dyeings with very high wet fastness properties. Reactive dyes are most often used on cellulose, but can be used on fibers such as nylon and wool (Rattee, 1962). Reactive dyes are popular in textile manufacturing due to their fastness properties. These dyes have gained popularity over time and in the year 2000 represented 20-30% of the total dye market, with usage estimated to reach 50% at the end of 2004 (Vandevivere, P, 2000). Since the development of reactive dyes, there have been several useful review papers pertaining to their development, application and usage (Alsberg, 1982, Rattee, 1969, Ratte, 1984).
2.2.1 History of Reactive Dyes
During the 20th century, wool and cotton were two obvious choices as a substrates for the development of reactive dyes, due to the presence of nucleophilic groups. Wool contains many sites that could possibly react with a dye molecule such as, amino, carboxyl, mercapto, and hydroxyl groups. The primary and secondary hydroxyl groups are the reactive sites for cellulosic fibers. Although there was some interest in wool the main interest lied with the cellulose fibers. Starting as early as 1890, there were years of research conducted in search of a fiber reactive dye (Beech, 1970).
When the first research was conducted on fiber reactive dyes it was believed that the cellulose materials needed to be treated harshly and under nearly
degradation of the fiber (Ratte, 1984). Work completed in 1895 involved treating cellulose fibers with strong caustic soda solution and was characterized by the reaction sequence shown in Figure 2.2. Following formation of the cellulosate anions benzoylation, nitration, reduction, diazotisation, coupling reactions were conducted (Preston, 1986).
Cell OH OH Cell ONa
"Soda Cellulose"
1) PhCOCl
2) HNO3
O2N C O Cell
O
[H] H2N C O Cell
O
HNO2 N C O Cell
O Cl N
PhN(CH3)2 N C O Cell
O
N
(CH3)2N
Figure 2.2 Formation of “red cellulose”.
These reaction conditions were much too harsh for the cellulose fibers and caused severe degradation.
ICI patented the first fiber reactive dyes, under the brand name "Procion®" in
1953. These dyes contained dichlorotriazine reactive groups, which were capable of reacting with CellOH at low temperatures (20-40°C) (Beech, 1970). In 1956,
reactive dyes were made commercially available. In 1957, it was reported by that a covalent bond was formed between reactive dye molecule and the substrate
(Vickerstaff, 1957). There have been many advances in reactive dyes since the first commercialization of the Procion® dyes. When the Procion® dyes were patented
triazine “reactive dye” without knowing that the dye was forming a covalent bond with cellulose. Ciba began marketing the MCT dyes as Cibacron® dyes in 1957
(Preston, 1986).
In the early 1950’s Hoechst developed reactive dyes for wool called
Ramalan®. In 1957, Hoechst brought their vinyl sulphone reactive dyes for cellulose
to the market. These dyes formed covalent bonds with cellulose in a different manner than the mono and dichlorotriazine reactive dyes. Like the triazines,
Remazol® dyes react with cellulose and form a cellulose ether (von der Eltz, 1971).
The molecular structure of reactive dyes (Figure 2.3) consists of a chromogen (C) with solubilizing groups (S), a bridging group (B), a reactive group (R) and a leaving group (X). The reactive groups are capable of reacting with nucleophilic groups (NH2, -SH, and –OH) in textile fibers by addition or substitution reactions. The chromogen, a conjugated system containing one or more chromophores, provides the color. The bridge separates the reactive group from the chromogen. The bridge prevents the color generated by the chromogen from changing once the chromogen is attached to the reactive group (Rivlin, 1992).
OH
NH N
N N
Cl
Cl HO3S
N N SO3H
R B
C
S
X
2.2.2 Reactive Groups
There are many different classifications of reactive groups utilized in the different types of reactive dyes. Monoreactive dyes can be based on, but not limited to, triazine, vinylsulfone, quinoxaline, and pyrimidine (Zollinger, 1991).
Cyanuric chloride is a very important synthetic compound because of the three chloride atoms on the triazine ring allow for convenient addition of various moieties (including cellulose) to the ring. By selecting the reaction conditions
carefully and accurately there is a wide array of dyes can be developed and applied. The reaction of cyanuric chloride with a chromophore containing an amino group produces a dichlorotriazinyl dye. Dichlorotriazinyl (DCT) dyes are highly reactive and are very sensitive to hydrolysis as shown in Figure 2.4 (Hunger et al, 2003).
Dye NH N
N N
Cl
Cl
Dye NH N
N N
OH
X X = Cl, OH
Figure 2.4 Hyrdolysis products of dichlorotriazine dyes.
If two chlorine atoms on the cyanuric chloride molecule undergo reaction, a
replacing the chlorine atom with a fluorine atom or through reaction with tertiary amines (Figure 2.5)(Preston, 1986).
Dye NH N
N N
Cl
R
Dye NH N
N N
F
R
Dye NH N
N N
R N
CO2H
Figure 2.5 Conversion of monochlorotriazines to the with fluoro and ammonium counterparts.
The Hoechst Remazol reactive dyes which have the 2-sulfoxyethyl-sulfonyl reactive group is another effective reactive group, which in the presence of alkali forms a vinylsulfone group that will react with cellulose to form an ether linkage (Figure 2.6) (von der Eltz, 1971).
Dye SO2CH2CH2OSO3H
OH
Dye SO2CH CH2
Cell OH
Halopyrimidine and dichloro-quinoxalines (Figure 2.7 and 2.8) are other types of dyes that include reactive groups. These react with cellulose in a manner
comparable to MCT and DCT dyes.
D y e N H
N
N C l C l
C l
Figure 2.7 The halopyrimidine reactive dye system.
Dye NHC O
N
N
Cl
Cl
Figure 2.8 The dichloroquinoxaline reactive dye system.
previously thought possible, in addition to increasing the fixation efficiencies (Renfrew et al, 1990).
NH
HN N
N N N
N N
Cl Cl
NH HN
OH OH
N N N
N SO3H
HO3S SO3H HO3S SO3H
HO3S
Figure 2.9 C.I. Reactive Red 120.
The reactive dyes that contain two different reactive groups are known as hetero-bireactive dyes. In the 1980s the hetero-bireactive dyes became more widespread on the reactive dye market (Renfrew et al, 1990). The most common combination is the monochlorotriazinyl group with the more reactive 2- sulfato
ethylsulfone group (Figure 2.10) (Hunger et al, 2003). With this system it is possible to obtain a wide variety of shades.
Dye NH
N
N
N
Cl
NH
SO
2CH
2CH
2OSO
2Na
Figure 2.10 Bireactive system with monochlorotriazinyl
The hetero-reactive dyes offer several advantages over traditional reactive dyes. They are less sensitive to temperature and provide better reproducibility of shade. The combination of these reactive groups also provides good fastness over a wide pH range.
There are also polyreactive dyes, which afford enhanced fixation and are less sensitive to alkali concentrations and salts (Renfrew, 1990). These dyes most commonly are synthesized from cyanuric chloride and are reacted with an amine with two aliphatic 2-chloroethylsulfonyl chains (Hunger , 2003).
2.2.3 Dye Classes (Chromogens)
The synthesis of fiber reactive dyes utilizes many different types of
chromogens in the development of the dyes. Producers of reactive dyes often use comparable chromogens, but their dyes vary in respect to the reactive groups used and the substitution pattern. Reactive dyes are generated from monoazo or disazo, anthraquinone, triphenodioxazine, and phthalocyanine systems. The structure of the chromogens used in the synthesis of reactive dyes has a direct influence on fiber affinity or substantivity and the diffusion coefficient (Beech, 1970).
shades (Hunger et al, 2003). C.I. Reactive Blue 40 is an example of a metal-complex disazo reactive dye structure (Figure 2.12).
S O3H
S O3H N N H3C C H N
N H N
N N
C l
N H2 O
Figure 2.11 C.I. Reactive Yellow 3.
S O3H
S O3H
N N
O
N N Cu
H O3S N
CH3
N N N
Cl
N H2
H3C
O
Figure 2.12 C.I. Reactive Blue 40.
O
O
NH2
NH
S O3H
S O3H
NH N
N N
Cl Cl
Figure 2.13 C.I. Reactive Blue 5.
Triphenodioxazine dyes have been commercially available since 1928. By replacing the substituents on the triphenodioxazine structure, different shades of red, orange, and blue can be generated. An example of a triphenodioxazine dye is C.I. Reactive Blue 204 (Figure 2.14). This dye class has several challenges when using them in the manufacturing setting such as tailing or the removal of unfixed dye (Hunger , 2003).
N O O N Cl Cl S O3H
S O3H
NH(CH2)3NH
N
N N
F NH
S O3H
HO3S HN(CH2)3HN
N
N N
F HN
HO3S
S O3H
Formazan dyes, which are copper complexes, constitute another type of chromogen utilized in reactive dyes. These dyes provide an alternative to the anthraquinone blues, and have good solubility and reactivity (Figure 2.15).
C u O N N
N N
O C O
H O 3 S
N H
S O 3H N
N N
F
N H S O 3 H
Figure 2.15 Formazan dye structure.
SO3H
NH N
N N
Cl H2N
SO2NH CuPc SO2NH2
(SO3H)2
CuPc = N
Cu N N
N N
N N
N
Figure 2.16 C.I. Reactive Blue 7.
2.2.4 Kinetics
Reactive dyes can react with either the –OH groups found in the cellulosic fibers or the –OH groups in the dyebath. For satisfactory dye application, the main objective is to obtain maximum fixation to the fiber and minimal hydrolysis by water.
Kinetic information involving homogenous (water and alcohol) and heterogenous (water and cotton) systems is discussed in several publications (Preston, 1986, Beech 1970, ICI Limited, 1962, Sumner et al, 1963, Sumner, 1965, Peters, A. 1996 and Rattee,1969, Ingemells, 1962), and is synthesized below.
Homogenous System (Water and Alcohol)
Homogenous solutions provide a simple way of looking at the competing reactions in reactive dye application. In this system the reactive dye is present in an alkaline solution of aqueous alcohol. The two competing reactions in this system are:
X-When the reactions occur simultaneously in a homogenous system, the
concentration of products formed at any given time, including at completion, is the ratio of the two reaction rates. The efficiency ratio of the alcoholysis reaction is the rate of alcoholysis over the rate of hydrolysis at time, t.
kOA * [DOA] = dA/dt = Efficiency Ratio kOH * [DOH] dH/dt
Since both reactions are bimolecular, the efficiency ratio can be written as Efficiency Ratio = RA [AO-]
[OH-]
where RA = kA/kH, the bimolecular reaction constants for alcoholysis and hydrolysis. In this system, the rate of disappearance of reactive or active dye ([DCl]) molecules over time is the sum of the rates of the two competing reactions. The simplified equation for the disappearance of active dye is:
d[D] = k’H[D]t dt
where k’H=kH(RA[AO-]t + [OH-]t). The parameters located within the equation are determined to be constant at any pH.
Heterogeneous System (Water and Cellulose)
When examining the two-phase system of water and cellulose, the reactions proceed at different rates within the phases. This leads to a much more complex analysis which, in fact, cannot be solved directly, but must be estimated by
consider the concentration of dye in the solution after a certain period of time. The equation is as follows:
dh/dt = kH[OH-][D]s
The rate of reaction in the substrate (cellulose) is a more complicated
situation, which has to take into consideration the diffusion of the dye within the fiber. For the reaction to proceed, the active dye must be in the same phase as the
substrate. Previous studies pertaining to the rate of diffusion of solution into a solid medium considered that the reaction would occur according to simultaneous first-order kinetics and diffusion (Danckwert, 1949). The rate of fixation for a dyeing of an infinitely thick slab of material in a bath with an infinite volume can determined from as this simplified equation:
dQ/dt = [D]f√(Dk’f)
where D is the diffusion coefficient, [D]f is the concentration of dye at the surface of the substrate and k’f is the pseudo first-order rate constant for the reaction for fixation of the dye in the substrate. The efficiency of fixation for the heterogeneous solution can be given by the ratio of the rate of fixation of the substrate and the rate of hydrolysis in the aqueous phase.
Efficiency of Fixation = df = [D]f√(Dk’f) dh [D]skH[OH-]s
Efficiency of Fixation = df = [D]f S √D RF [Cell-] dh [D]s L√k’H [OH-]
When evaluating these expressions it is easy to determine that the fixation efficiency is dependant on the substantivity ratio ([D]f / [D]s) and the diffusion coefficient of the dye and the cellulose (D). The reactivity ratio plays an integral role as well as the pH of the reaction (Beech, 1970). The variable S represents the structure of the fiber and L is the liquor ratio.
2.2.5 Application of Reactive Dyes
Batch and continuous methods of applying reactive dyes to cellulose have been established, according to the analysis provided in the sections above. When applying reactive dyes, it has been noted that individual dyes may behave differently from other dyes in the same class due to differences in reactivity, affinity, and
diffusion coefficient (Rattee, 1969).
Batch dyeing is a common method for applying reactive dyes to cellulose fibers. Batch machines used for reactive dyes application include beck, jet, jig, skein, package dyeing and paddle machines. There are three stages that make up the traditional fiber reactive dyeing process (Rivlin, 1992). The stages are:
1. Exhaustion of dye into the fiber under neutral conditions and in the presence of salt.
2.2.5.1 Substantivity
The affinity of a dye for a substrate can be defined as the combined strength of molecular interactions. Some of the molecular interactions involved in the dyeing process include van der Waals forces, hydrogen bonding, hydrophobic interactions, and electrostatic attraction. The substantivity of the dye is “less specific”, but leads to the estimation of exhaustion. The term substantivity is the attraction between the dye and the substrate under specific and precise conditions. Substantivity involves the preferential exhaustion of the dye from the bath into the substrate (Welham, 2000). Mathematically the substantivity is defined as [D]F/[D]S in the kinetic literature (Preston, 1986).
It should be noted that the substantivity value is not independent of the diffusion coefficient of the dye in the substrate. The magnitude of the substantivity value is mostly determined by the chemical nature of the chromophore and the fiber. The direct measurements for substantivity values under fixation conditions can be difficult to determine, but theoretical values have been reached through previous research on methods and applications (Sumner and Taylor, 1967). The theoretical values are useful in practical situations and are reasonably accurate in the prediction of trends (Sumner et al, 1967 and Liddell et al, 1974). The factors that influence the substantivity value are the bath ratio, salt concentration, temperature and pH of the system (Sumner, 1963).
continuous dyeing). If the substantivity is very high, the hydrolyzed form of the fiber reactive dye will remain on the fiber and will behave as a direct dye. Dyes of low substantivity are generally more soluble in water, which promotes better migration and leveling properties, as well as higher diffusion rates. The increase in the rate of diffusion will allow the dye to penetrate deeper further into the fiber (Beech, 1970).
2.2.5.2 Electrolyte
Reactive dyes behave like low-affinity direct dyes in a neutral solution. Consequently, increasing the amount of electrolyte added to the dyebath can
increase exhaustion during dye application. The most common electrolytes used in the batchwise processing are common salt (sodium chloride) and Glauber’s salt (sodium sulfate decahydrate). The salt requirements for the reactive dye application process are often four times the amount required for direct dyes (Beech, 1970). The need for the large electrolyte concentration is due to the low substantivity value. The role of electrolyte is to disrupt the structure of water and therefore to reduce hydration of dyes in the dyebath and dye sites in the fiber.
2.2.5.3 Bath ratio
The bath ratio, the ratio of the weight of the dyebath used to the weight of the goods, is one of the main variables that can be controlled by dyers during the
application process. When there is a reduction of the bath ratio there is an increase in the efficiency and the rate of dyeing. If dye concentration is increased, the
bath ratio will have an overall effect of increasing the efficiency of the process (Sumner et al, 1963, Preston, 1986). The use of lower bath ratios helps in the conservation of dye in the process. Additional losses of dye through the hydrolysis of the dye can be avoided when using smaller amounts of water in the application process.
2.2.5.4 Alkali
Alkali is added to the dyebath to achieve the fixation of dye on the fiber. When alkali is added to the dyebath it is possible for further exhaustion to occur. The
chemical bonding of the fiber and the dye can push the dynamic equilibrium of the dye molecules’ movement towards higher exhaustion.
2.2.5.5 Temperature
The temperature of the dye application process has optimal levels, which are dependant on the type of dyes used. It has been suggested that with every 20°C increase there is 1.5-2.5 fold decrease in the substantivity ratio (Preston, 1986). When the temperature is increased the substantivity ratio decreases and the reactivity increases. Both of these changes can cause a decrease in the efficiency (Preston, 1986). Dichlorotriazinyl dyes can be applied at room temperature due to their higher reactivities (Rattee, 1969). The cold dyeing temperatures of
2.2.5.6 Typical Procedure
A typical procedure for exhaust dyeing at high temperature is: (Rivlin, 1992)
1. Fill machine with water
2. Load substrate (yarn or fabric) 3. Heat to 50 °C
4. Add pre-dissolved reactive dyes to the bath
5. Raise the temperature 1 °C/ min until the bath reaches a temperature of 80 °C
6. During this time add salt to the bath in parts 7. Run for an additional 15 min
8. Add alkali over 15 min in parts 9. Run for an additional 45-75 min 10. Empty dyebath
11. Rinse substrate with warm water and then soapy warm water 12. Rinse final time with cold water
2.2.5.7 Continuous Dyeing
respect to the length of substrate is dependent on several factors. The factors are: the absorbency of the goods, temperature and time of absorption, volume of the pad, and rate of uptake liquor by the substrate (Marshall, 1966 and Procion® Dyestuffs, 1962). In the continuous dye application, two steps and one step methods are used.
Two-Step Process
In the two-step process dye and alkali are added in separate steps. The substrate is padded with the dye solution containing other necessary chemicals. The fabric is then dried and padded with aqueous alkali solution containing a large amount of salt. The fabric is steamed for 30- 60 seconds, and is washed several times to remove hydrolyzed dye (Rivlin, 1992).
One-Step Process
In the one-step method, the fabric is padded only once. There are two
2.3 Environmental
Considerations
Reactive dye application introduces certain environmental concerns. The dyeing process is extremely water-intensive and often requires large amounts of salt. A few dyes contain metals such as copper, nickel, chromium, or cobalt. These metals can be functional or can be impurities found in the dyes. The spent dyebaths and rinse water contain various amounts of salt, alkali, color, and auxiliary
chemicals, which require treatment to minimize their levels before being released into the environment. In the average textile dyeing facility, 1-2 million gallons of wastewater are generated daily (Taylor, 2004). The treatment of this large amount of wastewater requires a large initial and annual capital investment.
2.3.1 Color
The dyes and pigments used in textile processes are the main source of color in wastewater. These colorants are added during printing and dyeing operations in small quantities. After the process, 50-100% of the dye or pigment is fixed to the fiber or fabric. The remaining color is discarded as spent dyebaths or wastewater. Under typical reactive dyeing conditions 0-50% of the dye remains in the effluent. The color that remains is mainly hydrolyzed dye that is no longer capable of reacting with the fiber (Lee et al, 2004). The treatment methods for removal of colorants from wastewater are costly and not always effective. The color found in wastewater is an aesthetic pollutant that is readily detected through visual inspection. Color in
controlling the process can reduce waste generation in the form of color, alkali, and salt, in dyeing. Color can be reduced in the wastewater by using a dye with high or increased affinity and controlling the bath ratio. Maximizing the fixation of the reactive dyes also helps minimize dye washoff and this will decrease the amount of color in the wastewater.
Fiber reactive dyes are used often and require special attention because of the lower fixation levels. There are several important factors that are monitored to obtain maximum fixation and minimize color in the wastewater. These include bath ratio, salt usage, and adequate time for exhaust. Understanding its relationship with the affinity (K) and bath ratio (L) can maximize exhaustion (E). An important
relationship can be seen in the following equation: E = K/(K+L)
When the affinity of the dye decreases, exhaustion will decrease and the amount of color in the wastewater will increase (EPA, 1996).
2.3.2 Salt
Salt is becoming a growing concern environmentally in the textile industry. Electrolytes or salt are common additives in the dye process and in some processes are produced as by-products. The addition of salt to the dye process has been shown to increase the dyebath exhaustion (Peters, 1975). The added salt increases exhaustion by decreasing dye solubility in water (Smith, 1994).
Fiber reactive dyes often require a large amount of salt to achieve the necessary exhaustion. Salt requirements for fiber reactive dyes are much greater than amounts used with other dye classes to achieve the same exhaustion levels. The salt requirement for reactive dyes is 50% to 100% on the weight of the goods. The amount of salt discharged from a textile dyeing facility is approximately 400 million pounds per year (Smith, 1994). For example, raw wastewater from a
reactive dye process can contain as much as 9800 mg/L of chloride, while direct dye raw wastewater contain 61 mg/L of chloride (Smith, 1991). The average
2.4 Project
Proposal
Teegafix reactive dyes were generated from the reaction of chlorotriazine dyes with cysteamine or cysteine to generate homobireactive dyes with one or two chromogens. Results from preliminary investigations suggest that Teegafix dyes fixed at levels above those normally reported for reactive dyes. With this in mind an assessment of the affinity and fixation efficiency of chlorotriazine dyes developed and patented in 2002 by Procter and Gamble as Teegafix dyes is proposed.
2.4.1 Types of Dyes
There are four types of Teegafix homobireactive dyes that have been reported. The synthesis and potential utility of these dyes are discussed in several US Patents. The structures for the yellow versions of the new reactive dyes are shown in Figures 2.17-2.20. These four dyes will be used in the present study, along with the corresponding Teegafix forms of commercial red, blue, and yellow dichlorotriazine dyes (Figures 2.21-2.24).
N
N NH
SO3H
HO3S
SO3H
HN O
H2N
N N N
SCH2CHNH
SCH2CHNH
COOH
COOH
N
N N
Cl
Cl N
N N Cl
Cl
N
N NH
SO3H HO3S
SO3H HN
O H2N
N N N
SCH2CH2NH
SCH2CH2NH N N N Cl Cl N N N Cl Cl
Figure 2.18 Type 2 yellow dye.
N
N NH N
N N
Cl
SCH2CHNH N N N
Cl
NH N
N SO3H
HO3S
SO3H HN
O H2N
COOH
NH O
NH2
HO3S HO3S
SO3H
Figure 2.19 Type 3 yellow dye.
N
N NH N N N
Cl
SCH2CH2NH N N N
Cl
NH N N SO3H
HO3S
SO3H HN
O H2N
NH O
NH2
HO3S HO3S
SO3H
Figure 2.20 Type 4 yellow dye.
2.4.2 Dye Characteristics
concentrations and temperatures. Test results also suggest that the dyed substrates possess good lightfastness, wet and dry crock resistance, wash- fastness and dye-transfer staining.
2.4.3 Dye Synthesis
The Teegafix dyes used in this study were synthesized according to the sequences outlined in Figures 2.21 and 2.22 for the yellow dyes employed. Types 1 and 2 dyes were obtained by reacting one mole of the corresponding commercial dichlorotriazine reactive dyes per two moles of either cysteamine or cysteine followed by reacting the intermediate diaminotriazine with two moles of cyanuric chloride per mole of diaminotriazine. Types 3 and 4 dyes were obtained by reacting one mole of the corresponding commercial dichlorotriazine reactive dyes per mole of either cysteamine or cysteine followed by reacting the intermediate chloroamino-triazine with one mole of the corresponding commercial dichlorochloroamino-triazine reactive dye. Following their synthesis, the dyes were desalted by dissolving them in DMF,
filtration to remove salt, and evaporation of DMF at the aspirator.
Commercial Yellow Dye
N N Cl
N N
Cl
HN N
SO3H HO3S
SO3H H2N-C-HN
O N N N Cl Cl N SCH 2CHRNH N N N
SCH2CHRNH
HN N
SO3H HO3S
SO3H H2N-C-HN
O N N N Cl Cl N SCH
2CHRNH2
N
N N
SCH2CHRNH2
HN N
SO3H HO3S
SO3H H2N-C-HN
O
Figure 2.21 Synthesis of types 1 (R = CO2H) and 2 (R = H) Teegafix yellow dyes.
N N Cl
N N
SCH2CHRNH
HN N
SO3H HO3S
SO3H
H2NCHN
O N N
N N Cl N H N
HO3S
SO3H
HO3S
NHCNH2
O Commercial Yellow Dye
N N Cl
N N
Cl
HN N
SO3H HO3S
SO3H H2N-C-HN
O
N N Cl
N N
SCH2CHRNH2
HN N
SO3H HO3S
SO3H H2N-C-HN
O
2.4.4 Chromophore Moiety
The reactive dyes synthesized contained one to six chromogens, with most having one to three such groups. The chromogen can be defined as any
“photoactive compound and includes any colored or non-colored light absorbing species.” Chromogens are based on: monoazo, disazo, or polyazo, anthraquinone, phthalcyanine, formazan, azomethine, triphendioxazine, stilebene,
triphenyl-methane, and xanthene systems. In the present work, polysulfonated azo
chromophores, which are present in Procion® dyes, were used in the synthesis of new reactive dyes (Figure 2.23-26).
OH NH
HO3S SO3H
N N
N
N N
SO3H
SCH2CHRNH
HNCHRCH2S N
N N N N N Cl Cl Cl Cl
Figure 2.23 Types 1 (R = CO2H) and 2 (R = H) Teegafix red dyes.
OH NH
HO3S SO3H N N
N
N N
SO3H
SCH2CHRNH Cl
OH NH
SO3H HO3S
N N
N
N N HO3S Cl
OH NH2
HO3S SO3H
N N HO3S
SO3H N
N SO3H HN
N N
N
SCH2CHRNH
HNCHRCH2S N
N N N N N Cl Cl Cl Cl
Figure 2.25 Types 1 (R = CO2H) and 2 (R = H) Teegafix blue dyes.
OH NH2
HO3S SO3H
N N HO3S
SO3H N
N SO3H HN N N N Cl OH NH2
SO3H HO3S
N N SO3H
HO3S N N
NH N
N N
Cl SHCH2CHRHN HO3S
Figure 2.26 Types 3 (R = CO2H) and 4 (R = H) Teegafix blue dyes.
2.4.5 Linking Groups
2.4.6 Leaving Groups
Leaving groups (such as chlorine or fluorine) are the portion of the reactive dye that is substituted during the reaction of the dye with a substrate. Leaving group(s) are replaced by a nucleophilic group that is located on the surface of the substrate. The covalent bonds formed during this reaction are responsible for
holding the dye on the substrate that is being dyed. Most often the reactions leading to the replacement of these groups are carried out at a pH>8 when cellulosic
3. Experimental Methods and Procedures
3.1 General
Information
These experiments were conducted with three commercially available dichlorotriazine fiber reactive dyes, and four different homobifunctional dye types. The commercially available dyestuffs obtained (Procion® MX-8B, Procion® Yellow MX-3R, and Procion® MX-2G) from DyStar were purified by removing additives, which included salt. The homobifunctional reactive dye types (1-4) were
synthesized at North Carolina State University and provided for these studies. These dyes were also purified of salt and other impurities.
The structures of the dyes vary according to the number of reactive groups, the number of chromogens, and the linking moiety. Types 1 and 2 have four
reactive groups and one chromogen. Types 3 and 4 have only two reactive groups and two of the same chromogens. The linking moiety has either a hydrogen (–H) or carboxyl group (–COOH ).
There were two types of fabrics used in this project for the exhaustion equilibrium experiments and laboratory dyeings. Equilibrium exhaustion experiments were conducted on 100% cotton white woven crocking squares
the exhaustion equilibrium and dyeing experiments were sodium chloride (referred to as salt) and deionized water. Sodium carbonate and sodium hydroxide were used as alkali during the laboratory dyeing experiments. Stock solutions of 100 g/L sodium carbonate and 100 g/L of sodium hydroxide were used in the laboratory dyeing experiments. Triton X-200 was used during the washing off procedure following the dyeing step. Table 3.1 lists the chemicals and the suppliers.
Table 3.1 Chemical list and suppliers.
Chemical Supplier
Sodium chloride – A CS Grade Fisher Scientific (S271-3) Sodium hydroxide NF/FCC Pellets – A CS
Grade Fisher Scientific (S320-1)
Sodium carbonate Anhyrdrous – ACS Grade Fisher Scientific (S263-1) Triton X-200 Union Carbide (89543)
3.2
Dyeing Procedures
Equilibrium exhaustion experiments were conducted to determine the apparent affinity of a dye by bringing the dyebath to equilibrium with 1.20 ± .05g of cotton substrate. In this se of experiments dye exhaustion was conducted without the addition of alkali. In a second set of experiments, a laboratory dyeing was performed with the addition of an alkali fixation step.
3.2.1 End-of-process Dyebath Analysis Procedures
high and low range ( r2 > 0.9900), were obtained for each dye in deionized water. After the equilibrium exhaustion and dyeing procedures were completed, the fabric was removed from the solution, the dyebaths were mixed thoroughly, and 5 mL aliquots were taken from each. The aliquots were allowed to cool to room temperature and 1mL was diluted in 3 mL using deionized water. The dyebath samples were placed in disposable polystyrene cuvettes (Fisher Scientific) with a 10mm light path, to conduct spectral analyses.
3.2.2 Equilibrium Exhaustion Procedure
The equilibrium exhaustion experiments were conducted in 50 mL
Erlenmeyer flasks using shaker baths. These studies were conducted at either 60°C (Dubnoff Metabolic Shaking Incubator) or 90°C (Boekel Grant ORS200) and using speed of 100 orbital revolutions per minute. Five woven cotton squares weighing a total of 1.20 g were placed in a single empty Erlenmeyer flask, and sufficient
3.2.2.1 Dye Exhaustion studies for Commercial, Types 1, 2, and 3 Dyes
There were five dyeings conducted at each of the four different salt concentrations employed. The baths contained 1% (owf) dye with salt
concentrations of either 0 g/L, 10 g/L, 40 g/L, or 70 g/L. These solutions were added to the Erlenmeyer flasks at the beginning of the dyeing process.
3.2.2.2 Dye Exhaustion studies for Type 4 Dyes
The exhaustion of type 4 dyes involved a slower salt addition because of their higher salt sensitivity. The addition of the salt in a single dose prevented the
Table 3.2 Addition of salt solution to Type 4 dyes.
Final Salt Concentration
Time 0 g/L 10 g/L 40 g/L 70 g/L 0-24 h 0 g/L +10 g/L +10 g/L +10 g/L
24-48 h 0 g/L 0 g/L +10 g/L +10 g/L
48-72 h 0 g/L 0 g/L +20 g/L +20 g/L
72-96 h 0 g/L 0 g/L 0 g/L 30 g/L
3.2.3 Laboratory Dyeing Procedure
These experiments were conducted using an Ahiba Texomat laboratory dyeing machine with a liquor ratio of 40:1 for the commercial, type 2 and type 4 dyes. The initial dyebaths were set up for 0.25% and 1.0% (owf) dyeing. Inititally, 200 mL deionized water was added to each Texomat tube. Then, an appropriate amount of concentrated dye solution was added to each tube via a 25 mL burette. The tubes were then placed into the Ahiba Texomat machine at a temperature of 30°C. Ten gram cotton samples were wet out with water and then padded at 100% wpu. The fabric samples were then mounted on Ahiba sample holders and placed in the baths to agitate.
30 min. The fabric was then removed immediately from the baths and 5 ml of the dyebath was placed in a sealed container for subsequent analysis. Table 3.3 outlines the basic dyeing procedure for the experiments.
Table 3.3 Dyeing procedure outline.
Step Description
Time (mins)
Temperature (Celsius)
1 Load the Texomat with Fabric and Dyebath 0 30 2 Heat at Maximum Rate of Rise 15 90
3 Run 5 90
4
Held or Cooled to Dyeing Temperature
Maximum Rate of Cooling 0-90 30, 60, or 90
5 Run 10 30, 60, or 90
6 Add ½ of the Salt Solution to Dyebath 1 30, 60, or 90 7 Add remaining Salt Solution to Dyebath 1 30, 60, or 90
8 Run 15 30, 60, or 90
9 Add ¼ of the Alkali Solution to Dyebath 5 30, 60, or 90 10 Add ¼ of the Alkali Solution to Dyebath 5 30, 60, or 90 11 Add ½ of the Alkali Solution to Dyebath 5 30, 60, or 90
12 Run 30 30, 60, or 90
3.2.2.1 Temperature
Dyeings with the commercial and type 2 synthesized dyes were conducted at 30°C and 60°C, while the type 4 dyes were applied at 60°C and 90°C. These
temperatures were selected because the commercial and type 2 dyes are
3.2.2.2 Salt
Three different salt concentrations were used during the dyeing experiments 0 g/L, 20 g/L, and 40 g/L. These levels were chosen based on results from
preliminary exhaustion experiments. A saturated sodium chloride solution was added to the tubes in two equal portions during the dyeing procedure, according to the procedure outlined in Table 3.3.
3.2.2.3 Alkali
The commercial and type 2 dyes were applied to cotton at a final
concentration of 10g/L sodium carbonate. However, the type 4 dyes were applied at a final concentration of 10 g/L sodium carbonate and 1 g/L sodium hydroxide. Alkali was added in parts (¼, ¼, and ½) over a time interval of 15 min.
3.2.3 Washing Procedure
At the end of the dyeing process the fabric samples were washed by stirring them in cold tap water for 2 min and 3 min, successively. Excess water was
Table 3.4 Washing procedure.
Step Description Time (min)
1 Place fabric in clean cool water and agitate. 2 2 Transfer fabric to clean cool water and agitate. 3
3 Remove excess water. 0
4 Transfer fabric to clean 90°C water with 0.25 g/L of Triton X-200. 5 5 Rinse fabric in clean 90°C water. 5
6 Remove excess water. 0
7 Dry 3
3.2.4 K/S Data Collection
To obtain K/S data, the fabric samples from equilibrium and laboratory dyeing procedures were dried and pressed with an iron set on medium high. The samples were then analyzed using a Datacolor Spectraflash SF600X instrument equipped with SLI-Form® software. The maximum K/S value was recorded for each fabric sample.
3.3
Physical Testing Procedures
The following physical tests were performed on the dyed fabric samples: 1. Color Fastness to Light - AATCC Test Method 16-1998
2. Color Fastness to Water - AATCC Test Method 107-1997 3. Color Fastness to Crocking - AATCC Test Method 8-1996
3.3.1 Color Fastness to Light
weatherometer. Change in color was calculated by evaluating the samples using a Datacolor Spectraflash SF600X equipped with SLI-Form® software. The color change was also evaluated using an AATCC Gray Scale for Color Change, according to AATCC Evaluation Procedure 1 (AATCC, 2000). Ratings were assigned to each sample using a scale of 1 (poor) – 5 (excellent). The visual color change assessment was conducted using a Gretag Macbeth Spectralight III instrument with illuminant D65.
3.3.2 Colorfastness to Water
Colorfastness to water was evaluated using AATCC Test Method 107-1997 (AATCC, 2000). The fabric samples were evaluated in the presence of multifiber test fabric No. 10 for a period of 18 h at 38°C. The multifiber fabric samples were evaluated for color change using the AATCC Gray Scale for Evaluating Staining according to the AATCC Evaluation Procedure 2 (AATCC, 2000). A rating of 1 (poor) – 5 (excellent) was assigned to each of the six fiber strips on the fabric.
3.3.3 Colorfastness to Crocking
3.4
Computational Procedures
Computation procedures to determine the concentration of dye in solution and in the fiber, percent exhaustion, percent fixation, apparent affinity, and heat of dyeing were conducted on both the equilibrium exhaustion and laboratory dyeing
procedures.
3.4.1 Determination of Dye in Solution (cs)
To determine the amount of the dye that was in the residual dyebath (cs), a standard Beer-Lambert Law calibration curve was developed for each dye. Dye solutions had the following known concentrations: 0.00250 g/L, 0.02500 g/L, 0.03125 g/L, 0.06250 g/L, and 0.10000 g/L. The absorbance of each solution was measured on a Cary 3E UV-Visible Spectrophotometer and linear regression was used to give a calibration model for each dye. The measured absorbances of the residual dyebaths were used with the Beer-Lambert Law regression models to determine the concentration of dye in each solution.
3.4.2 Calculation of Dye in the Fiber (cf)
The conservation of mass was used to calculate the concentration of dye in the fiber. This law indicates that the total amount of dye after dyeing is completed will equal the amount of dye in the fiber plus the amount of dye in solution.
Where minitial represents the mass of the initial solution, ms is the mass of the solution after dyeing, cs is the concentration of dye in the solution after dyeing, cf is the concentration of dye in the fiber, and mf is the mass of the fiber.
3.4.3 Calculation of Percent Exhaustion (%E)
The percent exhaustion was calculated for each of the equilibrium exhaustion experiments, using the following equation.
% E = [(csinitial - cs)/ csinitial] x 100%
3.4.4 Calculation of Percent Fixation (%F)
The percent fixation was calculated for each experimental dyeing, using the following formula.
% F = [(csinitial - cs)/ csinitial] x 100%
3.4.5 Calculation of the Substantivity Ratio (K)
Substantivity ratios from exhaustion equilibrium studies were calculated by dividing the concentration of dye in the solution by the concentration of the dye in the fiber after dyeing. The following equation was used to obtain these values.
K = cf / cs
3.4.6 Calculation of Apparent Standard Affinity (-∆µ°)
The apparent standard affinity was calculated from K for the exhaustion experiments by using the following equation:
Where R is the gas constant (8.31433 J/mol K), T is the temperature (degrees K) and K is the affinity of the dye for the fiber.
3.4.7 Calculation of Apparent Standard Heat of Dyeing (∆H°)
The apparent standard heat of dyeing was calculated for each dye type using the following equation:
-∆H°/R = ∆ ln(K)/ ∆(1/T)
Here, T is the temperature and K is the affinity of the dye for the fiber. The constant R is the gas constant R= 8.31433 J/mol K.
3.4.8 Computational Chemistry
4. Results and Discussion
4.1 Substantivity
Ratio
The substantivity ratio of reactive dyes for cellulose in aqueous dyebaths is largely determined by the chemical nature of the chromophore and the fiber (Sumner and Taylor, 1967). Bath ratio, pH, salt and temperature also play an integral role in the substantivity ratio (Sumner, 1963). The bath ratio of 40:1 and the pH (7 +/- .1) remained constant for the exhaustion experiments. Substantivity ratios were calculated for each dyeing and were used in determining the apparent standard affinity (-∆µ° ) of the dye for the fiber.
-∆µ° = RTlnK
The determination of the substantivity ratio has been used in the exhaustion equilibrium and a similar measure, the fixation ratio, was used in the dyeing
experiments to assess the performance of the dyes. These ratios were determined from the concentration of dye in the fiber and the solution after dyeing.
4.1.1 Equilibrium Exhaustion
Equilibrium exhaustion experiments were conducted on all five dye types: Commercial, type 1, type 2, type 3, and type 4. The goal was to determine which of the four modified structures had the greatest affinity and substantivity for cotton. The factors that were varied in these experiments were temperature and salt
concentration. Four salt concentrations, 0 g/L, 10 g/L, 40 g/L, and 70 g/L, were used to provide a low to high range. Two temperatures were chosen: 30°C and 90°C. To
at 60°C and then cooled to 30°C after 2 h. This reduced the amount of time required
for the dyeing to reach an equilibrium between with the dye in the bath and the fiber. During these experiments it was noticed that the solubility of the type 4 dyes decreased significantly as salt concentration increased. Therefore, equilibrium exhaustion experiments were conducted over a period of 96 h with an addition of saturated salt solution every 24 h. The solubility of type 2 dyes was less affected by salt concentrations than type 4, but was affected more than types 1 and 3. The pH of all dye solutions was 7.0 +/- 0.5 pH units.
The analysis of the dyebath after dye exhaustion was completed allowed cs and cf values to be determined (Appendix A). The corresponding substantivity ratio was then calculated from those values. Tables 4.1 - 4.3 provide K values for all types of dyes and the experimental conditions. These results showed that increases in salt concentration in the dyebath increased the substantivity ratio (K). It is also clear that the substantivity ratio decreased as the temperature of the dyebath was increased. These data indicate that the use of type 2 dyes led to the largest
increase in the K values, compared to the commercial and Teegafix type 1, 3, and 4 dyes. While type 4 dyes also afforded higher K values than the commercial dyes, the increases observed were not as large as those observed with type 2. However, the type 4 dyes did have a higher K value than the type 2 dyes at the lower
temperature (30°C) at the highest salt concentration (70 g/L). These results are also
Table 4.1 K Values for equilibrium exhaustion of the five red dyes as a function of temperature and salt concentration.
Dyes
30°C
0 g/L
30°C
10 g/L
30°C
40 g/L
30°C
70 g/L
90°C
0 g/L
90°C
10 g/L
90°C
40 g/L
90°C
70 g/L
R1 0.01 6.52 19.02 24.88 0.96 3.33 6.22 9.08
R2 25.65 70.52 156.54 254.11 2.50 20.40 58.37 112.07
R3 0.01 1.81 15.48 44.40 0.01 0.02 3.43 15.46
R4 2.01 36.99 141.69 278.06 0.06 20.00 32.92 51.47
Procion® Red MX-8B 0.32 12.50 32.93 48.37 0.04 0.71 6.95 13.42
Table 4.2 K Values for equilibrium exhaustion of the five blue dyes as a function of temperature and salt concentration.
Dyes
30°C
0 g/L
30°C
10 g/L
30°C
40 g/L
30°C
70 g/L
90°C
0 g/L
90°C
10 g/L
90°C
40 g/L
90°C
70 g/L
B1 1.66 1.96 6.24 17.47 3.67 6.21 4.94 7.33
B2 1.66 25.89 98.12 205.57 1.28 5.50 31.40 69.50
B3 0.00 5.40 21.20 36.34 1.06 1.80 3.34 10.37
B4 0.03 5.27 33.04 71.96 0.03 0.03 6.29 22.70
Procion® Blue MX-2G 0.06 2.23 13.80 30.40 1.46 1.70 3.18 7.10
Table 4.3 K Values for equilibrium exhaustion of the five yellow dyes as a function of temperature and salt concentration.
Dyes
30°C
0 g/L
30°C
10 g/L
30°C
40 g/L
30°C
70 g/L
90°C
0 g/L
90°C
10 g/L
90°C
40 g/L
90°C
70 g/L
Y1 0.01 4.61 11.42 10.08 24.11 25.30 27.49 38.56
Y2 0.46 18.92 68.41 160.96 15.39 25.17 37.54 57.73
Y3 1.66 7.85 26.79 59.56 18.96 17.42 25.09 27.57
Y4 0.03 18.11 65.53 127.56 7.15 15.70 25.43 36.89
0 20 40 60 80 100 120 140 160 180
0 g/L 10 g/L 40 g/L 70 g/L
Salt Concentration
K Value
Y1 Y2 Y3 Y4 Comm.
0 50 100 150 200
0 g/L 10 g/L 40 g/L 70 g/L
Salt Concentration
K Values
TB1 TB2 TB3 TB4 Comm.
0 50 100 150 200 250 300
0 g/L 10 g/L 40 g/L 70 g/L
Salt Concentration
K Value
R1 R2 R3 R4 Comm.
Figure 4.3 K values for exhaustion equilibrium of the five red dyes at 30°C.
0 10 20 30 40 50 60 70 80 90
0 g/L 10 g/L 40 g/L 70 g/L
Salt Concentration
% Exhaustion
Y1 Y2 Y3 Y4 Comm.
0 10 20 30 40 50 60 70 80 90
0 g/L 10 g/L 40 g/L 70 g/L
Salt Concentration
% Exhaustion
B1 B2 B3 B4 Comm.