ABSTRACT
NYANKIMA, ANGE GLORIA. Designing Phase-change Contrast Agents for Safe
Diagnostic Ultrasound Imaging and Enhanced Therapeutic Outcomes (Under the direction of Dr. Paul Dayton).
Phase-change contrast agents (PCCAs) are positioned to improve the reach of
diagnostic and therapeutic ultrasound. These contrast agents, also known as nanodroplets, are
formulated with liquid perfluorocarbon cores, which result in smaller mean diameter and
increased in vivo stability, as compared to their microbubble (MB) counterpart. When needed
for imaging or therapy, PCCAs are vaporized, or activated, into a gas, whereas MBs are
formulated as such. With a gas core, both agents will produce unique backscattered signal as
a result of oscillating in an acoustic field. In contrast to MBs, PCCAs have the potential to
expand the reach of ultrasound contrast agents (UCAs) beyond vascular barriers. This has
vast advantages in diagnostic and therapeutic applications of ultrasound technology.
The oscillating nature of UCAs can be utilized for more than just signal generation.
Depending on the application, this phenomenon in vivo can induce biological effects that has
the potential to injure surrounding tissue. For diagnostic purposes, imaging with UCAs
should be optimized to minimize negative tissue response in the organ being examined.
Alternatively, for therapeutic outcomes, an oscillating UCA is utilized to intentionally
produce bioeffects to the surrounding tissue, including temporarily opening biological
barriers that limit drug delivery.
In order to achieve these goals of safe diagnostic imaging and enhanced therapeutic
outcomes, it is necessary to optimize PCCA formulation with respect to the desired in vivo
response. I hypothesize that by characterizing in vivo responses as a function of PCCA
In my first objective, I will explore the use of PCCAs for diagnostic imaging. I will
begin this objective by exploring potential bioeffects from MB-mediated contrast enhanced
ultrasound (CEUS), which utilizes an imaging sequence involving high amplitude pulses
which cause substantial microbubble disruption. With this understanding, I will proceed to
investigate potential bioeffects from PCCA-mediated CEUS, particularly focusing on the
vaporization phase of PCCA-mediated CEUS. In this study, bioeffects will be measured as a
function of PCCA formulation.
My second objective will be to identify an optimal PCCA formulation for enhanced
thermal ablation. The pursuit will require investigating the lesion size and heating efficiency
from exposing various PCCA formulations to high intensity focused ultrasound (HIFU) in a
tissue-mimicking phantom. We will conclude with future directions of PCCA technology as
a drug-delivering vehicle. It is my hope that this work will be utilized to further the
advancement of PCCA technology, towards in vivo applications in diagnostic imaging and
© Copyright 2019 Ange Gloria Nyankima
Designing Phase-change Contrast Agents for Safe Diagnostic Ultrasound Imaging and Enhanced Therapeutic Outcomes
by
Ange Gloria Nyankima
A dissertation submitted to the Graduate Faculty of North Carolina State University
in partial fulfillment of the requirements for the degree of
Doctor of Philosophy
Biomedical Engineering
Raleigh, North Carolina
2019
APPROVED BY:
_______________________________ _______________________________ Dr. Paul A. Dayton Dr. Caterina Gallippi
Chair of Advisory Committee
_______________________________ _______________________________
Dr. Emily Chang Dr. X. Sha Chang
External Member
ii
BIOGRAPHY
Ange Gloria Nyankima (known as Gloria) was born and raised in Auburn, AL. She
attended Auburn University, where she received a Bachelor’s of Chemical Engineering in
2013. In the same year, she began her Doctor of Philosophy in the joint department of
Biomedical Engineering at North Carolina State University and the University of North
Carolina at Chapel Hill. In 2014, she joined the lab of Paul Dayton, where she took an
interest in phase-change contrast agents. During her graduate career, she explored the safety
of phase-change contrast agents as a diagnostic imaging tool. In 2016, she was awarded an
NIH F31 grant to pursue the use of phase-change contrast agents as a therapeutic tool. Gloria
plans to continue assessing safety of medical devices as an AIMBE Scholar at the U.S. Food
and Drug Administration.
The following publications were authored or coauthored by Gloria Nyankima in
peer-reviewed engineering journals, as well as conference proceedings and poster presentations,
during her time in the University of North Carolina at Chapel Hill and North Carolina State
University joint department of Biomedical Engineering.
PUBLISHED ARTICLES AND CONFERENCE PROCEEDINGS:
1. " Histological and Blood Chemistry Examination of the Rodent Kidney After Exposure
to Flash-Replenishment Ultrasound Contrast Imaging” A.G. Nyankima, S.K. Kasoji, R.
Cianciolo, P.A. Dayton, E. H. Chang. Ultrasonics. 2019. Print.
2. “Microbubble-mediated sonoporation to increase the uptake of refillable drug depots: A
iii
Dayton. International Society of Therapeutic Ultrasound Symposium. Nashville, TN,
USA. 2018. Poster Presentation.
3. "In vivo assessment of the potential for renal bio-effects from the vaporization of
perfluorocarbon phase-change contrast agents ". A.G. Nyankima, J.D. Rojas, R.
Cianciolo, K.A. Johnson, and P.A. Dayton. Ultrasound in Medicine & Biology. 2018. 44
(2): 368-376. Print.
"Accelerated clearance of ultrasound contrast agents containing polyethylene glycol is
associated with the generation of anti-polyethylene glycol antibodies ". S.M. Fix, A.G.
Nyankima, M.D. McSweeney, J. K. Tsuruta, S. K. Lai, and P.A. Dayton. Ultrasound in Medicine & Biology. 2018. 44 (6): 1266-1280. Print.
4. “In vivo bioeffects from phase change and microbubble contrast agents in the rodent
kidney: short-term and long-term effects after excitation with a range of mechanical
indices”. A. G. Nyankima, R. Cianciolo, S. K. Kasoji, J.D. Rojas, R. Cianciolo, K. A.
Johnson, E. H. Chang, and P.A. Dayton. IEEE International Ultrasonics Symposium.
Washington D.C., USA. 2017. Oral Presentation.
5. “Acoustic Regimes for Safe Use of Low-Boiling Point Phase-Change Contrast Agents as
Assessed in Rat Kidneys”. A. G. Nyankima, J.D. Rojas, R. Cianciolo, P.A. Dayton.
IEEE International Ultrasonics Symposium. Tours, France. 2016. Oral Presenter.
6. “Characterizing Kidney Perfusion in Streptozotocin Induced Diabetic Rat Model
Utilizing 4D Contrast-Enhanced Ultrasound”. K.A. Johnson, A. G. Nyankima, R.
Cianciolo, P.A. Dayton, E. Chang. IEEE International Ultrasonics Symposium. Tours,
iv
7. “Quantification and Characterization of Renal Perfusion in Streptozotocin Model of
Diabetic Kidney Disease with 4D CEUS”. K.A. Johnson, A. G. Nyankima, R. Cianciolo,
P.A. Dayton, E. Chang. Triangle Imaging Symposium, BRIC. Chapel Hill, NC. 2016.
v
ACKNOWLEDGEMENTS
I would like to thank my advisor, Dr. Paul Dayton, for all of his mentorship during
my time as his graduate student. To my committee, I appreciate your guidance and support
through this memorable and arduous journey. And to the members of the Dayton Lab, both
past and present, I cannot express the amount of gratitude I have for each and every one of
you. My graduate career would not have been the same without the hours of conversations,
miles of running, and endless support I received from the members of the Dayton Lab. To
Samantha Fix, who began as my colleague in the Dayton Lab, and became a true friend—it
has been an honor watching you grow as a scientist.
I would like to thank my family and friends for the never-ending belief in me.
Whether or not you understood the challenges I was facing, you still remained confident in
my ability. To Kirsten Willis, Anaidra Reese, Myricka Brown, Leonard Baldwin, and Alex
Chavis, our yearly vacations have been the rejuvenation I needed to continue this journey. To
my mother and siblings, Sandrine and Chanel, so much of me is what I have seen in each of
you and I am thankful for your never-enduring love.
Finally, I would like to give a special thank you to my father, Laurent. As a result of
many hours in your laboratory, and your own dissertation sitting on our bookshelf at home, I
began this research journey. For the seeds you planted, which culminated in this document, I
vi
TABLE OF CONTENTS
LIST OF TABLES ... ix
LIST OF FIGURES ... xi
ABBREVIATIONS ... xv
CHAPTER 1 Introduction... 1
1.1 Medical Ultrasound ... 1
1.2 Ultrasound Contrast Agent ... 7
1.3 Objective ... 12
1.4 Dissertation Outline ... 13
References ... 15
CHAPTER 2 Histological and Blood Chemistry Examination of the Rodent Kidney After Exposure to Flash-Replenishment Ultrasound Contrast Imaging ... 21
2.1 Introduction ... 21
2.2 Materials and Methods ... 26
2.3 Results ... 32
2.4 Discussion ... 34
2.5 Conclusions ... 38
2.6 Acknowledgements ... 39
References ... 40
CHAPTER 3 An In Vivo Assessment of the Potential for Renal Bioeffects from the Vaporization of Perfluorocarbon Phase-Change Contrast Agents ... 43
3.1 Introduction ... 43
3.2 Materials and Methods ... 45
3.2.7 Statistical Testing ... 52
3.3 Results ... 52
3.4 Discussion ... 60
3.5 Conclusion ... 62
3.6 Acknowledgements ... 62
References ... 64
CHAPTER 4 Utilizing the Potential Bioeffects of Phase-change Contrast Agents for Therapeutic Ultrasound ... 67
vii
4.2 Bioeffects of Ultrasound ... 68
4.3 Ultrasound Contrast Agents ... 70
4.4 Sonoporation ... 71
4.5 Thermal Ablation with High-intensity Focused Ultrasound ... 74
4.5 Influence of Ultrasound Parameters on Droplets ... 77
References ... 80
CHAPTER 5 In vitro assessment of lesion development from phase-change contrast agent enhanced thermal ablation as a function of acoustic and perfluorocarbon parameters ... 85
5.1 Introduction ... 85
5.2 Materials and Methods ... 88
5.2.1 Phase-change contrast agent Formulations... 88
5.2.2 Lipid Solution Formulation ... 88
5.2.3 Perfluorocarbon Preparation ... 89
5.2.3 Phase-change Procedure ... 90
5.2.4 Tissue-mimicking Phantom Procedure ... 91
5.2.5 Thermal Ablation Procedure ... 92
5.2.6 Data Processing: Acoustic Characterization of Lesion Area... 94
5.2.7 Data processing: Temperature Measurement of Lesion Heating ... 95
5.2.8 Statistical Analysis ... 97
5.3 Results ... 98
5.3.1 PCCA Size Distribution ... 98
5.3.2 Lesion Acoustic Characterization ... 98
5.3.3 Thermal Measurement of Lesion Development ... 101
5.4 Discussion ... 103
5.5 Conclusions ... 108
5.6 Acknowledgements ... 108
References ... 110
CHAPTER 6 Challenges of Optimizing Phase-change Contrast Agents for Extravasation 114 6.1 Introduction ... 114
6.2 Data ... 119
6.3 Challenges of Observing Extravasation ... 139
viii
References ... 144
APPENDIX ... 147
APPENDIX A Supplemental Information for Chapter 2 ... 148
A.1 Methods & Materials ... 148
A.2 Results and Discussions ... 148
References ... 151
APPENDIX B Supplemental Information for Chapter 3 ... 152
ix
LIST OF TABLES
Table 3-1: Designated acoustic parameters for experimental groups i-v. For the mechanical index (MI), the maximum MI transmitted in the region of interest is reported. A focused pulse at 5 MHz with 5 cycles per pulse was transmitted in all subjects. For each group presented, an animal number (n) of 8 was used. ... 48 Table 3-2: Serum creatinine levels at all three time points for the 24 hour observation are
presented by group: (i) Decafluorobutane (DFB) at max, (ii) Mix at max, (iii) Octafluoropropane (OFP) at max, (iv) Mix at min, (v) OFP at min. Data points indicated with a (*) at the 24 hour time point denote an increase of or greater than 150% (from baseline). This aligns with the serum creatinine requirements in the Acute Kidney Injury Network (AKIN) classification for indicating potential acute kidney injury. For a female Fischer rat, the 95% confidence interval for serum creatinine level is 0.2-06 mg/dL [19]. ... 54 Table 3-3: The clinical chemistry and histology results of the recovery study show minimal
bioeffects after two and four weeks of recovery. No red blood cell (RBC) casts were found in either the two- or four-week recovery subjects. Creatinine levels for one subject in each group showed an increase of >200%, which has been
indicated with a (*). For a female Fischer rat, the 95% confidence interval for serum creatinine level is 0.2-06 mg/dL [19] ... 55 Table 6-1: Comparison of surface charge of commercially available UCAs and the contrast
agents made in the Dayton Lab (In-House). In-House contrast agents were tested on a DLS (company, USA) with a total of 3 vials. ... 118 Table 6-2: Size distribution results of DFB-containing MBs and PCCAs formulated with
30% PEG. Data was gathered using an AccuSizer for 780A the MBs and an AccuSizer FX Nano for the PCCAs. ... 121 Table 6-3: Size distribution results of DFB PCCAs after being condensed by either
pressurized air or nitrogen. Distributions were found using an AccuSizer FX Nano. ... 125 Table 6-4: Size distribution metrics for the size-sorting procedure demonstrate population
similarities and differences between starting MB population, isolated NBs, and the resulting NDs. The averages are a result of two trials. ... 129 Table B-1: The parameters, histopathology, and serum creatinine for a preliminary
investigation where Sprague-Dawley rats experience no PCCA vaporization. Instead, the activation pulses (at an MI of 2.7) were delivered to the experimental kidney. These parameters were not used in the study presented here. Both kidneys were assessed (by the same pathologist) and found to be normal. ... 152 Table B-2: Description of histopathology evaluations. ... 153 Table C-1: Area of lesion data for all four formulations, organized by mean, standard
x
Table C-2: Area under the curve (AUC) data for all four formulations, organized by mean, standard deviation (std. dev), and the number of lesions produced during HIFU treatment (N). ... 156 Table C-3: Peak temperature data for all four formulations, organized by mean, standard
xi
LIST OF FIGURES
Figure 1-1: A generalized block diagram of the transmit (bottom) and receive (top) processes that are implemented to generate an ultrasound image using a multi-element (total of N multi-elements) transducer. In the diagram, a preclinical kidney with contrast agents flowing in the vessels results in the contrast-enhanced ultrasound image presented in the “Image Display”. Image was produced by my colleague, Dr. Kennita Johnson... 2 Figure 1-2: Diagram demonstrating the predicted received signal from one element in a
multi-element transducer, when positioned to image a kidney. The transmitted signal, shown as a one cycle sinusoid, is reflected at the kidney boundaries and received by the transducer, corresponding to the upper and lower boundaries of the kidney and surrounding tissue... 4 Figure 1-3: Design components of PCCA technology, describing considerations for
fabrication, shell composition, and inner core that will impact acoustic response and particle stability. The inner core of PCCAs can contain (but are not limited to) octafluoropropane (OFP), decafluorobutane (DFB), dodecafluoropentane (DDFP), perfluorohexane (PFH), and perfluorooctylbromide (PFOB). The information portrayed in this figure was reproduced from Lea-Banks et al [43] with
permission from Elsevier. ... 12 Figure 2-1: Experiment Timeline. On the first day, animal BUN levels were measured prior
to being imaged (t=0). For short term bioeffect assessment, blood and kidneys were collected for BUN and histopathology four hours post imaging. For long term bioeffect assessment, blood and kidneys were collected two weeks after imaging. This timeline was followed for animals exposed to 1.0 MI and 1.9 MI microbubble destructive pulses. ... 28 Figure 2-2: Imaging Setup. Animals were positioned such that only one kidney would be
exposed to the ultrasound field. A) A water bath was placed above the animal so that the focus of the transducer would align with the kidney. B) The transducer was steered across one side of the animal, while the animal was administered isoflurane through a nose cone and a heating pad maintained a healthy body temperature (35.9-37.5ºC)... 31 Figure 2-3: Clinical Chemistry Results. Average baseline and endpoint data collected for
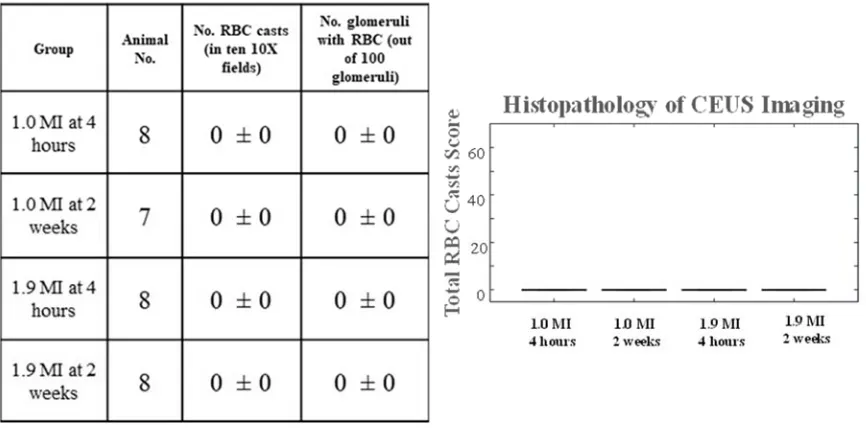
each group were analyzed via paired T-test. The BUN levels after 2 weeks in the 1.9 MI pulse group were significantly higher than baseline levels. In addition, BUN levels of both groups analyzed at 4 hours were also found to be statically significant. P-values between 0.01 and 0.05 are indicated with the symbol ‘*’. Normal BUN range is indicated with dashed lines (15 to 24 mg/dL). ... 33 Figure 2-4: Histopathology Results. No bioeffects were observed after 1.0 and 1.9 MI pulse
or at either time point. ... 34 Figure 3-1: Phase-change contrast agent (PCCA) size distribution (as a function of
xii
(DFB), octafluoropropane (OFP), and 1:1 DFB-OFP mixture. Size distributions represent averages from three vials. ... 53 Figure 3-2: Photomicrographs of kidneys from a rat in group iii. In the cortex (a) there are
many red blood cell casts within proximal tubules (arrows). One tubule also contains sloughed cellular debris (circle). There is mild interstitial inflammation in response to the tubular injury. The glomerulus is normal. Within the medulla of the same rat (b), red blood cell casts can be seen in collecting duct lumens (arrows) and there is also sloughed cells within a duct lumen (oval). Scale bars (bottom right corner) in (a) and (b) represent a length of 20µm. Transmission electron micrographs of a rat from group iii revealed that tubules with
intraluminal red blood cells (c). The red blood cells (R) were found in the lumens (L) of tubules with intact apical brush borders (BB). The epithelial cells (E) had scattered electron dense material within cytoplasmic lysosomes. The glomerular capillary walls of this rat (c) were normal. Podocytes had segmental foot process effacement (not shown). Parietal epithelial cells (PEC) had disruption of the cell membrane and marked mitochondrial swelling. Scale bars (bottom right corner) in (c) and (d) represent a length of 10µm. ... 57 Figure 3-3: Total red blood cell (RBC) casts presented as boxplots for all five groups
observed (labeled with the perfluorocarbon and mechanical index used). Each group contains the experimental kidney (Exp) alongside its paired control (Con). Data is shown with the interquartile range as the box edges and the median data point is presented as a line inside the box. Circular points (‘o’) indicate outliers, (defined as points beyond 1.5 times the interquartile range). Statistically
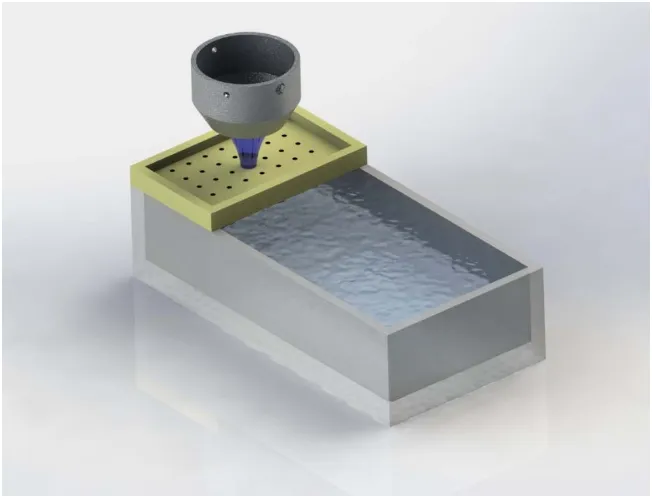
significant values are indicated with an asterisk (*). ... 59 Figure 5-1: Schematic of the HIFU experimental setup. PCCA-mediated HIFU was
conducted in an acrylamide-album hydrogel phantom. Phantoms were maintained at a temperature of 37ºC using a heated water bath. A phantom holder was
manufactured for the two different phantom volumes. The TIPS transducer was positioned 10 mm away from phantom surface, and was guided across the
phantom with an accompanying 2D motion stage (not pictured). ... 94 Figure 5-2: Flow diagram of data processing of acoustic characterization study. Ultrasound
images from acoustic characterization study were analyzed through MATLAB. The chosen lesion was isolated from the rest of the image by placing an ROI around the lesion. A threshold was applied to identify lesion location from
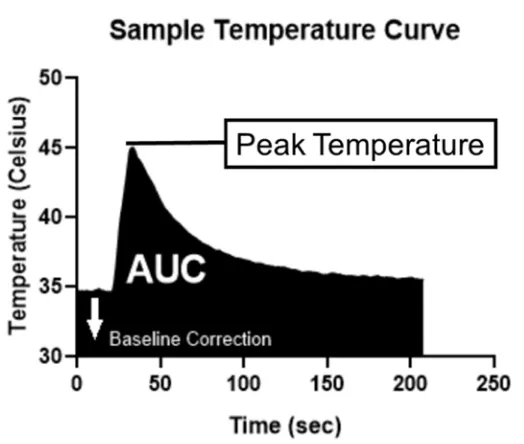
phantom background. The values were binarized for area calculation. ... 95 Figure 5-3: Example temperature recording. Thermal heating was measured using a fiber
optic probe, which recorded temperature changes in real-time. An example of data from the probe is presented, showing the change in phantom temperature during a HIFU ablation. HIFU was performed on a 20 mL phantom containing PCCAs at a concentration of 1.0 μL/mL. ... 96 Figure 5-4: PCCA size distribution of the four PCCA formulation used throughout the study.
xiii
Figure 5-5: Example B-mode images of sample lesions created in PCCA-embedded tissue mimicking phantoms. Images are presented (top to bottom) from the least stable PCCA-core, C3C4, to the most stable PCCA-core, C5. Lesions are organized in increasing transmitted pressure, beginning at 1.0 MPa (left) and ending at 4.0 MPa (right). These pressures are indicated above the lesion. All phantoms were made with a 1.0 μL/mL concentration of PCCAs. ... 99 Figure 5-6: Lesion area with respect to PNP, together with Spearman correlation testing
results Lesion area was shown to increase with increasing PNP for C3C4 (r = 0.93, p = 0.003), C4 (r = 0.96, p = 0.003) and C5 (r = 1.00, p = 0.0004), but not C4C5 (r = 0.75, p = 0.066). ... 100 Figure 5-7: Area of lesions produced at 1 MHz center frequency, 1 sec exposure, and 100%
duty cycle. Data is presented in groups of all four PCCA formulations with respect to transmitted PNP, together with the statistically significant differences between formulations found by Tukey’s multi-comparison testing. A dashed red line represents the FWHM focal area of the 1 MHz TIPS transducer. ... 101 Figure 5-8: Peak temperature (left) and AUC (right) with respect to PNP for all four PCCA
formulations. Thermal assessment of PCCA-embedded tissue mimicking phantoms was measured by a fiber optic probe. Temperature changes during HIFU treatment were quantified as (a) peak temperature and (b) area under the curve (AUC). Average and standard deviation data are presented for transmit PNP of 2.0, 3.0, and 4.0 MPa. Statistically significant differences between some
formulations were found at 2.0 MPa (all statistically significant p-values from Tukey’s multi-comparison are depicted). ... 103 Figure 6-1: Cancer vascular environment is understood to be porous, allowing for
nanoparticles to passively migrate outside tumor vessels. This characteristic of cancer can be utilized to target extravascular targets of cancer as shown in
schematic... 115 Figure 6-2: Difference in size distribution as a result of PEG concentration demonstrates
little difference between the two PCCA formulations. ... 122 Figure 6-3: Comparison of size distributions of pressure increases used to condense MBs
with air. Data displayed resulted from measurements taken from an AccuSizer FX Nano (n=3). ... 126 Figure 6-4: Difference in size distribution as a result of pressure increases when condensing
MBs with nitrogen. Input pressures ranged from 10 psi to 20psi, and
measurements were taken from an AccuSizer FX Nano (n=3). ... 126 Figure 6-5: Images of vials demonstrating optical change of particle solution as isolating
procedure progressed from MBs (A) to NBs from the infranatant (B) to PCCAs (C). ... 128 Figure 6-6: Average size distribution of size sorted DFB PCCAs (N=2). The protocol begins
with a solution of MBs, and NBs are isolated after centrifugation. PCCAs are then formulated from the NBs. All size measurements were collected from an
xiv
gure 6-8: Optimization of centrifuge speed was conducted using the AccuSizer 780A to measure size distribution (n=2/speed). Infranatants of each centrifuge speed were compared to one another and 1,700xRPM was isolated as a potential candidate, given lower mean and mode diameter and higher concentration. ... 131 Figure 6-9: Time optimization was conducted by measuring PCCAs isolated from
infranatants centrifuged at 1,700xRPM. Size distributions of PCCAs were
measured with the NanoSight. ... 134 Figure 6-10: In vitro ultrasound images of MBs vaporized from droplets, demonstrating the
differences in the level of activation from non-sorted (top row) and size-sorted (bottom row) droplets. Both PCCA populations contained a PFC core of DFB. As a result of the smaller diameter PCCAs, the size-sorted droplets required the higher peak-negative pressures to vaporize at all visualized depths. ... 137 Figure 6-11: In vivo rat kidney (circled) ultrasound images of MBs formed from activated
droplets. NDs were administered to rodent models, and imaging was conducted of the right kidney. The figure demonstrates a single animal, over a 20min period, after one injection of size-sorted NDs. Activation pulses for PCCAs vaporization were transmitted at 4.5 MPa (peak negative pressure). ... 138 Figure A-1: Clinical Chemistry Results. BUN levels are grouped by imaging parameters
and endpoint. Results of paired T-test indicate a statistically significant increase in BUN levels for subjects in the high MI group after 2 weeks (p-value from 0.001 to 0.01 is marked with a ‘**’). No statistical significance was observed in the low MI groups. Average BUN values remained within normal range for female
Fischer rat (15 to 24 mg/dL, dashed lines). ... 149 Figure A-2: Histopathology Results. Kidney for both low and high destruction pulses at 24
hours and 2 weeks. Data is displayed as the mean ± standard error of the mean (SEM). ... 150 Figure B-1: Representative histopathology images (cortex and medulla) of the imaged
kidney from one animal per treatment group. Images of the cortex
(60X magnification) are on the left and the medulla (40X magnification) are on the right. (1A-B) The representative image of decafluorobutane (DFB) at a mechanical index (MI) of 1.9 depicts red blood cell (RBC) casts (black arrows) and proteinaceous cellular debris in the lumen of a tubule (white arrow) in the cortex. RBC casts were not present in the medulla. (2A-B) Representative images of 1:1 mix at an MI of 1.9 show RBC casts in both the cortex and medulla (black arrows) and cellular and nuclear debris, likely from a necrotic tubular
epithelial cell. (3A-B) In octafluoropropane (OFP) at an MI of 1.9 representative images, RBC casts and protein casts are indicated with black and yellow arrows respectively. Cellular debris was also seen in this animal with associated
xv
ABBREVIATIONS
3D Three-dimension
ADV Acoustic droplet vaporization
APS Ammonium Persulfate
AUC Area under the Curve
C3C4 1:1 Octafluoropropane-Decafluorobutane
C4 Decafluorobutane
C4C5 1:1 Dodecafluoropentane-Decafluorobutane
C5 Dodecafluoropentane
CEUS Contrast-enhanced ultrasound
DDFP Dodecafluoropentane
DFB Decafluorobutane
DSPC 1, 2-distearoyl-sn-glycero-3-phosphocholine
DSPE 1, 2-distearoyl-sn-glycero-3-phosphoethanolamine-N-methoxy
EPR Enhanced Permeability and Retention
FDA Food and Drug Administration
HIFU High-intensity focused ultrasound
MB Microbubbles
MR Magnetic resonance
NB Nanobubbles
ND Nanodroplet
OFP Octafluoropropane
PCCA Phase-change contrast agents
PEG Polyethylene glycol
PEG2000 polyethylene glycol-2000
PFC Perfluorocarbon
PNP Peak negative pressure
xvi
SEM Scanning electron microscopy
TEM Transmission electron microscopy
TEMED Tetramethylethylenediamine
TIPS Therapeutic Imaging Probe System
1 CHAPTER 1
INTRODUCTION
1.1 MEDICAL ULTRASOUND
Ultrasound is well known in the field of medical imaging for being portable,
inexpensive, and its non-ionizing mechanism of action, making ultrasound is accessible to
use in vulnerable patient populations and low resource settings [1]. Unlike magnetic
resonance (MR) imaging, ultrasound can be quickly implemented by a patient’s bedside
Additionally, imaging can be performed in real-time, providing information from anatomical
features from B-mode, vessel flow maps from Doppler imaging, and mechanical properties
of tissue from elastography [2], [3]. Ultrasound does have limitations. Imaging has a limited
field of view, particularly in comparison to modalities like MR and computerized
tomography (CT). Neither does ultrasound have the resolution capabilities of optical
modalities, like confocal imaging. Today, ultrasound imaging has expanded from the grainy
image quality the technology is traditionally known for producing. Developments in
ultrasound imaging span across hardware and software, including transducer material and
design, as well as sophisticated imaging processing techniques to reduce noise and improve
signal contrast. While ultrasound continues to develop in improving image quality,
developers strive to maintain the major benefits previously discussed that separate ultrasound
from the other imaging modalities.
1.1.1 Mechanism of Ultrasound Imaging
Ultrasound can be defined as mechanical waves of greater frequency than that of
2
frequencies, piezoelectric material is encased in a device known as a transducer. A transducer
can be manufactured with one piece of piezoelectric material (referred to as a single-element
transducer), or multiple smaller sections that are operated together or separately (referred to
as a multi-element transducer or array) [2]. The transducer is designed to efficiently convert
electric pulses into sound waves, and respond to incoming sound waves by converting the
mechanical stimulations of the received acoustic wave into electric signals. Through signal
processing techniques, the received electrical signal is amplified, digitized, and spatially
localized (in a process known as beamforming) in order to produce an image. This process
can be completed on the order of milliseconds, enabling real-time imaging (see Figure 1-1).
Figure 1-1: A generalized block diagram of the transmit (bottom) and receive (top) processes that are implemented to generate an ultrasound image using a multi-element (total of N elements) transducer. In the diagram, a preclinical kidney with contrast agents flowing in the vessels results in the contrast-enhanced ultrasound image presented in the “Image Display”. Image was produced by my colleague, Dr. Kennita Johnson.
When ultrasound is transmitted into the body, the mechanical wave propagates
through tissue. When the wave experiences a change in impedance, which describes the
density and compressibility of a material, the wave is scattered in multiple directions,
including reflected back to the transducer. The forward scattered wave continues in the
3
that is backscattered to the transducer is used to produce the ultrasound images.
Computational analysis of the returning sound waves takes into consideration the time it took
the wave to leave the element of the transducer and return (known as time of flight) and then
factors the estimated speed the wave traveled through a given medium. For tissue like the
kidney, an estimated speed of sound is about 1,565 m/s, while in tissue like the lung (which
contain air) and the skull, an estimated speed of sound is 600 m/s and 4,080 m/s, respectively
[2].
For a multi-element transducer, the received signal for each element is amplified and
digitized. Then, the spatial location of the returned signal is calculated using time of flight
and speed of sound information. A final signal amplitude is found by summing the spatially
corresponding signal across the elements of the transducer, and demodulating this signal
through envelope detection. Finally, dynamic compression, which determines how bright a
pixel will be in comparison to other pixels in the image, as well as any filtering techniques to
improve image quality, are completed prior to displaying the image on the system’s monitor.
This process can be completed multiple times in a second, resulting in real-time video of the
4
Figure 1-2: Diagram demonstrating the predicted received signal from one element in a multi-element transducer, when positioned to image a kidney. The transmitted signal, shown as a one cycle sinusoid, is reflected at the kidney boundaries and received by the transducer, corresponding to the upper and lower boundaries of the kidney and surrounding tissue.
The physical mechanism of ultrasound allows the modality to be used for more than
just imaging. Sound waves can produce biological responses to tissue as a result of the
mechanical nature of the wave. These mechanical effects range in severity, and are controlled
by acoustic parameters, such as frequency, pressure amplitude, and exposure time.
Ultrasound waves can be designed to push tissue, and subsequently monitor the displacement
of the tissue. This field of imaging, known as elastography, can then be implemented to
characterize tissue and the state of pathophysiology [4]. As well, ultrasound can be designed
5
mechanical effects towards surrounding tissue [5]. Known as sonoporation, the phenomena
can cause microstreams or microjets capable of puncturing cellular membranes and opening
intercellular junctions [5]. Parameters of the wave can also be designed to transform the
acoustic wave into a shock wave as it travels through tissue, capable of inducing tissue
damage. This technique is known clinically as histotripsy, when targeting soft tissue, or
lithotripsy when targeting calcified materials, like gallbladder and kidney stones [6].
The second way acoustic waves can affect biological tissue is by thermal effects.
When ultrasound is transmitted, the wave is attenuated (decreased carrying energy) by way
of the sound wave scattering as it experiences density changes, or energy absorption by the
tissue. The main mechanism of energy absorption is from frictional heat loss. As the
mechanical wave travels, molecules in the medium rub against one another, and the energy of
momentum is transformed into heat [6], [7]. Like the mechanical effects, by controlling the
intensity of the sound wave, the thermal effects can be kept minimal, to a few degrees,
similar to a fever. This technique, known as mild hyperthermia, has been shown to improve
drug delivery to cancerous tissue [8], [9]. Thermal effects from ultrasound can also be
intensified to rapid thermal injury, in which cell death is induced in a matter of seconds. The
latter is categorized as high-intensity focused ultrasound (HIFU) ablation.
These biological responses, both mechanical and thermal in nature, can be utilized for
therapeutic purposes, but in diagnostic imaging, where the purpose is to observe and
diagnose the physiological state of the organ of interest, it is imperative that any potential
biological response by the diagnostic imaging modality be minimized. The United States
6
and implementation of regulatory policies in order to maintain the safety of all medical
devices and therapeutic drugs.
1.1.2 FDA Regulations for Diagnostic Ultrasound Imaging
To address the sources of bioeffects from ultrasound imaging, thermal and
mechanical, the FDA developed the thermal index (TI) and mechanical index (MI) as metrics
to display on imaging systems to gauge the risk of inducing these bioeffects for a given
imaging procedure. The limits the FDA places on ultrasound systems depend on the system’s
intended use. Typically, the derated spatial-peak temporal average intensity (Ispta.3) cannot
exceed 720 mW/cm-2 (see Eqn. 1-1) [10]. The spatial-peak temporal-average intensity is
derated by a value of 0.3 dB cm-1 MHz-1 to account for wave attenuation through tissue. In
the equation, PP2P represents the peak-to-peak pressure (MPa), Tpulse represents the time the
transducer is transmitting (sec), z is the acoustic impedance of the tissue, and Tprf is the time
interval of the pulses (sec). The TI is a ratio of the acoustic power output (Woutput, in Watts)
divided by the power necessary to raise the temperature of tissue one degree Celsius (Wdeg)
[11] (see Eqn 1-2). When acoustic parameters exceed a value of 1.0, it is necessary for the TI
value to be displayed on the imaging system. The FDA regulates diagnostic ultrasound
procedures to remain below 6.0. The MI, which may also be displayed on imaging systems,
addresses the risk of cavitation of innate gas bubbles created in tissue. As Eqn. 1-3 shows,
MI is the derated peak negative pressure (PNPder) divided by the square root of the transmit
center frequency (fc) [11]. The peak negative pressure is derated by 0.3 dB cm-1 MHz-1.
𝐼 720 𝑚𝑊/𝑐𝑚 Eqn. 1-1
7
𝑀𝐼 1.9 Eqn. 1-3
It is important to note that these guidelines apply to diagnostic ultrasound systems
alone. The FDA is currently reviewing and approving uses of contrast agent technology for
diagnostic ultrasound imaging, which means refining previously described acoustic limits
when developing imaging protocols for the presence of contrast agents. In the next section,
we will discuss the use of ultrasound contrast agents for both imaging and therapeutic
applications.
1.2 ULTRASOUND CONTRAST AGENT 1.2.1 Microbubbles
Ultrasound contrast agents (UCAs) overcome a major limitation in imaging blood
vessels with ultrasound. Doppler imaging is a technique in ultrasound that utilizes the shift in
phase of received acoustic signal when sound waves are reflected from a moving scatterer
[3]. With Doppler imaging, flow velocity color maps of vessels can be created in real-time.
While Doppler imaging has advanced as a technique for characterizing blood flow in
real-time, and without the need for administering any contrast agents, the technology
possesses shortcomings, mainly low sensitivity to blood velocity, and poor resolution,
therefore, capillary networks are impossible to resolve. In addition, blood does not scatter
sound waves very well. UCAs provide a large change in impedance in the anatomical field,
resulting in substantial signal return. Predominant UCAs in commercial use are in the
1-10µm range, with a lipid, protein, or polymer shell, surrounding a gas-core, like
8
(MBs). As a result of their gas-core, MBs oscillate in an acoustic field, producing a
broadband acoustic signal. This nonlinear property of MBs makes their signal response
distinctly different from the linear response of tissue, enabling sophisticated signal isolation
from tissue [12]. As a result of their size range, MBs are limited to vasculature, making them
an ideal blood-marker. Applications of MBs in ultrasound imaging widely range in
diagnostic imaging. Contrast enhanced ultrasound (CEUS) utilizes MBs to diagnosis and
monitor diseases in the kidney [14]–[17], prostate [18], [19], breast [20]–[22], and even
atherosclerotic plaque [23]–[25]. Clinically, the FDA has approved MBs use for
echocardiography and hepatocellular carcinoma diagnosis [26].
Applications of therapeutic ultrasound have expanded with the inclusion of MBs. As
a source of cavitation, MBs allow the same therapeutic targets previously described to be
achieved at lower acoustic thresholds. In the absence of MBs, therapeutic ultrasound relies
on innate gas bubbles to induce mechanical effects, which will vary greatly depending on
tissue type. Administering MBs assures presence of cavitation seeds to aid in therapeutic
efficacy. Current research includes increasing drug delivery beyond barriers like the
blood-brain barrier [27], [28] and difficult to reach tumors [29], [30]. This use of MBs to modulate
vessel and cellular membrane permeability is known as sonoporation. Other therapeutic
ultrasound techniques have shown improved results in the presence of MB technology,
including thermal ablation [31], [32] and sonothrombolysis [33].
MBs have their limitations. First and foremost, the half-life of MBs are on the order
of minutes [34]. For applications in imaging and therapy, it can be advantageous to utilize a
longer circulating UCA. Second, the typical size distribution of MBs limits extravascular
9
to a contrast agent. Over time, the contrast agent will passively attach to the desired target,
allowing users to indirectly image the presence of target in an organ of interest [35]. A longer
circulation time will increase the probability and density of targeted UCAs correctly binding
to their target. In a tumor, where leaky vasculature can result in the passive escape of UCAs
out of tumor vasculature, a smaller UCA has the potential to bind to targets previously
inaccessible [36], [37]. These limitations of MBs also affect therapeutic ultrasound
applications. Though MBs are capable of inducing heating in tissue, there are concerns with
off target effects. As Moyer et al. [38] showed, ablating tissue with MBs not only increases
the temperature at the focus, but also in the near-field tissue. In response to MBs gaseous
form, wherever there is a sufficient acoustic field, the MBs present will cavitate. The
potential for extravascular presence of UCAs could open therapeutic delivery and thermal
ablation beyond vasculature. One solution for overcoming the limitations of MBs is through
the use of phase-change contrast agents (PCCAs).
1.2.2 Phase-change Contrast Agents
Gas-filled UCAs have expanded the capability for the use of medical ultrasound in
both therapy and diagnostic imaging. PCCAs, a liquid-filled counterpart to traditional UCAs,
provide the same unique harmonic signatures of commercial UCAs, once vaporized to a
gas-core, but their initial nanometer diameter range and particle stability (from the liquid-core)
should allow them to enter extravascular spaces inaccessible to traditional agents.
Additionally, in their liquid state, PCCAs are ineffective at oscillating in an acoustic field,
until the agents are vaporized to a gas, in a process known as acoustic droplet vaporization
(ADV). ADV can be accomplished through thermal means, or high-intensity acoustic pulses.
10
MR and PET [39], [40], where ADV is not necessary. For the rest of this discussion, PCCAs
will be acknowledged for their use in therapeutic and diagnostic ultrasound.
PCCAs are often formulated similarly to MBs, meaning they include a lipid, polymer,
or protein shell with an inert PFC core [41] (see Fig. 1-3). Their liquid-core allows for a
variety of fabrication methods, including microfluidic device manufacturing, extrusion
methods, sonication and agitation of lipid/PFC emulsions, and condensation of MBs to
PCCAs [42], [43]. Initial formulations included PFCs, like perfluorohexane (PFH, C6F14,
boiling temperature= 57ºC) and dodecafluoropentane (DDFP, C5F12, boiling temperature=
29ºC), which are liquid at room temperature. These particles can require pressure amplitudes
(above the FDA MI limit of 1.9) to vaporize [44], [45]. To enable PCCA use for diagnostic
imaging, our lab developed a condensation method that would enable low-boiling PFCs, like
octafluoropropane (OFP, C3F8, boiling temperature= -37ºC) and decafluorobutane (DFB,
C4F10, boiling temperature= -2ºC) to be formulated as MBs and converted to PCCAs [44],
[46]. These particles maintain liquid-cores above boiling temperatures of their bulk PFC as
demonstrated by in vivo stability studies conducted by Sheeran et al [47]. In this study,
rodent kidney perfusion imaging demonstrated increased circulation half-life of PCCAs
containing low-boiling PFCs as compared to MBs. PCCA in vivo stability can be explained
by homogenous nucleation theory as shown by Mountford et al [48].
PCCA imaging sequences can include a high MI focused activation pulse (MI>1.0)
that will specify a region of PCCA vaporization, followed by contrast imaging of the present
bubbles (MI<0.1) [44], [49]. The spatial selectivity provided by the activation requirement
11
correction, while PCCA in vivo stability and mean diameter range has advantages for
molecular imaging, specifically targeted tumor imaging [37].
In therapeutic applications, the properties of spatial selectivity with PCCAs, in vivo
stability, and decreased size distribution are compelling for utilization of PCCA technology.
To date, therapeutic research for PCCAs spans from sonothrombolysis [37], [50], [51], gene
and drug delivery [52]–[54], to blood-brain-barrier opening [55], histotripsy [56], [57], and
HIFU [54], [58], [59]. As compared to diagnostic imaging, therapeutic ultrasound has an
expanded range in acoustic output, enabling the use of the higher-boiling PFC as well as the
low-boiling PFC formulations for PCCA use. Ultimately, more investigation is required to
improve PCCA technology for the diverse applications in therapy and diagnostic imaging,
beginning with the technology’s formulation and how this will impact the desired in vivo
12
Figure 1-3: Design components of PCCA technology, describing considerations for fabrication, shell composition, and inner core that will impact acoustic response and particle stability. The inner core of PCCAs can contain (but are not limited to) octafluoropropane (OFP), decafluorobutane (DFB), dodecafluoropentane (DDFP), perfluorohexane (PFH), and perfluorooctylbromide (PFOB). The information portrayed in this figure was reproduced from Lea-Banks et al [43] with permission from Elsevier1.
1.3 OBJECTIVE
PCCAs are uniquely positioned in their development to address multiple limitations
in medical applications of UCAs (as described previously). As the technology progresses in
each of these application areas, questions concerning ideal formulation given application
requirements will arise, particularly when considering safety and efficacy. Through design
considerations, some of which are shown in Figure 1-3, PCCA technology can be improved
to better tailor PCCAs for each application in therapeutic and diagnostic imaging. What is
1Reprinted from “Ultrasound-responsive droplets for therapy: A review”, vol. 293, H.
13
needed towards this goal is an understanding of the intersection of contrast formulation,
acoustic parameters, and the resulting in vivo response. Whether the question is minimizing
the in vivo bioeffects from PCCA-mediated contrast-enhanced ultrasound, or engineering
PCCAs for an intended therapeutic outcome, it is vital to optimize PCCA formulation for
improved in vivo bioeffects.
1.4 DISSERTATION OUTLINE
In this dissertation, I explored this intersection of PCCA formulation, acoustic
parameters, and the desired in vivo response for the use of PCCAs in medical ultrasound. I
hypothesized that by optimizing PCCA formulation and adjusting acoustic parameters, I
could develop a technique that would generate the desired in vivo bioeffects for given
applications in imaging and therapy. This work is split into two parts. In the first half, I will
address reducing unwarranted bioeffects in diagnostic imaging with PCCAs. In chapter 2, I
will present my work exploring potential bioeffects from a MB-mediated ultrasound
technique, which utilizes a similar high MI imaging sequence as is used for PCCA imaging.
This work will lay a foundation for the investigation of potential bioeffects of
PCCA-mediated contrast imaging in chapter 3, which will focus on the in vivo tissue response to the
vaporization phase of PCCA imaging.
In the second half, I will explore PCCA formulation and acoustic parameters for
therapeutic ultrasound, beginning with an introduction to the mechanisms driving
PCCA-mediate therapeutic ultrasound in chapter 4. In chapter 5, I will investigate the impact of
tissue-14
mimicking phantom. Finally, I will conclude by introducing the current challenges of
15 REFERENCES
[1] S. P. Shah et al., “Impact of the introduction of ultrasound services in a limited
resource setting: Rural Rwanda 2008,” BMC Int. Health Hum. Rights, vol. 9, no. 1, pp. 1–6, 2009.
[2] J. A. Zagzebski, Essentials of Ultrasound Physics. Mosby, 1996.
[3] W. J. Zwiebel and R. Sohaey, Introduction to Ultrasound. WB Saunders Company, 1998.
[4] R. M. S. Sigrist, J. Liau, A. El Kaffas, M. C. Chammas, and J. K. Willmann, “Ultrasound elastography: Review of techniques and clinical applications,”
Theranostics, vol. 7, no. 5, pp. 1303–1329, 2017.
[5] A. Bouakaz, A. Zeghimi, and A. A. Doinikov, “Sonoporation: Concept and mechanisms,” Adv. Exp. Med. Biol., vol. 880, pp. 175–189, 2016.
[6] M. R. Bailey, V. A. Khokhlova, O. A. Sapozhnikov, S. G. Kargl, and L. A. Crum, “Physical mechanisms of the therapeutic effect of ultrasound (a review),” Acoust.
Phys., vol. 49, no. 4, pp. 369–388, 2003.
[7] W. J. Fry, V. J. Wulff, D. Tucker, and F. J. Fry, “Physical Factors Involved in Ultrasonically Induced Changes in Living Systems: I. Identification of Non-Temperature Effects,” J. Acoust. Soc. Am., vol. 22, no. 6, pp. 867–876, 1950.
[8] G. Kong, R. D. Braun, and M. W. Dewhirst, “Characterization of the Effect of Hyperthermia on Nanoparticle Extravasation from Tumor Vasculature,” no. 25, pp. 3027–3032, 2001.
[9] L. Li et al., “Improved intratumoral nanoparticle extravasation and penetration by mild hyperthermia,” J. Control. Release, 2013.
[10] R. (FDA) Phillips and G. (FDA) Harris, “Information for Manufacturers Seeking Marketing Clearance of Diagnostic Ultrasound Systems and Transducers,” 2008.
[11] S. B. Barnett, G. R. Ter Haar, M. C. Ziskin, H. D. Rott, F. A. Duck, and K. Maeda, “International recommendations and guidelines for the safe use of diagnostic ultrasound in medicine,” Ultrasound Med. Biol., 2000.
16
[13] K. Ferrara, R. Pollard, and M. Borden, “Ultrasound microbubble contrast agents: fundamentals and application to gene and drug delivery.,” Annu. Rev. Biomed. Eng., vol. 9, pp. 415–47, Jan. 2007.
[14] S. K. Kasoji, E. H. Chang, L. B. Mullin, W. K. Chong, W. K. Rathmell, and P. A. Dayton, “A Pilot Clinical Study in Characterization of Malignant Renal Cell
Carcinoma Subtype with Contrast-Enhanced Ultrasound.,” Ultrason. Imaging, pp. 1– 11, 2016.
[15] E. H. Chang, W. K. Chong, S. K. Kasoji, P. A. Dayton, and W. K. Rathmell,
“Management of Indeterminate Cystic Kidney Lesions: Review of Contrast-enhanced Ultrasound as a Diagnostic Tool,” Urology, vol. 87, pp. 1–10, 2016.
[16] A. Nilsson, “Contrast–enhanced ultrasound of the kidneys,” Eur. Radiol. Suppl., vol. 14, no. S8, pp. P104–P109, 2004.
[17] S. V. Setola, O. Catalano, F. Sandomenico, and A. Siani, “Contrast-enhanced sonography of the kidney,” Abdom. Imaging, vol. 32, no. 1, pp. 21–28, 2007.
[18] M. Wink et al., “Contrast-Enhanced Ultrasound and Prostate Cancer; A Multicentre European Research Coordination Project,” European Urology, vol. 54, no. 5. pp. 982– 993, 2008.
[19] M. P. J. Kuenen, M. Mischi, and H. Wijkstra, “Contrast-ultrasound diffusion imaging for localization of prostate cancer,” IEEE Trans. Med. Imaging, vol. 30, no. 8, pp. 1493–1502, 2011.
[20] A. Sridharan et al., “Quantitative analysis of vascular heterogeneity in breast lesions using contrast-enhanced 3-D harmonic and subharmonic ultrasound imaging,” IEEE
Trans. Ultrason. Ferroelectr. Freq. Control, vol. 62, no. 3, pp. 502–510, 2015.
[21] E. Cassano, S. Rizzo, A. Bozzini, S. Menna, and M. Bellomi, “Contrast enhanced ultrasound of breast cancer,” Cancer Imaging, vol. 6, no. 1, pp. 4–6, 2006.
[22] X.-L. Cao et al., “Contrast-Enhanced Ultrasound Characteristics of Breast Cancer: Correlation with Prognostic Factors,” Ultrasound Med. Biol., vol. 40, no. 1, pp. 11–17, 2014.
[23] S. B. Feinstein, “Contrast Ultrasound Imaging of the Carotid Artery Vasa Vasorum and Atherosclerotic Plaque Neovascularization,” Journal of the American College of
Cardiology, vol. 48, no. 2. pp. 236–243, 2006.
17
plaque lesions,” American Journal of Roentgenology, vol. 198, no. 1. 2012.
[25] J. Ma, X. Jiang, K. H. Martin, and P. A. Dayton, “Small aperture, dual frequency ultrasound transducers for intravascular contrast imaging,” in IEEE International
Ultrasonics Symposium, IUS, 2013, pp. 769–772.
[26] R. G. Barr, “Contrast enhanced ultrasound for focal liver lesions: how accurate is it?,”
Abdom. Radiol., pp. 1–6, 2017.
[27] C. Bing, M. Ladouceur-Wodzak, C. R. Wanner, J. M. Shelton, J. a Richardson, and R. Chopra, “Trans-cranial opening of the blood-brain barrier in targeted regions using a stereotaxic brain atlas and focused ultrasound energy.,” J. Ther. Ultrasound, vol. 2, no. 1, p. 13, 2014.
[28] A. Burgess et al., “Alzheimer Disease in a Mouse Model: MR Imaging–guided Focused Ultrasound Targeted to the Hippocampus Opens the Blood-Brain Barrier and Improves Pathologic Abnormalities and Behavior,” Radiology, 2014.
[29] G. Dimcevski et al., “A human clinical trial using ultrasound and microbubbles to enhance gemcitabine treatment of inoperable pancreatic cancer,” J. Control. Release, vol. 243, pp. 172–181, 2016.
[30] T. Bettinger and F. Tranquart, “Design of microbubbles for gene/drug delivery,” Adv.
Exp. Med. Biol., 2016.
[31] B. C. Tran, J. Seo, T. L. Hall, J. B. Fowlkes, and C. a. Cain, “Microbubble-enhanced cavitation for noninvasive ultrasound surgery,” IEEE Trans. Ultrason. Ferroelectr.
Freq. Control, vol. 50, no. 10, pp. 1296–1304, 2003.
[32] C. C. Coussios, C. H. Farny, G. Ter Haar, and R. a Roy, “Role of acoustic cavitation in the delivery and monitoring of cancer treatment by high-intensity focused
ultrasound (HIFU).,” Int. J. Hyperthermia, vol. 23, no. 2, pp. 105–120, 2007.
[33] J. Kim et al., “Intravascular forward-looking ultrasound transducers for microbubble-mediated sonothrombolysis,” Sci. Rep., 2017.
[34] L. Mullin, R. Gessner, J. Kwan, M. Kaya, M. a Borden, and P. a Dayton, “Effect of anesthesia carrier gas on in vivo circulation times of ultrasound microbubble contrast agents in rats.,” Contrast Media Mol. Imaging, vol. 6, no. 3, pp. 126–31, 2011.
18
[36] P. S. Sheeran, J. E. Streeter, L. B. Mullin, T. O. Matsunaga, and P. A. Dayton, “Toward Ultrasound Molecular Imaging With Phase-Change Contrast Agents: An In Vitro Proof of Principle,” Ultrasound Med. Biol., vol. 39, no. 5, pp. 893–902, 2013.
[37] P. S. Sheeran and P. A. Dayton, “Phase-Change Contrast Agents for Imaging and Therapy,” Curr. Pharm. Des., vol. 18, no. 15, pp. 2152–2165, Mar. 2012.
[38] L. C. Moyer, K. F. Timbie, P. S. Sheeran, R. J. Price, G. W. Miller, and P. A. Dayton, “High-intensity focused ultrasound ablation enhancement in vivo via phase-shift nanodroplets compared to microbubbles,” J. Ther. Ultrasound, vol. 3, no. 1, p. 7, 2015.
[39] S. H. Shin et al., “Tracking Perfluorocarbon Nanoemulsion Delivery by 19 F MRI for Precise High Intensity Focused Ultrasound Tumor Ablation,” Theranostics, vol. 7, no. 3, pp. 562–572, 2017.
[40] N. Amir et al., “18F-Labeled perfluorocarbon droplets for positron emission tomography imaging,” Nucl. Med. Biol., 2017.
[41] S. R. Sirsi and M. A. Borden, “State-of-the-art materials for ultrasound-triggered drug delivery,” Advanced Drug Delivery Reviews. 2014.
[42] Y. Zhou, “Application of acoustic droplet vaporization in ultrasound therapy,” J. Ther. Ultrasound, vol. 3, no. 1, pp. 1–18, 2015.
[43] H. Lea-Banks, M. A. O’Reilly, and K. Hynynen, “Ultrasound-responsive droplets for therapy: A review,” J. Control. Release, vol. 293, no. November 2018, pp. 144–154, 2019. DOI:10.1016/j.jconrel.2018.11.028
[44] P. S. Sheeran et al., “Decafluorobutane as a phase-change contrast agent for low-energy extravascular ultrasonic imaging.,” Ultrasound Med. Biol., vol. 37, no. 9, pp. 1518–30, Sep. 2011.
[45] O. Shpak, M. Verweij, H. J. Vos, N. de Jong, D. Lohse, and M. Versluis, “Acoustic droplet vaporization is initiated by superharmonic focusing,” Proc. Natl. Acad. Sci., vol. 111, no. 5, pp. 1697–1702, 2014.
[46] P. S. Sheeran, S. Luois, P. a Dayton, and T. O. Matsunaga, “Formulation and acoustic studies of a new phase-shift agent for diagnostic and therapeutic ultrasound.,”
Langmuir, vol. 27, no. 17, pp. 10412–20, Sep. 2011.
Low-19
Boiling-Point Nanoscale Phase-Change Perfluorocarbon Agents,” Ultrasound Med.
Biol., vol. 41, no. 3, pp. 814–831, 2015.
[48] P. A. Mountford and M. A. Borden, “On the thermodynamics and kinetics of
superheated fluorocarbon phase-change agents,” Adv. Colloid Interface Sci., vol. 237, pp. 15–27, 2016.
[49] J. Rojas and P. A. Dayton, “Optimizing Acoustic Activation of Point Phase Change Contrast Agents with Activation Pressure Matching Method,” IEEE Trans. Ultrason.
Ferroelectr. Freq. Control, 2016.
[50] D. Pajek, A. Burgess, Y. Huang, and K. Hynynen, “High-Intensity Focused
Ultrasound Sonothrombolysis: The Use of Perfluorocarbon Droplets to Achieve Clot Lysis at Reduced Acoustic Power,” Ultrasound Med. Biol., vol. 40, no. 9, pp. 2151– 2161, 2014.
[51] K. B. Bader, G. Bouchoux, and C. K. Holland, “Sonothrombolysis,” Advances in
Experimental Medicine and Biology, vol. 880. pp. 339–362, 2016.
[52] P. A. Dayton et al., “Application of Ultrasound to Selectively Localize Nanodroplets for Targeted Imaging and Therapy,” vol. 5, no. 3, pp. 160–174, 2006.
[53] S. M. Fix, A. Novell, Y. Yun, P. A. Dayton, and C. B. Arena, “An evaluation of the sonoporation potential of low-boiling point phase-change ultrasound contrast agents in vitro,” J. Ther. Ultrasound, vol. 5, no. 1, p. 7, 2017.
[54] N. Rapoport, “Drug-loaded perfluorocarbon nanodroplets for ultrasound-mediated drug delivery,” Adv. Exp. Med. Biol., vol. 880, pp. 221–241, 2016.
[55] C. C. Chen, P. S. Sheeran, S. Y. Wu, O. Olumolade, P. a. Dayton, and E. E.
Konofagou, “Targeted drug delivery with focus ultrasound-induced blood-brain barrier opening Using acoustically-activated nanodroplets,” IEEE Int. Ultrason. Symp. IUS, vol. 172, no. 3, pp. 615–618, 2013.
[56] E. Vlaisavljevich et al., “Effects of Ultrasound Frequency on Nanodroplet-Mediated Histotripsy,” Ultrasound Med. Biol., vol. 41, no. 8, pp. 2135–2147, 2015.
[57] E. Vlaisavljevich et al., “Effects of Droplet Composition on Nanodroplet-Mediated Histotripsy,” Ultrasound Med. Biol., vol. 42, no. 4, pp. 931–946, 2016.
20 2015.
[59] J. A. Kopechek, E. Park, C. S. Mei, N. J. McDannold, and T. M. Porter,
21 CHAPTER 22
HISTOLOGICAL AND BLOOD CHEMISTRY EXAMINATION OF THE RODENT KIDNEY AFTER EXPOSURE TO FLASH-REPLENISHMENT ULTRASOUND
CONTRAST IMAGING
2.1 INTRODUCTION
Contrast-enhanced ultrasound (CEUS) with microbubble (MB) contrast agents has
been in use for decades outside the United States. However, use of FDA-approved ultrasound
contrast agents (UCAs) has been limited to echocardiography in the United States until April
2016, when Lumason was approved for adult and pediatric imaging of the liver. There are
several advantages of CEUS over contrast-enhanced computed tomography (CT) or magnetic
resonance imaging (MRI), including increased enhancement sensitivity due to lack of
contrast extravasation outside of the vasculature, lack of contrast nephrotoxicity, lack of
ionizing radiation, and the ability to capture real-time imaging[1], [2]. Of these, the lack of
nephrotoxicity has made CEUS of particular interest for kidney imaging since CT and MRI
contrast agents are sometimes contraindicated in patients with compromised kidney function
[3].
During a low mechanical-index (MI) CEUS study, wash-in of a bolus of MBs into the
area of interest is captured and saved as a cine loop [4]. However, this type of
non-destructive MB imaging only permits visualization of the target area once during contrast
2 This chapter was published in Ultrasonics. The original citation is as follows: A. G.
Nyankima, S. K. Kasoji, R. Cianciolo, P. A. Dayton, and E. H. Chang, “Histological and blood chemistry examination of the rodent kidney after exposure to flash-replenishment ultrasound contrast imaging,” Ultrasonics, 98, pp. 1-6, 2019.
22
wash in. Visualization of another region of interest or a repeat study requires waiting for
several minutes until the contrast has cleared circulation and can be re-administered.
Alternatively, CEUS studies can also be performed using a continuous infusion of MBs and
delivering moderate to high MI pulses (0.7-1.9) [5], [6], to disrupt the MBs and clear the
MB signal. This technique is referred to as destruction-reperfusion or flash-replenishment. It
allows for multiple cycles of contrast wash-in to be achieved in rapid succession, providing
the potential to image multiple planes of interest or to repeat visualization of flow dynamics
in a target region [5].
Though flash-replenishment has clinical advantages, there are biological concerns
with the use of higher MI imaging. When present in an acoustic field, the gas-filled agents
can resonate at varying magnitudes depending on the intensity of the field. If the acoustic
field is substantial enough, this cavitation can lead to mechanical bioeffects on the
surrounding tissue. As a result of the potential for injury, it is necessary to ensure safety of
the contrast agent in addition to determining clinical efficacy. In the case of CEUS imaging,
there are years of clinical experience with hundreds of thousands of patients that support a
negligible amount of severe adverse effects after administration [7]–[10]. However, the scope
of clinical data is limited because human histology samples are often not available since
biopsies are usually not performed at the time of imaging. Moreover, long-term clinical
follow-up has not been collected. In contrast, preclinical studies have investigated bioeffects
of CEUS extensively. Previous studies have observed bioeffects in organs like the lungs,
liver, intestines, and heart [11]–[15], but for the study presented, we will limit our focus to
23
Previous studies have assessed the potential bioeffects induced in the kidney during
ultrasound imaging with MBs, particularly in the kidney of rodent models [16]–[22].
Although there are many variables to be considered, such as acoustic pressure, center
frequency, duty cycle, attenuation, transducer focus, as well as bubble parameters such as
size and concentration, it is understood that under some conditions acoustic excitation of MB
contrast agents can cause renal hemorrhage. Miller et al. [19] demonstrated glomerular
capillary hemorrhage (GCH) in rat kidneys from microbubble-mediated diagnostic
ultrasound developed as a function of frequency and pressure of acoustic pulses delivered. In
the aforementioned study, the authors observed frequencies of 1.0, 1.5, 1.5, 2.3, 2.5, 3.2, 3.5,
5.0, and 7.5 MHz with respective peak negative pressures of 1.9, 2.3, 2.7, 3.7, 2.6, 2.3, 3.9,
5.6, and 5.9 MPa. Kidneys were exposed to these parameters for a 1 min duration of time. Of
these parameters, GCH was present in a range of frequencies from 1.5-3.2 MHz. Presence of
GCH was absent when maintaining the parameter 𝑃 𝑓 0.5, where Pr is the peak
rarefactional pressure (MPa) and f is the frequency of the pulse (MHz). It has also been
shown that with the use of appropriate acoustic parameters, renal MB imaging can be
performed while avoiding undesired bioeffects. In a rodent model, Johnson et al. [17]
observed no bioeffects after exposing kidney volumes to one sec MB destruction pulses,
transmitted at 7 MHz and peak negative pressure (PNP) of 5.03 MPa. These parameters
correlate to a MI of 1.9; the clinical maximum allowed setting for diagnostic ultrasound
imaging under the U.S. Food and Drug Administration (FDA). This imaging sequence was
followed by low energy contrast imaging at 7 MHz and an MI of 0.18 (PNP of 476 kPa). The
procedure was repeated three times across the kidney. At a lower frequency, Jiménez et al.
24
to a one sec MB destructive pulse at 1.5 MHz and an MI of 1.9 (PNP of 2.1 MPa). The study
included transmitting directly to the kidney in a single plane, and was repeated six times in a
single plane. The authors reported that no bioeffects were seen in histology or in
biochemical renal function parameters, and thus concluded that the ultrasound parameter
ranges tested did not result in tissue damage. The MI metric used in both the Jiménez et al.
[16] and Johnson et al. [17] study is different from the metric highlighted in Miller et al. [19],
in that the peak negative pressure in the MI metric is derated by a value of 0.3 dB cm-1 MHz-1
and divided by the square root of the transmitted center frequency.
Church and Miller [25] proposed that a combination of factors, specifically
microbubble size at a certain frequency and pressure threshold, is necessary for the onset of
bioeffects, such as GCH and petechial hemorrhage. Their kidney bioeffect model was tested
by Miller et al. (2017) and shown to be valid at the frequencies tested—3.6 MHz and 5.5
MHz [26]. Variations in acoustic parameters, including the frequency, pulse repetition
frequency of high MI pulses, acoustic focus, contrast dose, and exposure time, may be key
factors resulting in the disparate degree of kidney injury in the different studies. In addition,
protocol differences, including animal model, total exposure volume, and time of pathologic
assessment make direct comparison of the model developed in Church and Miller [25] to
models used in previous studies challenging [16], [17]. In general, there is a host of literature
available which reports parameter ranges which are more likely to cause in-vivo bioeffects
when microbubbles are exposed to ultrasound, (typically combinations of high pressures and
low frequencies) as well as a range of parameters which are generally considered safe [16]–
25
The success of CEUS safety in human patients can be attributed to the safety
guidelines that are used both in the United States and internationally by leading institutions in
ultrasound imaging [13]–[15], [27], which are largely founded on preclinical research.
Generally, in regards to concern for mechanical bioeffects from administered contrast agent
cavitation, it is recommended to maintain an MI below 0.4 during imaging [13]–[15].
However, in the Definity package insert [28], which includes FDA approved protocols,
Lantheus recommends imaging at an MI of 0.8 or below. It is also noted that factors, such as
contrast agent dose, transmit center frequency, PNP, acoustic exposure time, and transmit
pulse repetition frequency, can alter the level of bioeffects observed when imaging above an
MI of 0.4 [13], [15].
In light of these recommendations, we believe it is important to conduct bioeffect
experimentation to assure safety, when imaging outside of clinical recommendations, taking
into account specific imaging acoustic parameters (i.e. transmit frequency, MI, pulse
duration, etc.) and accompanying contrast agent parameters (i.e. the formulation and the
dosage). We therefore sought to replicate parameters similar to those used in high MI
flash-replenishment imaging of humans to determine if these parameters would generate similar
injury as seen in preclinical studies, i.e. GCH. Specifically, bioeffects were measured after an
imaging sequence that included flash pulses, above an MI of 0.8 and limited to one second
in exposure, followed by contrast imaging pulses (MI<0.4). Though the experiment included
a pre-clinical dose regimen of contrast agents (much higher dose than is recommended for
human use), the study was intended to assess the combination of the flash-sequence and the
following CPS imaging. These sequences were repeated across the kidney volume to