ABSTRACT
BAEK, SEUNGHUN. Design Considerations of High Voltage and High Frequency Transformer for Solid State Transformer Application. (Under the direction of Dr. Subhashish Bhattacharya).
Design Considerations of High Voltage and High Frequency Transformer for Solid State Transformer Application
by Seunghun Baek
A thesis submitted to the Graduate Faculty of North Carolina State University
in partial fulfillment of the requirements for the degree of
Master of Science
Electrical Engineering
Raleigh, North Carolina 2009
APPROVED BY:
_______________________________ ______________________________ Dr. Subhashish Bhattacharya Dr. Alex Huang
Committee Chair
ACKNOWLEDGMENTS
First and the foremost, I would like to thank my advisor, Dr. Subhashish Bhattacharya. Dr. Bhattacharya led me to study MS program at North Carolina State University and presented me this great opportunity to work in FREEDM Center. I could have courage and will to study in this area thanks to his enthusiasm, knowledge and especially generous advice and care to students in and out. I would not have done this work without him.
I would also like to thank committee members Dr. Alex Q. Huang and Dr. Baran for their valuable lectures and support. Their teaching and knowledge have been always the best source to overcome obstacles and precede my research.
I want to express my gratitude to all the members in SPEC, especially, Jaesung Jung, Jeesung Jung, Jinseok Park, Sungkeun Lim, Woongje Sung who care me like a family and Yu Du who has been helping me with academic advice.
I also very grateful to my friends, Hyoungtae Cho, Jaesuk Lee, Jongmin Lim and Young Cho who have been a good friend since we met in Chicago and Mamiko Arai.
Most importantly, I can never exaggerate my gratitude to my family in Korea, father, mother and elder brother and sister in law who became a member of our family and my lovely niece.
TABLE OF CONTENTS
LIST OF TABLES...v
LIST OF FIGURES...vi
1 INTRODUCTION ...1
2 SOLID STATE TRANSFORMER TOPOLOGIES AND REQUIREMENTS FOR HIGH FREQEUNCY TRANSFORMER ...3
2.1 Solid State Transformer Topology and operating principle...3
2.2 Required Leakage Inductance with respect to Operating Frequency ...9
3 CORE MATERIAL AND STRUCTURE SELECTION... 11
3.1 Core Material Comparison... 11
3.1.1 Silicon Steel... 11
3.1.2 Amorphous Alloy ... 13
3.1.3 Nanocrystalline ... 14
3.2 Core Selection for Operating Frequency of 3kHz ... 15
3.3 Core Selection for Operating Frequency of 20kHz ... 17
3.4 Wire Selection ... 19
3.5 Comparison and Selection of Transformer Structure ... 20
3.5.1 Duality of Solenoidal and Coaxial Winding Transformers... 20
4 LOSS AND ELECTROMAGNETIC ANAYSIS OF SOLENOIDAL WINDING TRANSFORMER DESIGN ... 25
4.1 Core Loss ... 25
4.2 Winding Loss ... 26
4.3 Inductance Analysis ... 28
4.3.1 Magnetic Field Distributions in Core ... 29
4.3.2 Magnetizing Inductance Analysis... 31
4.3.3 Leakage Inductance Analysis with Separate Winding... 33
4.3.4 Leakage Inductance Analyses with Layered Winding... 36
4.4 Energy Base Magnetizing and leakage inductance Calculation by Simulation ... 37
4.4.1 Energy in a Coupled Circuit ... 37
4.4.2 Procedure to Calculate the Inductance based on Simulation Data ... 39
4.5 Winding capacitance calculation ... 40
5 LOSS AND ELECTROMAGNETIC ANAYSIS OF COAXIAL WINDING TRANSFORMER DESIGN ... 42
5.1 Power Loss ... 42
5.2 Inductance Analysis in Coaxial Winding Transformer ... 43
5.2.1 Magnetic field distribution in cylindrical structure ... 43
5.2.2 Magnetizing Inductance Analysis... 47
6.1 Electric Breakdown and Partial Discharge ... 51
6.2 Electric Stress Distribution in Multiple Dielectric Insulation System... 52
6.2.1 Parallel electrode... 54
6.2.2 Concentric electrode ... 55
6.3 Insulation Strategy... 56
7 TRANSFORMER DESIGN PROCEDURE... 64
7.1 Area Product and Power Capability ... 64
7.2 Relationship between the Flux Density and the Voltage ... 65
7.3 Relationship between Frequency, Flux density and the Number of Turns... 67
7.4 Core loss and Size with respect to Frequency, Flux density... 69
7.5 Solenoidal Winding Transformer Model-1 and Model-2 Design Result ... 69
7.5.1 Comparison with respect to the number of cores ... 69
7.5.2 The number of turns vs. Leakage inductance and core loss ... 72
7.5.3 The number of turns vs. Magnetizing inductance ... 74
7.5.4 Bac Optimization ... 76
7.6 Solenoidal Winding Transformer Design -1 and Design -2 Design Result ... 80
7.6.1 Specification of Model-1 and Model-2 Design Result ... 80
7.7 Coaxial Winding Transformer Model-3 Design Result... 83
8 EXPERIMENT RESUTL ... 85
8.1 Specification of scale-down transformer ... 85
8.2 Actual Permeability Measurement ... 87
8.3 Magnetizing and leakage inductance of transformer with separate winding... 87
8.4 Magnetizing and leakage inductance of transformer with layered winding ... 90
9 CONCLUSION ... 94
LIST OF TABLES
Table 1 Specification of Gen-1 SST Transformer ...9
Table 2 Dimension of AMCC1000 Powerlite C-core... 17
Table 3 Dimension of Vitroperm... 18
Table 4 Specification of wires ... 20
Table 5 Magnetic flux density and core loss ... 25
Table 6 The value of X for copper wire is determined ... 27
Table 7 Constant depending on N... 27
Table 8 Fourier series quantities and ac resistance on high voltage side (1kHz) ... 28
Table 9 Fourier series quantities and ac resistance on low voltage side (1kHz) ... 28
Table 10 Conversion of standard units in magnetic... 32
Table 11 Comparison of magnetizing inductance between calculation and simulation result with AMCC250... 33
Table 12 Energy stored by parasitic capacitances ... 41
Table 13 Parasitic capacitances of Gen-1 SST transformer ... 41
Table 14 Magnetic flux density and core loss ... 43
Table 15 Inductance ... 49
Table 16 Insulation requirement ... 57
Table 17 Comparison between 2 pairs and 3 pairs application ... 71
Table 18 Loss comparison between 2 pairs and 3 pairs application... 71
Table 19 Comparison table... 80
Table 20 Loss comparison between 2 pairs and 3 pairs application... 80
Table 21 Specification of transformer... 85
Table 22 Dimension of AMCC250 Powerlite C-Cores ... 86
Table 23 Specification of winding ... 86
Table 24 SST prototype parameters... 92
Table 25 Comparison table... 100
LIST OF FIGURES
Figure 1 Topology of Gen-1 Solid State Transformer ...4
Figure 2 Topology of Gen-2 Solid State Transformer ...5
Figure 3 Status of the P*f(W*Hz) of power electronics converters based on different semiconductor materials (Wei Shen, “Design of High Density Transformers for High Frequency High power Converter”)...6
Figure 4 Schematic of single-phase dual active bridge (DAB) converter...6
Figure 5 DAB converter voltage and current waveforms ...7
Figure 6 B-H curve (Design-1 separate winding transformer)...8
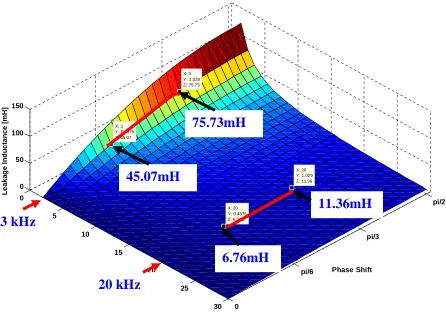
Figure 7 Required leakage inductance with respect to operating frequency and phase shift for DAB converter... 10
Figure 8 Core loss per kg in terms of frequency and flux density of Silicon Steel (Thickness 14 mil) ... 12
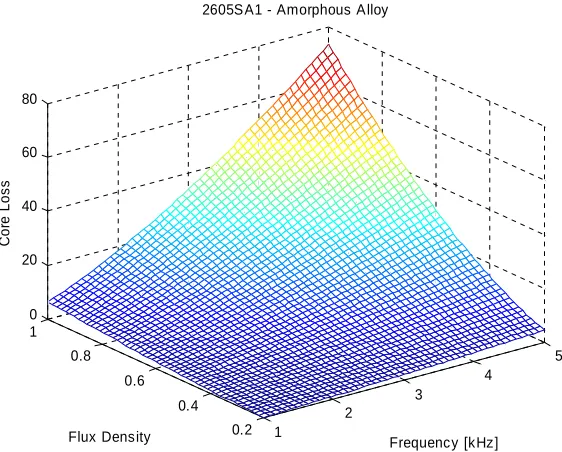
Figure 9 Core loss per kg in terms of frequency and flux density of 2605SA1 ... 14
Figure 10 Core loss per kg in terms of frequency and flux density of Vitroperm500 ... 15
Figure 11 Geometry of Metglas AMCC C-Core (left) and the BH curve (right)... 17
Figure 12 Geometry of Vitroperm 500 (left) and the BH curve (right) ... 18
Figure 13 Magnetic flux and current flow in solenoidal winding transformer ... 22
Figure 14 Magnetic flux and current in coaxial winding transformer ... 22
Figure 15 Equivalent circuit for the two winding solenoidal transformer ... 22
Figure 16 Equivalent circuit for coaxial winding transformer ... 23
Figure 17 Magnetic flux path of separate winding type (left) and layered winding type(right) ... 30
Figure 18 Conversion from circular wire to square wire ... 30
Figure 19 Simplified magnetic field distribution in window area ... 34
Figure 20 Magnetic field intensity distribution in separate winding with airgap 0.25mm ... 35
Figure 21 Magnetic field intensity distribution in layered winding with airgap 0.127mm .... 36
Figure 22 The circuit for deriving energy stored a coupled circuit ... 38
Figure 23 Equivalent circuit for Gen-1 SST transformer... 41
Figure 24 Two winding transformer equivalent circuit ... 41
Figure 25 Geometry of coaxial transformer and flux density distribution... 45
Figure 26 Magnetic flux density distribution of coaxial transformer in profile ... 45
Figure 27 Co-axial Transformer ... 46
Figure 28 Overview of magnetic flux density distribution of coaxial transformer ... 46
Figure 29 Geometry of parallel electrode... 54
Figure 30 Electrostatic field analysis of wire insulation ... 55
Figure 31 Proposed oil-free insulation strategies for design-1... 58
Figure 32 Electric field intensity on the surface in terms of thickness of insulation... 58
Figure 33 Electric field intensity on the surface in terms of the distance ... 59
Figure 35 Proposed oil-free insulation strategies for design-2... 60
Figure 36 Electric field intensity on the surface in terms of the thickness of insulation. ... 61
Figure 37 Electric field intensity on the surface in terms of the distance ... 61
Figure 38 Ex. 1 (top left), Ex. 2 (top right), Ex. 3 (bottom left)... 62
Figure 39 Electric field intensity distribution of Ex 1... 62
Figure 40 Electric field intensity distribution of Ex 2... 63
Figure 41 Electric field intensity distribution of Ex 3... 63
Figure 42 C-core outline showing the window area and cross section ... 65
Figure 43 Transformer voltage waveforms, illustrating the volt-seconds ... 66
Figure 44 Diagram illustrating the relationship between frequency, flux density and the number of turns ... 68
Figure 45 The number of turns vs. Leakage inductance and Core loss of the Design -1 ... 73
Figure 46 The number of turns vs. Leakage inductance and Core loss of the Design -2 ... 74
Figure 47 The number of turns and the thickness of airgap vs. Magnetizing inductance of the separate winding transformer ... 75
Figure 48 The number of turns and the thickness of airgap vs. Magnetizing inductance of the layered winding transformer... 76
Figure 49 Bac Optimization Curve ... 78
Figure 50 Total loss(red), core loss(blue), winding loss(green) – Bac 0.39(top left), Bac 0.21(top right), Bac0.14 (bottom) ... 79
Figure 51 Total power loss at the optimal Bac – Bac 0.39 (blue), Bac 0.21 (yellow), Bac 0.14 (green), Bac0.23(red)... 79
Figure 52 Complete overview of separate winding transformer Design -1 ... 81
Figure 53 Complete overview of layered winding transformer Design-2 ... 82
Figure 54 Complete overview of coaxial winding transformer Design -3... 84
Figure 55 Core geometry(left) and real model ... 86
Figure 56 Experiment result of permeability of 2605SA1 ... 88
Figure 57 Magnetic field intensity distribution of scale-down transformer with separate winding ... 89
Figure 58 Comparison of magnetizing and leakage inductance between experiment, simulation and calculation with separate winding ... 89
Figure 59 Comparison of coupling coefficient between experiment and simulation with separate winding ... 90
Figure 60 Magnetic field intensity distribution of scale-down transformer with layered winding ... 91
Figure 61 Comparison of magnetizing and leakage inductance between experiment, simulation and calculation with layered winding ... 91
Figure 62 Comparison of coupling coefficient between experiment and simulation with layered winding... 92
Figure 63 SST Prototype ... 93
Figure 64 Waveforms of DAB converter with scale-down transformer... 93
Figure 66 MAXWELL3D transient analysis with nonlinear B-H characteristics of
CHAPTER 1
1
INTRODUCTION
air because this high frequency transformer is designed as dry-type for environmental and safety issues. This thesis examines mainly efficiency of high frequency transformer depending on the operating condition, wire and core selection and electromagnetic analysis to have a required magnetizing and leakage inductance for the DAB dc-dc converter. The summary of the designs and comparison is in chapter 9 and this thesis is rounded off with the recommendations for future work.
CHAPTER 2
2
SOLID
STATE
TRANSFORMER
TOPOLOGIES
AND
REQUIREMENTS
FOR
HIGH
FREQEUNCY
TRANSFORMER
2.1
Solid State Transformer Topology and operating principle
The SST basically converts the voltage from AC to AC for step-up or step-down with the function same as the conventional transformer. However, the traditional 60 Hz transformer is replaced by a high frequency transformer which is the key to achieve size and weight reduction and the power quality improvement. The solid state transformer consists of three stages, AC/DC rectifiers, a soft-switching Dual Active Bridge converter with a high frequency transformer and a DC/AC inverter.
silicon IGBT respectively. The switching frequency of the high voltage silicon IGBT devices is 3 kHz, and the low voltage IGBT in the VSI switches at 10 kHz. The 20 kVA SST unit is envisioned as a building block of IEM and also for construction of a larger rated SST. The switching device for high voltage side is a newly packaged 6.5kV 25A H-bridge IGBT module as Fig.1 shows, While for the low voltage side, commercially available 600V/1200V IGBTs are used.
Figure 1 Topology of Gen-1 Solid State Transformer
10^9 W-Hz, so Gen-1 SST is almost at the edge of the silicon-based devices. Therefore, Gen-2 SST with one stage can be realized with development of new devices which has high voltage, high frequency and high temperature operation capability, such as possibly SiC devices. The Gen-2 SST must be support three times more power capability which comes with size increase, therefore, the increasing operating frequency is necessary to reduce the size which must come with more accurate and profound AC analysis, such as eddy current, for this application.
Figure 3 Status of the P*f(W*Hz) of power electronics converters based on different semiconductor materials (Wei Shen, “Design of High Density Transformers for High Frequency High power Converter”)
The dual active bridge (DAB) converter which is used for SST high frequency transformer has attractive characteristics for high power and high frequency applications, such as low device stress, no extra reactive component using the leakage inductance of transformer as the main energy transfer element. DAB converter consists of two active bridges connected though the transformer and the amount of power from one DC source to the other is determined by the phase shift between two active bridges Fig. 2.
Figure 4 Schematic of single-phase dual active bridge (DAB) converter
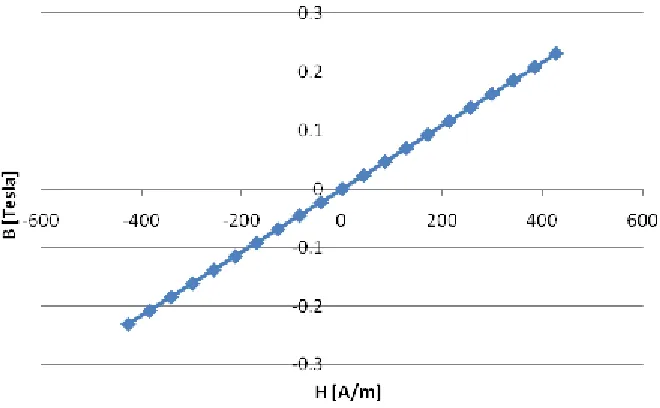
account in this curve. The parameters used for this graph is real values of Design-2 separate winding transformer which will be introduced later on.
( ) c
v t dt
B
n A
⋅ =
⋅
∫
(2.1.1)( )
n i t H
MPL
⋅
= (2.1.2)
0 1 2 3 4 5 6
x 10-4 -10
-5 0 5 10
0 1 2 3 4 5 6
x 10-4 -5000
0 5000
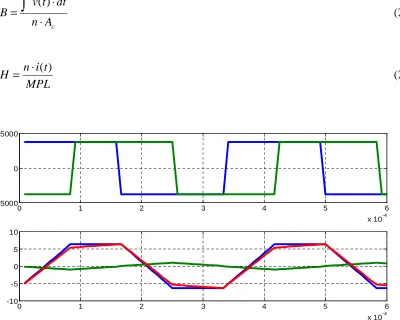
Figure 5 DAB converter voltage and current waveforms
(Top : Primary voltage(blue), Secondary voltage(Green), Bottom: Primary current(red), Magnetizing current(green), Leakage current(blue) )
Figure 6 B-H curve (Design-1 separate winding transformer)
The principle of the DAB converter is simple. Two active bridges are connected by high frequency transformer and the phase shift between two bridges determines the amount of power from one DC source to the other. This circuit works at the fixed frequency and square wave mode of operation. The waveform of primary and secondary voltage and current are illustrated in Fig.4. Assuming the input and output voltage are the same as required, the output power is ideally transferred with infinite magnetizing inductance by (2.1.3). V is input and output DC voltage, φ is the phase shift between input and output bridges.
) 1 ( 2
2
π φ φ
π ⋅ ⋅ ⋅ −
=
L f V
2.2
Required Leakage Inductance with respect to Operating
Frequency
Leakage inductance in dual active Bridge converter is a key element to determine the amount of energy transfer. The power transferred from primary to secondary can be represented by (2.2.1). The required leakage inductance with respect to switching frequency of dual active bridge converter is shown in fig 6. The required leakage inductance can be calculated by (2.2.1) in the range approximately from 45.1 to 75.7 mH at 3kHz and from 6.7 to 11.4 mH at 20kHz respectively. Additional external inductor might be required in case of lack of leakage inductance in transformer. This external inductor can lead another volume and structure, so it also needs to be taken care of well. How to deal with this leakage inductance and external inductor for optimization is the key point of the frequency high-voltage SST transformer.
) 1 ( 2
2
π φ φ
π ⋅ ⋅ ⋅ −
=
P f V L
(2.2.1)
High Voltage Side Low Voltage Side
DC-bus [V] 3800 400
Current at maximal load [A] 2.66 25.27
Power [W] 7kW
Turns ratio 9.5:1
Switching frequency [kHz] 3kHz, 20kHz
Phase Shift π/ 6 ~ π/ 4
0 5 10 15 20 25 30 0 pi/6 pi/3 pi/2 0 50 100 150 Phase Shift X: 20 Y: 1.029 Z: 11.36 X: 20 Y : 0.4875 Z: 6.761 X: 3
Y : 1.029 Z: 75.73
Frequency [kHz]
X: 3 Y : 0.4875 Z: 45.07 L eak a g e I n d u c ta n ce [ mH]
CHAPTER 3
3
CORE MATERIAL AND STRUCTURE SELECTION
3.1
Core Material Comparison
One of the basic steps in transformer design is the selection of proper core material. Selecting suitable core material for particular applications is important to design transformers. A material easily magnetized and demagnetized, referred to as ‘soft magnetic material’, is generally used for high frequency transformers. There are several typical materials of soft magnetic which can be considered for the high frequency transformer in solid state transformer based on the specification proposed. Even though ferrite cores are most popularly used for high frequency applications, the ferrite material has very low saturation flux density around 0.3-0.5 T which makes the transformer bulky especially for high voltage applications, hence ferrite core is left out as core material in this paper. The main factor to select the core material is core losses for different frequencies over flux density change.
3.1.1
Silicon Steel
be further decreased due to excessive eddy current loss. Some manufactures provide silicon steel laminations with gauge down to 1mil, which are suited for high frequency applications. However, compared with nanocrystalline and amorphous core materials, its specific loss is still very high.
0
0.2
0.4 0.6
0.8 1
0.2 0.4 0.6 0.8 1 0 20 40 60 80
Frequency [kHz] Silicon Steel
Flux Density
C
o
re
Lo
ss
3.1.2
Amorphous Alloy
1
2
3
4
5
0.2 0.4 0.6 0.8 1 0 20 40 60 80
Frequency [kHz] 2605SA1 - Amorphous Alloy
Flux Density
C
o
re Lo
ss
Figure 9 Core loss per kg in terms of frequency and flux density of 2605SA1
3.1.3
Nanocrystalline
shape for nanocrystalline cores is toroidal uncut tape-wound cores. The leakage inductance is small due to the toroidal geometry and low number of turns possible. The preliminary design based nanocrystalline core indicates extremely high core cost for SST transformer. On the other hand, insulation issue is difficult for toroidal cores. Also the largest geometry of commercially available nanocrystalline cores does not provide sufficient window area for 3kHz operating frequency. Despite the high cost, high quality performance of nanocrystalline is necessarily required for 20kHz operating frequency Fig.10.
15 16
17 18
19 20
0.2 0.4 0.6 0.8 1 0 20 40 60 80
Frequency [kHz] Vitroperm500 - Nanocrystaline
Flux Density
Co
re
L
o
ss
Figure 10 Core loss per kg in terms of frequency and flux density of Vitroperm500
The power handling capability of a core is related to the product of winding area (Wa) and cross-sectional area (Ac), which is called area product (). Even though additional care is required for high voltage application, it is enough to help us to initially choose magnetic cores for given specification of design. Another main concern of designing transformer at 3kHz is possibly eliminating external inductors to make up the lack of leakage inductance in transformer. External inductances are going to be almost a half as big as transformer at 3kHz, so it makes the system bulky and complex and also require another structure. In case of operating frequency 3kHz, it is very likely to eliminate the external inductors with only leakage inductance in transformer, so we will investigate step by step in Chapter 3 and 4 to figure out the best fit for Gen-1 SST high frequency transformer without external inductors.
Supposed that Jmax =200A/cm2, Ku =0.1, Kf =4.0(squarewave) are given for Gen-1 SST high frequency transformer, the required minimum area product is approximately
4
1900cm , (3.2.1). As expected to be seen in chapter 4, the bigger the ratio of ‘c’ and ‘b’, the larger leakage inductance the transformer has. Considering the insulation requirement under high voltage and the larger leakage inductance to eliminate or reduce external inductors at the switching frequency 3khz, 2 or 3 pairs of AMCC1000 cores (Ap of a pair of AMCC1000=966cm2) are chosen to be used with margin, Table 2.
u f ac
out in p
K K J f B
P P A
⋅ ⋅ ⋅ ⋅
⋅ +
Core Dimension [mm] Performance parameters
A b c d e f Lm[cm] Ac[cm^2] Wa[cm^2] Ap[cm^4] Mass[g]
33.0 40.0 105.0 85.0 106.0 171.0 42.7 23.0 42.0 966.0 7109
Table 2 Dimension of AMCC1000 Powerlite C-core
Figure 11 Geometry of Metglas AMCC C-Core (left) and the BH curve (right)
3.3
Core Selection for Operating Frequency of 20kHz
Nonetheless, there are also many advantages of the coaxial winding transformer. Most importantly, the most parameters, such as inductance, capacitance and power loss, are easily and fairly accurately predicted by calculation. In the dual active bridge application, these parameters play a significant roles, so this very desirable feature of coaxial winding transformer. The same parameters (Jmax =200A/cm2, Ku =0.2, Kf =4.0(square wave),
77 . 0
=
ac
B ) are used for 10kHz application. 12 of Vitroperm T64004-W908 are used.
Core dimension Dout*dn*h [mm]
Cross sectional area [em^2]
Mean path length
[cm] Part number
80*63*20 1.24 22.5 4-L2080-W722
Table 3 Dimension of Vitroperm
3.4
Wire Selection
The required cross-sectional area of the winding on high voltage side is 0.0110cm2
(diameter : 0.1183cm) and the cross-sectional area of the winding on low voltage side is
2
105 .
0 cm (diameter : 0.3656cm) to have the current density of 200A/cm2. The skin depth at the frequency of 3kHz is 0.1378cm, (3.4.1). The recommended strands wire gauge at frequency of 1kHz~10kHz is around 30AWG and the insulation to support 3.8kV AC is required, so the PFA: high voltage wire AWG17 (35/32) and 350/32 Litz wired from New England Wire are chosen for high-voltage and low-voltage side respectively. Table 4 shows the specification of the windings.
) ( ) ( 100 @ 1 um kHz f K C depth
skin ° ε =
C
K1 =2385@100° (3.4.1)
Current density 2
/ 200A cm
Required copper area 2
0110 .
0 cm (dia 0.1183cm)
Wire Gauge 35/32
Diameter of Single strands 0.0202cm
Insulation PFA insulation (0.0135”=0.0343cm)
External Diameter and
cross-sectional area without wrapping 0.06”=0.1524cm,
2
0182 .
0 cm
Finished wire diameter 0.087”= 0.221cm
High Voltage Side
DC resistance 173.8uΩ/cm (20 C)
Current density 2
/ 200A cm
Required copper area 2
105 .
0 cm (dia 0.3656cm)
Wire Gauge 350/32
Diameter of Single strands 0.0202cm
Insulation PFA insulation (0.02”=0.0508cm)
External Diameter and
cross-sectional area without wrapping 0.203”=0.515cm,
2
208 .
0 cm
Finished diameter 0.243”=0.617cm
Low Voltage Side
Table 4 Specification of wires
3.5
Comparison and Selection of Transformer Structure
There have been a lot of researches conducted about different structures and winding methods for power electronics converters to maximize the operating frequency with low power losses and temperature rise. By and large, there are two dual structures, solenoidal and coaxial winding transformers. We are going to investigate the magnetoelectric characteristics of each structure and see what are the pros and cons at different operating frequencies under high voltage and low current condition.
3.5.1
Duality of Solenoidal and Coaxial Winding Transformers
The solenoidal winding structure and coaxial winding structure are the duals of one another. In case of the solenoidal winding structure, the magnetic flux flows parallel to the cylindrical axis and the current encircles the cylindrical axis. On the contrary, the flux encircles the cylindrical axis and the current flows parallel to the cylindrical axis by right hand rule in the case of coaxial winding structure.
voltage in the other coil of wire on the magnetic core by Faraday’s law. The equivalent circuit is represented below in Fig. 15. Leakage flux density is on the both side and divided almost equally. Even though the method to calculate the leakage inductance of conventional transformer has been studied for long time, there are numerous factors to affect the leakage inductance, such as geometry and the way of winding. It is predicted by simplification but it is complicated and has a possibility of error.
Figure 13 Magnetic flux and current flow in solenoidal winding transformer
Figure 14 Magnetic flux and current in coaxial winding transformer
Primary
winding
LmSecondary
winding
Lleak_p
Ni No
Rout
Rin Lleak_s
Figure 16 Equivalent circuit for coaxial winding transformer
CHAPTER 4
4
LOSS
AND
ELECTROMAGNETIC
ANAYSIS
OF
SOLENOIDAL WINDING TRANSFORMER DESIGN
4.1
Core Loss
Core loss is one of the most important ac properties of transformers. Some of energy is not recoverable due to the magnetization of core material and transfers to heat. It is observed as hysteresis of the B-H loop. The ac flux in the core induces current proportionally with the excitation frequency, so the core loss increases as the square of the excitation frequency assumed the core material is pure resistive. Amorphous alloy 2605SA1 has its own empirical equation provided by the datasheet in terms of frequency and the flux swing (4.1.1). If we select 0.23 of the optimal Bac value, the core loss per kilogram is 2.647 W/kg and the total of 3 pairs of AMCC1000 is 56.455W.
) ( ) (
) 1000 / (
/kg k f m Bacn
Watt = ⋅ ⋅ 2605SA1: k =6.5, m=1.51,n=1.74 (4.1.1)
Switching frequency [kHz] 3kHz
Bac [T] 0.23
Mass of a pair of AMCC1000 [kg] 7.109
Total mass [kg] 21.327
Core loss per kilogram [W/kg] 2.647
Total core loss [W] 56.455
4.2
Winding Loss
DC winding loss can be easily calculated regardless of the frequency, but AC winding loss in Litz wire is not easily estimated because it is affected by many factors. Various formulas have been derived to achieve accurate AC winding losses in Litz wire. In this paper, we use the application note from ‘New England Wire Technology’.
The skin depth at the frequency of 3kHz is 0.1378cm (4.2.1). Recommended wire gauge which can properly eliminate the skin effect at the frequency of 1~10kHz is approximately 30AWG. 32AWG is chosen as wire gauge for strands considering the case of increasing the switching frequency. The ratios of alternating-current resistance to direct-current resistance for an isolated solid round wire (H) in terms of a value (X) are shown in Table 6 and 7.
) ( ) ( 1 um kHz f K depth
skin ε = (K1 =2386, 100°C) (4.2.1)
MHz
M F
D
X =0.271⋅ ⋅ , Eddy current basis factor )4 44 . 10
(D f
G= i⋅ (4.2.2)
G D D N K H R R o i dc ac ⋅ ⋅ ⋅ + = 2 (4.2.3)
F=operating frequency, N=The number of strands in the cable
i
D=Diameter of the individual strands over the copper in inches
G : Eddy current basis factor F : Operating frequency
N : # of strands in the cable Di : Diameter of individual strands
Do : Diameter of the finished cable K : constant ( 2 when N>27 )
X 0 0.5 0.6 0.7 0.8
H 1.0000 1.0003 1.0007 1.0012 1.0021
Table 6 The value of X for copper wire is determined
N 3 9 27 infinity
K 1.55 1.84 1.92 2
Table 7 Constant depending on N
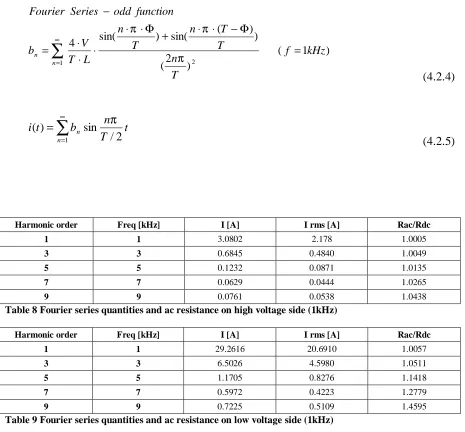
) 1 ( ) 2 ( ) ) ( sin( ) sin( 4 1 2 kHz f T n T T n T n L T V b function odd Series Fourier n n = Φ − ⋅ ⋅ + Φ ⋅ ⋅ ⋅ ⋅ ⋅ = −
∑
∞ = π π π (4.2.4)∑
∞ = =1 /2
sin ) ( n n t T n b t i π (4.2.5)
Harmonic order Freq [kHz] I [A] I rms [A] Rac/Rdc
1 1 3.0802 2.178 1.0005
3 3 0.6845 0.4840 1.0049
5 5 0.1232 0.0871 1.0135
7 7 0.0629 0.0444 1.0265
9 9 0.0761 0.0538 1.0438
Table 8 Fourier series quantities and ac resistance on high voltage side (1kHz)
Harmonic order Freq [kHz] I [A] I rms [A] Rac/Rdc
1 1 29.2616 20.6910 1.0057
3 3 6.5026 4.5980 1.0511
5 5 1.1705 0.8276 1.1418
7 7 0.5972 0.4223 1.2779
9 9 0.7225 0.5109 1.4595
Table 9 Fourier series quantities and ac resistance on low voltage side (1kHz)
4.3
Inductance Analysis
using dual active bridge converter are the magnetizing and leakage inductance. Typically, the low leakage inductance, the better it is for a normal transformer application because high leakage inductance and winding capacitance may cause an undesirable output signal such as phase shift, timing error, noise and overshoot. On the other hand, the leakage inductance in transformer is used as the main energy transfer element in DAB converter. Therefore, the leakage inductance value is not just expected to be small in this case but carefully decided in advance and adjusted by demand for required performance of transformer.
4.3.1
Magnetic Field Distributions in Core
We are going to analyze two different types of winding, separate and layered winding. Generally, layered winding is preferable because it has lower leakage inductance than the separate winding does. Nonetheless, we have to see which one will be best fit for DAB converter under the condition quite large leakage inductance is required to transfer energy as one of the main element. As stated beforehand, the external inductor leads structural complex and bulky size. We can possibly have additional benefit from the large leakage inductance in separate winding by carefully designing and utilizing the leakage inductance.
permeability, so we can assume total MMF is in window area. The geometry of winding can be simplified by converting the round wire to the square wire. The thickness of the square wire is derived by make the same effective copper area of square wire to round wire (4.3.1.1).
Figure 17 Magnetic flux path of separate winding type (left) and layered winding type(right)
Figure 18 Conversion from circular wire to square wire
2 ,
4
2
2 π
π
D a a D
=
4.3.2
Magnetizing Inductance Analysis
When two inductors (coils) are closely located closely, the magnetic flux caused by current in one coil links with the other coil. This phenomenon is called ‘mutual inductance’. The inductance relates the voltage induced in the same coil is called ‘self inductance’. The magnetizing inductance can be represented by the mutual inductance times square of the number of turns. The magnetomotive force MMF between two points x1 and x2 is represented by (4.3.2.1). dlis a vector length pointing in direction of the path. Assuming there is an uniform strength of the magnetic field, the magnetizing force can be simplified
m
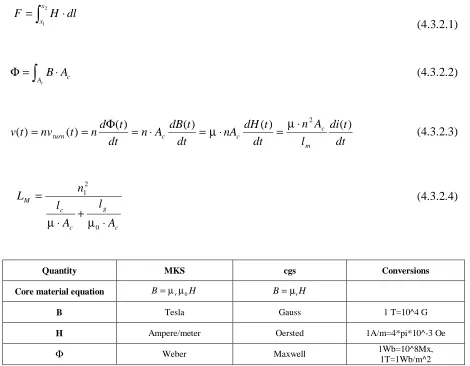
F = ⋅ = ⋅H l n i by Ampere’s law. The total magnetic flux Φ through a surface S having area Ac is represented by (4.3.2.2) and it can be simplified assuming flux density is normal to the surface Φ = ⋅B Ac . The winding current works as sources of MMF and the average flux flows inside the core. The length of the closed path where the flux flow is called mean magnetic path length lm. Since assuming that the magnetic field strength is uniform, the induced voltage caused by the flux is given by (4.3.2.3) according to Faraday’s law, and the inductance considering airgap can be obtained (4.3.2.4) by magnetic circuit method. The core material permeabilityµis expressed as the product of the relative permeability µr and
0
µ . Even thought the air gap decreases the inductance, we can adjust the inductance value
∫
⋅ = 21 x x H dl
F
(4.3.2.1)
c
c A B A
Φ =
∫
⋅ (4.3.2.2)dt t di l A n dt t dH nA dt t dB A n dt t d n t nv t v m c c c turn ) ( ) ( ) ( ) ( ) ( ) ( 2 ⋅ = ⋅ = ⋅ = Φ =
= µ µ (4.3.2.3)
c g c c M A l A l n L ⋅ + ⋅ = 0 2 1 µ µ (4.3.2.4)
Quantity MKS cgs Conversions
Core material equation B=µrµ0H B=µrH
B Tesla Gauss 1 T=10^4 G
H Ampere/meter Oersted 1A/m=4*pi*10^-3 Oe
Φ Weber Maxwell 1Wb=10^8Mx,
1T=1Wb/m^2
Table 10 Conversion of standard units in magnetic
Airgap
Thickness{mm} 0.055 0.127 0.191 0.267 0.33 0.406 0.508 0.559 0.635 0.72 Calcualation
[mH] 23.438 16.893 13.533 10.948 9.451 8.113 6.818 6.314 5.687 5.119 Simulation
Separate winding[mH]
22.563 16.878 13.986 11.975 10.334 9.088 7.838 7.114 6.807 6.027
Simulation Layered winding[mH]
22.408 16.851 13.933 11.628 10.291 9.079 7.887 7.422 6.840 6.307
Table 11 Comparison of magnetizing inductance between calculation and simulation result with AMCC250
4.3.3
Leakage Inductance Analysis with Separate Winding
There is a leaking flux which does not magnetically couple between in magnetically coupled circuit. This leaking flux alternately store and discharge magnetic energy so works as an inductor in series in the circuit. This can cause the voltage drop across the reactance, hence it result in poorer supply regulation in typical applications. The leakage inductance plays an important role in DAB converter because it is one of elements to control amount of power.
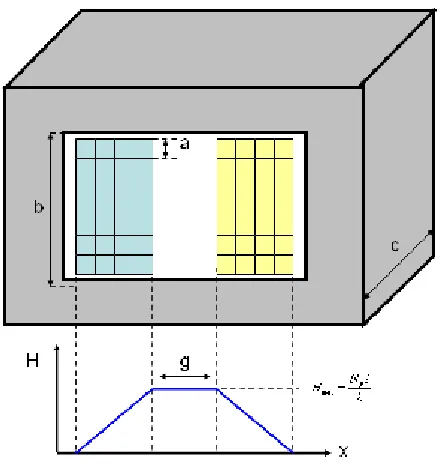
Assumption
1. Square section conductor has the same section of circular ones 2. Leakage flux in core is ignored.
Figure 19 Simplified magnetic field distribution in window area
The stored energy in magnetic field is obtained by (4.3.3.1) and the maximum magnetic field density and the magnetic field intensity in winding with DC current I are represented by (4.3.3.2). Therefore, inductance in a certain volume with the maximum constant magnetic field intensity is represented (4.3.3.4) and the winding is represented by (4.3.3.5). In the case of solenoidal separate winding transformer ,
Leakage inductance of C-C core transformer can be represented by
V H V
d H LI
W
V
2 0 2
0 2
2 1 2
1 2
1
µ
µ =
=
b I N
Hmax = p (4.3.3.2)
x m b a I N x H p ⋅ ⋅ = )
( (4.3.3.3)
2 2 0 b V N
L= µ ⋅ p ⋅
c g b
V = ⋅ ⋅ (4.3.3.4)
→ ⋅ ⋅ ⋅ ⋅ ⋅
=
∫
ma pdx m b a I N c b LI 0 2 0 2 ) ( 2 1 2 1 µ b a m N c
L t p
3
2
0 ⋅ ⋅ ⋅ ⋅
= µ
(4.3.3.5)
4.3.4
Leakage Inductance Analyses with Layered Winding
In case of layered winding, most energy is stored between the windings, hence, the calculation becomes more obvious and simple. Assuming there is no energy outside windings, the leakage inductance in layered winding is represented (4.3.4.1)
b a m N l b
l g N
L p t t p
3 4
2
2 0
2
0 ⋅ ⋅ ⋅ ⋅
⋅ + ⋅ ⋅ ⋅ ⋅
= µ µ (4.3.4.1)
4.4
Energy Base Magnetizing and leakage inductance Calculation by
Simulation
4.4.1
Energy in a Coupled Circuit
We can analyze the magnetic characteristics with software such as Maxwell 3D with finite element method (FEM) based on the stored energies under different excitations. The stored energy in an inductor is given by (5.4.1.1). The stored energy in magnetically coupled coils can be determined by following method.
The magnetically coupled circuit with coils can be represented by Fig.22. The energy stored in the coils is zero with i1 and i2 are zero initially. The power is represented by (5.4.1.2), hence total energy stored in the circuit is (5.4.1.3) if i1 is increased from zero to I1.
The mutual voltage induced in coil 2 is
dt di
M12 2 if i2 is increased from zero to I2 with
2
2 1
LI
w= (5.4.1.1)
dt di L i vi
p= = ⋅ (5.4.1.2)
1 1 0 1 1 1 1 1 1 2 1 I L di i L dt p w I ⋅ = =
=
∫
∫
(5.4.1.3)dt di L i dt di M I v i dt di M i
p 2 2 2
2 12 1 2 2 2 12 1
2 = + = + (5.4.1.4)
2 2 2 0 0 2 1 12 2 2 2 2 1 12 2 2 2 2 2 1 I L I I M di i L di I M dt p w I I ⋅ + = + =
=
∫
∫
∫
(5.4.1.5)2 1 12 2 2 2 2 1 1 2 1 2 1 2 1 I I M I L I L w w
wtotal = + = ⋅ + ⋅ + (5.4.1.6)
2 1 12 L L M
k = (5.4.1.7)
4.4.2
Procedure to Calculate the Inductance based on Simulation
Data
1. Calculate the self inductances by increasing i1 from zero to I1 while i2 =0.
2 1 1 0 1 1 0 1 1 1 1 1 1 2 1 I L di i L dt dt di L i w I i I
∫
∫
= == → L1 (5.4.2.1)
2 2 2 0 2 2 2 0 2 2 2 2 2 2 2 1 I L di i L dt dt di L i w I I
∫
∫
= == → L2 (5.4.2.2)
2. Calculate the stored energy by increasing i2 from zero to I2 and maintainingi1 =I1.
2 2 2 2 1 12 0 0 2 2 2 2 12 1 3 2 1 2 2 I L I I M dt dt di L i dt dt di M I w I I + = +
=
∫
∫
(5.4.2.3)2 1 1 2 2 2 2 1 12 2 1 2 1 I L I L I I M
wtotal = + + → M12 (5.4.2.4)
The mutual voltage induced in coil 2 is zero since i1 does not change.
3. Calculate the leakage and magnetizing inductance with coupling coefficient.
2 1 12 L L M
4.5
Winding capacitance calculation
Stray capacitance was calculated from the simplified model by the assumption above. Each capacitance between adjacent materials is calculated by set up one volt and ground others except the calculation to have capacitances in windings. The voltage difference between turns, winding layers and windings and cores cause these parasitic capacitances. These capacitances can produce large primary current spikes with square wave and electrostatic coupling to other circuit too. Therefore, they cannot be simply ignored in high frequency application, so that predicting and measuring correcting values is very important work especially in high frequency transformer design. The equivalent circuit of transformer is represented by sum of reflected capacitances to appear at the terminals of one winding. It is almost not possible to calculate exact winding capacitance and cannot be simply expressed with simple formula so that capacitances were obtained by MAXWELL 2D electrostatic simulation and compared with the experimental results.
Assumption
Air Gap (mm) Vp=1 , Vcp=-0.5 (Others are grounded) Vs=1 , Vsp=-0.5 (Others are grounded) Vcp=1 (Others are grounded) Vcs=1 (Others are grounded) Core_right=1 ,Vsp=1 (Others are grounded) 2
Total energy [J] 1.2134e-10 1.1906e-10 5.7560e-10 4.4127e-10 2.9102e-10 1
Total energy [J] 1.2134e-10 1.1906e-10 5.7350e-10 4.4110e-10 5.1506e-10 0.5
Total energy [J] 1.2134e-10 1.1906e-10 5.7069e-10 4.4122e-10 9.5373e-10
Table 12 Energy stored by parasitic capacitances
Air Gap Thickness (mm) Ca (pF) [error (%)] Cb (pF) [error (%)] Cc (pF) [error (%)] Cd (pF) [error (%)] Ce (pF) [error (%)]
2 74.8 354.5 98.94 271.7 73.3
1 74.8 353.3 175.1 271.7 73.3
0.5 74.8 351.4 324.4 271.7 73.3
Table 13 Parasitic capacitances of Gen-1 SST transformer
Figure 23 Equivalent circuit for Gen-1 SST transformer
CHAPTER 5
5
LOSS AND ELECTROMAGNETIC ANAYSIS OF COAXIAL
WINDING TRANSFORMER DESIGN
The key advantage of coaxial winding transformer is that the inductances and capacitances are predictable with high accuracy because the electromagnetic analysis is relatively simple and can be theoretically calculated simply by hand calculation. Especially, the leakage inductance of transformer is one of the key factors of control strategy in DAB application so that predicting accurate parameters can be a significant advantage for SST high frequency transformer. As we mentioned in core selection section, the coaxial winding transformer has a benefit in size even though it has restraint due to the number of turns. Moreover, the size of external inductors can be reduced because of high operating frequency, so eventually we have a benefit in size as well. We assumed that dc current which might cause the transformer core saturation does not exist in the following calculation. Core loss is one of the most important ac properties of transformers.
5.1
Power Loss
flux density. Even though low flux density is desirable to reduce core loss, high flux density is required to reduce the number of turns due to the difficulty of physical implementation. When, the core loss per kilogram is 45.05 W/kg and the total mass of 12 toroidal cores of Vitroperm500 is 1.025kg. Therefore, the total core loss is 46.17W.
The copper area of the 0.5mm thickness of cylindrical is approximately 0.493cm2
Assuming there is no skin and proximity effect, the winding DC loss is
) ( ) (
/kg k f m Bac n
Watt = ⋅ ⋅ Vitroperm500: k =0.864e−6,m=1.834,n=2.112 (5.1.1.)
Switching frequency [kHz] 20kHz
Bac [T] 0.83
Mass of a pair of AMCC1000 [kg] 0.0854
Total mass [kg] 1.025
Core loss per kilogram [W/kg] 45.05
Core loss [W] 46.17
Winding loss [W] 15.67
Total loss [W] 61.84
Table 14 Magnetic flux density and core loss
5.2
Inductance Analysis in Coaxial Winding Transformer
5.2.1
Magnetic field distribution in cylindrical structure
Assumption
1. The flux density of the core is constant 2. Permeability of core is constant
3. All mutual flux is contained within the transformer core 4. Magnetizing current distribution is cylindrically symmetry.
5. All leakage flux is contained between outer winding and inner winding.
Based on the given assumption above for simplicity, the magnetic flux in each section shown in Fig.30 can be calculated by integration of the flux density in given cross sectional area in terms of the radius. The magnetic flux density in the concentric tubular winding inside window area of toroidal cores is also proved by Maxwell 3D magnetic analysis in Fig.26. The simplified overview of the coaxial winding transformer is shown in Fig.27.
2 o rNIm
B
r µ µ
π
= (5.2.1.1)
2
2 0 0
1 0 0 ( 2)
2 8 to turn r l turn in NI NI
dh dr l
r r
µ µ
πρ
π π π
Φ =
∫ ∫
= 0<r<rin (5.2.1.2)0 0
2
0 2 2 ln( )
ti turn in r l ti turn r in
NI NI r
dr l
r r
µ µ
π π
Φ =
∫ ∫
=2
2 2
4 2 2 2 4 4
0 0
3 0 2 2 2 2
( ) 1
ln( ) ( ) ( )
( ) 2 2 ( ) 4
to turn
ti
r l
to to
to to to ti to ti turn
r
to ti to ti ti
r NI NI r
dr r r r r r r l
r r r r r r
π ρ µ µ π π π − Φ = = − − + − − −
∫ ∫
to ti r rr < <
(5.2.1.4)
4
0 2 2 ln( )
co core
ci
r l
o r m core o r m co
r
ci
NI l NI r
dh dr
r r r
µ µ µ µ
π π
Φ =
∫ ∫
= rci < <r rco (5.2.1.5)Figure 25 Geometry of coaxial transformer and flux density distribution
Figure 27 Co-axial Transformer
5.2.2
Magnetizing Inductance Analysis
Assuming all mutual flux is constrained within the transformer cores for simplicity, the total flux linkage is represented by the number of turns times the mutual flux (5.2.2.1). As shown in chapter 5.2.1, the flux in the cores are derived by integrating the flux density on the cross sectional area (5.2.2.2). Inductance is a property to induce electromotive force by the rate of change of the current (5.2.2.4), hence, the magnetizing inductance of coaxial winding transformer is derived (5.2.2.5).
Φ ⋅ =
Λ N (5.2.2.1)
0 2 2 ln( )
co core
ci
r l
o r m core o r m co
r
ci
NI l NI r
dh dr
r r r
µ µ µ µ
π π
Φ =
∫ ∫
= (5.2.2.2)( ) ( )
( ) turn( )
d t d t
v t N v t N
dt dt
Φ Λ
= ⋅ = ⋅ = (5.2.2.3)
2
( ) ( )
ln( ) ln( )
2 2
core o r co core o r co
ci ci
l N i t r l N r
d di t
N
dt r r r r dt
µ µ µ µ
π π
⋅
⋅ =
(5.2.2.4)
) ln( 2 2 ci co r o core m r r l N
L = ⋅
π µ µ
5.3
Leakage Inductance Analysis
The exact leakage inductance can be achieved by analysis by three dimensional point of view because the leakage flux at the ends of the transformer is not be able to be solved in two dimension, nonetheless, the result from the leakage inductance of unit length of the coaxial transformer in two dimension is considerably reliable if the coaxial transformer is long enough. It is reasonable to use the method in two dimensions for SST coaxial transformer because the SST transformer which we designed is fairly long and the ends have a minor effect on the total leakage flux. Therefore, we are going to assume that entire transformer is a perfect coaxial structure without the ends and the entire leakage flux is constrained within the coaxial structure of the length of the actual turns.
0 1 8 turn NI l µ π
Φ = , 0
2 ln( )
2 ti turn in NI r l r µ π
Φ = , 3 4ln( ) 2( 2 2) 1( 4 4) 4
to
to to to ti to ti turn
ti
r
r r r r r r l
r
Φ = − − + −
(5.3.1)
1 2 3
( ) leak N L I Φ + Φ + Φ
= (5.3.2)
The leakage reactance is predictable with minor errors thanks to the simple cylindrical geometry. It is very attractive advantage for DAB converter application which uses the leakage inductance as one of the terms to determine the amount of power to transfer from the control point of view rather than just minimizing it.
Self inductance on HV side [mH] Self inductance on LV side [mH] Mutual inductance [mH] (referred to high voltage
side)
Magnetizing inductance [mH] (referred to high voltage
side)
Leakage inductance [uH] (referred to high voltage
side)
Coupling coefficient
Calculation 331.481 3.6688 0.2293 331.11 328.07 0.9999
simulation 317.738 3.5139 0.2197 317.2035 534.50 0.9994
CHAPTER 6
6
HIGH VOLTAGE INSULATION
The diverse conditions under high voltage require careful design based on electric field analysis. The insulation materials used for high voltage condition can be gases, vacuum, solid, and liquid or a combination of these. The successful operation of high-voltage power system can be achieved by the correct choice of insulating material and maintaining them in good condition. The major references of insulating materials are permittivity, resistivity, dielectric dissipation factor and partial discharge characteristics. The moisture in the air also plays an important role. The insulation level has to be adjusted by humidity values when testing in high-voltage condition. Oil which is typically used as an insulant can reduce partial discharge and breakdown stresses. The structures of power system equipment must withstand the expected thermal, mechanical and electric stresses between conductors at different potentials. Polypropylene film has high electric strength and low losses so it is used a lot as dielectric in power electronics.
1. Insulation material should be homogeneous. The electric field keeps the same so that the electric field strength gradient is as constant as possible.
6.1
Electric Breakdown and Partial Discharge
There are two major concerns in terms of ‘high voltage’, the possibility of causing a spark in the air and the danger of electric shock by contact or proximity. It needs to be taken care of between two conductors or conductor and ground under high voltage. Even though there is no exact criteria, generally high voltage circuit is defined as those with more than 1000V AC and 1500V DC.
Electrical breakdown is a rapid reduction in the resistance of the insulator that can cause a spark jumping around or though the insulator and partial discharge is localized electrical dielectric breakdown of a small portion of a solid or liquid insulation system between conductors. Air is normally a good insulator but it can begin to break down under stress by a high voltage in electric field strength of more than3 10⋅ 6V m/ . The breakdown of the air leads spark or ark that bridges the gap between conductors. The partial discharge occurs when the local electric field intensity exceeds the dielectric strength of the fluid surrounding conductor. The pulse discharge occurs in short time, less than 1us. The intensity is represented by the charge level in picocoulombs or nanocoulombs. The insulation breakdown occurs at the breakdown voltage and results in a short circuit.
higher gradient. Corona discharge can cause power loss, audible noise and most importantly insulation damage which can lead equipment failure.
6.2
Electric Stress Distribution in Multiple Dielectric Insulation
System
Even thought the geometry of transformer is complicated and not easily simulated by FEM(Finite Element Method) simulation due to the burden of storage and memory, the design and selection of insulation can be estimated by prior knowledge choosing highest electric stress and simplifying the complicated geometry. Electric stress in parallel and concentric configuration is analyzed by calculation and simulation is conducted with MAXWELL 2D electrostatic field analysis to gain an insight into electric field distribution to choose insulation materials and determine the clearance distance. Edge effect is not easily analyzed by calculation so it is taken care of by MAXWELL 3D electric field simulation for the selective highest electric stress areas of the transformer.
The electric field intensity is the force per unit charge when placed E in the electric field(6.2.1). The electric field intensity is dependent on the medium in which the charge is placed so the electric flux density D is also used (6.2.2).
qE
E
D=ε (6.2.2)
The work done on a charge when moved in an electric field is defined as the potential. The electric stress is subjected to the numerically voltage gradient (Electric field intensity). The dielectric strength of an insulation material can be defined as the maximum dielectric strength which the material can withstand. The electric breakdown of insulating materials depends on a variety of parameters, such as field configurations, humidity and surface condition etc.
∫
⋅− = =
lE dl
q W
V (6.2.3)
V E =−∇ (
z a y a x
ax y z
∂ ∂ + ∂ ∂ + ∂ ∂ =
∇ ) (6.2.4)
The field distribution is determined by the Poisson’s equation. V is the potential at the given point and ρ is the charge density in the region, but typically the space charges are not present in case of high voltage apparatus so Laplace’s equation can apply for insulation tests.
0 2 ε ρ − =
∇ V (6.2.5)
2
0
V
6.2.1
Parallel electrode
The electric stress can be inspected by simple parallel electrode structure in the condition where insulation material is between parallel electrodes by neglecting edge effects. The electric field intensity can be calculated by Poisson’s equation. This calculation is an indication of how much distance is required to withstand the potential difference.
< + = > + = a x B x A V a x B x A V 2 2 2 1 1 1 (6.2.1.1)
1( ) 0, 1( ) 2( )
V x=d = V x=a =V x =a V2(x=0)=V0 D1n −D2n =ρa,x=a =0 (6.2.2.2)
x o a a d a V E 2 1 1 ) ( ε ε − − −
= x
o a a d a V E − − − = ) ( 2 1 2 ε
ε (6.2.2.3)
6.2.2
Concentric electrode
The procedure to achieve electric field intensity is basically the same as we did with parallel electrode. Sinceρv =0 in this case, Laplace’s equation is applied. Radius of the wire on the high voltage side (17AWG 35/32, New England Wire co.) is 0.762mm and the PFA insulation is 0.343mm and the dielectric constant of PFA is 2.03. The electric field intensity of the concentric electrode is derived by Laplace’s equation and boundary condition (6.2.2.3).
< < + = > < + = c x b B A V b x a B A V 2 2 2 1 1 1 ln ln ρ ρ (6.2.2.1)
Figure 30 Electrostatic field analysis of wire insulation
1 1
2 2
/ /
E A a b
E A a b
ρ ρ
ρ ρ
= − < <
= − < <
(6.2.2.2)
) ( ) ( , 0 ) ( , ) 0
( 2 1 2
1 V V c V b V b
c b a b V A ln ln 2 1 1 ε ε − − = , c b a b V A ln ln 1 2 2 − − = ε
ε (6.2.2.4)
b c b a b V b E 1 ln ln ) ( 1 2 2 ⋅ − − = = ε ε ρ (6.2.2.5)
6.3
Insulation Strategy
The SST high frequency and high voltage transformer is designed as oil-free type. There are two possible methods considered for Metglas AMCC1000 at frequency of 3 kHz to meet the insulation requirement.
Frequency HV DC link LV DC link Power Rating Turns Ratio Isolation requirement
Allowed temp. rise 1~3kHz 3800V 400V 20/3=7kVA 3800/400=9.5 15kV 40
Table 16 Insulation requirement
Figure 31 Proposed oil-free insulation strategies for design-1
As shown in Fig 32, the electric field intensity on the surface of insulation is around 2MV/m, so there is around 50% margin at the distance of 4mm between concentric electrodes. The electric field intensity on the surface reaches to the air breakdown point when the distance between the concentric electrodes is 1.7mm at 3.8kDC.
0.1 0.15 0.2 0.25 0.3 0.35 0.4 0.45 0.5 1.7
1.8 1.9 2 2.1 2.2 2.3 2.4 2.5x 10
6
Thickness of insulation [mm]
E
le
c
tr
ic
f
ie
ld
in
ten
s
it
y
[
V
/m]
Figure 32 Electric field intensity on the surface in terms of thickness of insulation.
(17AWG 35/32. Concentric electrodes. Distance between ground and insulation: 4mm, Vo=3.8kV)
1 1.5 2 2.5 3 3.5 4 4.5 5 1.5 2 2.5 3 3.5 4
4.5x 10
6 Distance [mm] E le c tr ic f ie ld i n te n s ity [ V /m]
Figure 33 Electric field intensity on the surface in terms of the distance
(17AWG 35/32. Cylindrical shape. Insulation thickness: 0.343mm, Vo=3.8kV )
0 0.5 1 1.5 2 2.5
0.8 1 1.2 1.4 1.6 1.8 2
Radius E lec tr ic F ie ld I n te n s it y [ M V /m]
Figure 34 Electric field intensity between concentric electrodes at a distance 4mm
(17AWG 35/32. PFA insulation thickness: 0.343mm Calculation (left), Simulation (right))
There is possibility that the airgap insulation causes more serious problem than the 1.7mm