ABSTRACT
HUGHES, STEPHANIE CRISTINA. Electrochemical Studies of Neuroactive Molecules with Fast-Scan Cyclic Voltammetry at Carbon-Fiber Microelectrodes. (Under the direction of Dr. Leslie A. Sombers.)
Understanding the chemical dynamics of neuroactive molecules is critical to
understanding the mechanisms underlying neurodegenerative disease states such as
Parkinson’s Disease (PD). Electrochemical techniques are well-suited to monitor the
chemical dynamics of neuroactive molecules. In particular, fast-scan cyclic voltammetry
(FSCV) at carbon-fiber microelectrodes is a prominent neuroanalytical tool that combines
unparalleled micron spatial resolution and sub-second temporal resolution to monitor
dynamic changes in neuroactive molecules in real-time to elucidate the chemical dynamics
that underlie brain function and dysfunction in neurodegenerative disease states such as PD.
This research aims to provide the framework for developing and modifying analytical tools
to monitor neuroactive molecules such as nitric oxide (NO), and builds upon current
techniques to monitor dopamine (DA) dynamics following pharmacological treatment with
L-3,4-dihydroxyphenylalanine (L-DOPA) in living brain tissue in real-time.
NO is a highly reactive free radical reactive nitrogen species (RNS) that has been
implicated in the pathogenesis and progression of PD. NO quickly reacts to produce more
aggressive RNS such at peroxynitrite that interrupt normal cell signaling and ultimately lead
to cell death. In this study, FSCV at carbon-fiber microelectrodes was used to detect NO in vitro with a well-established waveform. The use of Nafion-coated carbon-fiber
brain slice tissue. In the future, this approach will enable the detection of NO in living tissue
capable of addressing the role of RNS such as NO, in oxidative stress in PD.
The effects of L-DOPA on DA dynamics from single pulse electrical stimulations, as
well as artificial phasic stimulation paradigms in striatal brain slices were assessed. In the
presence of 50 μM L-DOPA the ability to detect DA at Nafion-coated carbon-fiber
microelectrodes in vitro was hindered and caused irreversible fouling of the electrode. A more clinically relevant dose of L-DOPA (1 μM) significantly increased electrically-evoked
DA release at Nafion-coated carbon-fiber microelectrodes in a phasic firing paradigm.
Release and reuptake parameters of DA by way of the DA transporter (DAT) were assessed
and DA reuptake was decreased following a more clinically relevant dose of L-DOPA. This
work builds on the understanding DA release and reuptake dynamics following L-DOPA
treatment and will provide the foundation to assess the effects of L-DOPA on DA release and
reuptake parameters in Parkinsonian animals to build a more complete picture of the
© Copyright 2013 by Stephanie Cristina Hughes
Electrochemical Studies of Neuroactive Molecules with Fast-Scan Cyclic Voltammetry at Carbon-Fiber Microelectrodes
by
Stephanie Cristina Hughes
A thesis submitted to the Graduate Faculty of North Carolina State University
in partial fulfillment of the requirements for the degree of
Master of Science
Chemistry
Raleigh, North Carolina
2013
APPROVED BY:
_______________________________ ______________________________
Dr. Leslie A. Sombers Dr. Gregory S. McCarty
BIOGRAPHY
And whatever you do, do it heartily, as to the Lord and not to men.
ACKNOWLEDGMENTS
There are many individuals that I wish to thank for the help and support they have
given me during my time at NC State. First, I would like to thank the wonderful professors I
have had in my graduate classes. It was a privilege to learn from each and every one of
them. I would also like to acknowledge my undergraduate mentors, Dr. Carol M. Babyak
and Dr. B.J. Yoblinski for continuing to encourage me and mentor me throughout my
undergraduate and graduate careers. I would like thank the members of my examining
committee, Dr. Leslie Sombers, Dr. Gregory McCarty, Dr. Morteza Khaledi, and Dr.
Kenneth Hanck for taking the time to read this thesis.
Thank you to the entire Sombers lab, I cannot imagine a better group of people to
work with. I especially would like to thank Dr. Marina Spanos who reviewed this document
with unbelievable attention to detail. I appreciate your hard work and relentless
encouragement and I am so grateful to have made such a wonderful friend and mentor.
Thank you for helping me the whole way through and for helping me to realize my dreams! I
would also like to thank Leyda Lugo Morales who also helped review this document and
provided me with insight throughout each one of my projects and who also taught me many
invaluable lessons in science. I am thankful for your friendship! I do not know how I would
have gotten any brain slice experiments to work without Dr. James Roberts, who not only
taught me but helped me prepare for each and every brain slice experiment. Not only that,
thank you for your insight each time I met a brick wall. Thank you to Julie Gras-Najjar who
coffee walks. Thank you to Hadeer Metwally and Rochana Jayakumar for sticking it out
with me through each one of my projects, you guys are the best!
I would like to thank my parents, Steve and Emma Hughes and my sisters, Stacey and
Susan for all of their support throughout each and every moment of my life. I am so very
thankful that I have the most wonderful family, a gift that could have only come from God. I
would also like to thank Samantha Blake, Deanna Tesch, Phil Loziuk, Erik Loomis, Diane
McClary, Ashley Accursio, David Bowman, Nick Merrill, Christer Akouala and Bethany
Carter whose friendships mean so very much to me. Thank you to my Cataloochee Ski Patrol
Family for always having my back and keeping me sane. Thank you especially to Chase
White for believing in me and for supporting me through thick and thin, even when I didn’t
think I could continue. You constantly remind me that there is a greater purpose to
everything.
I would like to give a very special thanks to Dr. Erin Banks who believed in me each and
every day. Thank you for the impact you have had on my career. I am so thankful for you
and the IMSD program at NC State. You all are like family and this is all because of Dr.
Banks. Thank you so much for all of the meetings and talks and checking in on me and
thank you for always building me up. You have taught me so much.
The person who I am most indebted to is my advisor Dr. Leslie A. Sombers. I don’t
think I could have survived this journey without your help, support and patience. Thank you
for helping to mold me into the scientist I am today. I am honored to have had the
TABLE OF CONTENTS
LIST OF EQUATIONS ... viii
LIST OF FIGURES ... ix
CHAPTER 1 Electrochemical Measurements of Biological Molecules ...1
1.1 Chemical Communication in the Brain ...1
1.2 Dopamine Synthesis ...1
1.3 Dopamine Reuptake and Catabolism ...3
1.4 Neurodegeneration ...4
1.5 Parkinson’s Disease ...5
1.6 Oxidative Stress and Parkinson’s Disease ...6
1.7 Treatment for Parkinson’s Disease ...9
1.8 Current Techniques to Monitor Chemicals in the Brain ...10
1.9 Electrochemical Techniques to Monitor Chemicals in the Brain ...12
1. 10 Detecting Dopamine with Fast-Scan Cyclic Voltammetry in Living Brain Tissue ...14
1.11 Chemical Modifications of Carbon-Fiber Microelectrodes ...18
1.12 Conclusion ...19
REFERENCES CHAPTER 1 ...21
CHAPTER 2 Electrochemical Detection of Nitric Oxide ...26
2.2 Measuring Nitric Oxide in Biological Systems ...26
2.3 Electrochemical Measurements of Nitric Oxide ...27
2.4 Materials and Methods ...29
2.4.1 Chemicals ...29
2.4.2 Electrode Fabrication ...30
2.4.3 Data Acquisition ...30
2.4.4 Flow Injection ...31
2.4.5 Preparation of Nafion-Coated Electrodes ...31
2.4.6 Nitric Oxide Sample Preparation ...32
2.4.7 Statistics ...32
2.5 Results and Discussion ...32
2.5.1 NO Cyclic Voltammetry ...32
2.5.2 Variability in NO Electrochemistry ...36
2.5.3 NO Detection at Nafion-Coated Electrodes ...37
2.6 Conclusion ...40
REFERENCES CHAPTER 2 ...42
CHAPTER 3 Investigating the Effect of L-DOPA Treatment at Microelectrodes with Fast-Scan Cyclic Voltammetry in Brain Slice Tissue...44
3.1 Introduction ...44
3.2 Materials and Methods ...47
3.2.2 Electrode Fabrication ...47
3.2.3 Data Acquisition ...47
3.2.4 Flow Injection ...48
3.2.5 Preparation of Nafion-Coated Electrodes ...48
3.2.6 Animals ...49
3.2.7 Brain Slices ...49
3.2.8 Michaelis-Menten Kinetic Analysis ...50
3.2.9 Statistics ...51
3.3 Results and Discussion ...51
3.3.1 Background Subtracted Fast-Scan Cyclic Voltammetry of Dopamine ...51
3.3.2 In Vitro Assessment of Bare and Nafion-Coated Carbon-Fiber Microelectrodes ...53
3.3.3 Assessing the Effects of L-DOPA on DA Dynamics in Striatal Brain Slices ...55
3.3.4 Electrically-Evoked DA as a Function of Stimulus Frequency and Number of Applied Pulses ...60
3.3.5 The Effect of L-DOPA on DA Release and Reuptake Kinetics ...62
3.4 Conclusion ...64
REFERENCES CHAPTER 3 ...66
APPENDICES ...70
LIST OF EQUATIONS CHAPTER 2 EQUATIONS:
Equation 2.1 Electrochemical Oxidation of NO Step 1 ...28
Equation 2.2 Electrochemical Oxidation of NO Step 2 ...28
Equation 2.3 Electrochemical Oxidation of NO Step 3 ...28
Equation 2.4 Electrochemical Reduction of NO...28
LIST OF FIGURES CHAPTER 1:
Figure 1.1Synthesis of Dopamine ...2
Figure 1.2Metabolic Pathways of Dopamine ...4
Figure 1.3 Nigrostriatal Dopamine Pathway ...6
Figure 1.4 Mitochondrial Dysfunction and Oxidative Stress...8
Figure 1.5 Microdialysis Probe ...11
Figure 1.6 SEM Image of a Carbon-Fiber Microelectrode ...14
Figure 1.7 Fast-Scan Cyclic Voltammetry ...15
Figure 1.8 Background Subtracted FSCV ...16
Figure 1.9 Displaying the Data ...17
Figure 1.10 Structure of Nafion ...19
CHAPTER 2: Figure 2.1 Nitric Oxide Representative Voltammogram and Colorplot ...33
Figure 2.2 Acidic pH Shift Representative Voltammogram and Colorplot ...34
Figure 2.3 Current Responses to Varying Concentrations of NO ...36
Figure 2.4 Variability in NO Voltammetry between Batches ...37
Figure 2.5 FSCV of NO at Nafion-Coated Electrodes ...38
Figure 2.6 Comparison of Bare and Nafion-Coated Electrodes ...39
CHAPTER 3: Figure 3.1 Modeling Michaelis-Menten Kinetics with FSCV ...46
Figure 3.3 In Vitro Assessment of Bare and Nafion-Coated Carbon-Fiber
Microelectrodes in the Absence and Presence of L-DOPA ...55
Figure 3.4 Representative Colorplots from Single Pulse Experiments ...57
Figure 3.5 Assessment of DA Release in Brain Slice Tissue Treated
with L-DOPA ...59
Figure3.6 Assessment of Multiple Pulses at 20 and 60 Hz Frequencies of Electrically-Evoked DA at Nafion-Coated Carbon-Fiber Microelectrodes ...61
Figure 3.7 Kinetic Analysis of DA Release and Reuptake Parameters
CHAPTER 1
Electrochemical Measurements of Biological Molecules 1.1 Chemical Communication in the Brain
Neurons are the fundamental components of the nervous system. Communication
between neurons occurs via the synapse by means of chemical messengers known as
neurotransmitters. Action potentials begin at the neuron’s axon hillock and are generated
from the opening and closing of sodium (Na+) and potassium (K+) ion-gated channels. At a
resting membrane potential, these ion-gated channels are closed. Depolarization of the
resting membrane potential causes ion-gated channels to open allowing the influx of Na+.
The membrane potential then continues to rise and current increases until all available Na+
ion-gated channels are opened. Following a change in polarity of the membrane, Na+
ion-gated channels are closed and Na+ ions are actively transported out of the cell, activating K+
ion-gated channels. This generates an efflux of K+ and restores the resting membrane
potential. This depolarization causes neurotransmitters to be released from synaptic vesicles
via exocytosis. Once expelled into the synaptic cleft, neurotransmitters diffuse away from the
presynaptic neuron and bind to receptors on the post synaptic neuron to other neurons to
propagate the message.1
1.2 Dopamine Synthesis
Dopamine (DA) is a monoamine neurotransmitter that is involved in the regulation of
motor behavior, reward and motivation through interacting brain nuclei such as the
mesolimbic, nigrostriatal and tuberinfundibular dopaminergic pathways.2 The amino acid
hydroxylated to L-dihydroxyphenylalanine (L-DOPA) by the enzyme tyrosine hydroxylase
(TH). L-DOPA is then decarboxylated to form DA by aromatic L-amino acid decarboxylase
(AADC), interchangeably called DOPA decarboxylase. The rate-limiting step for the
formation of DA is the enzymatic activity of TH, thus DA formation will only proceed at the
rate of the conversion of tyrosine to L-DOPA.1 A schematic of the synthesis of DA from
tyrosine is shown in Figure 1.1.
Once synthesized, DA must be packaged into synaptic vesicles. This is accomplished
by way of a protein called vesicular monoamine transporter (VMAT). When a cell is
activated, depolarization triggers an influx of calcium ions into the synaptic terminal. This
causes vesicles containing DA to fuse to the cell membrane and expel their contents into the
extracellular space via exocytosis.1
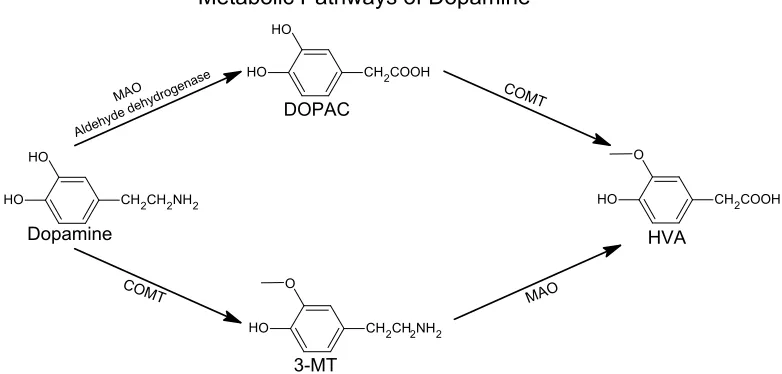
1.3 Dopamine Reuptake and Catabolism
DA reuptake and catabolism are controlled by several mechanisms. The majority of DA
released into the synaptic cleft is recycled. It is actively transported back across the neuronal
membrane into the presynaptic terminal, via the DA transporter (DAT). Alternatively, DA
can be catabolized through enzymatic reactions.3 The primary enzymes responsible for the
metabolism of DA are catechol-o-methyl transferase (COMT) and monoamine oxidase
(MAO). COMT is present in the brain in non-neuronal compartments, whilst MAO is found
intracellularly; the pathway of DA catabolism will depend on the location where breakdown
takes place.3,4 COMT and/or MAO break DA down into various metabolites including
3-methoxy-4-hydroxyphenethylamine (3-MT), 3,4-dihydroxyphenylacetic acid (DOPAC) and
3-methoxy-4-hydroxyphenylactic acid (HVA) also called homovanillic acid. A schematic of
the pathways for DA catabolism is shown in Figure 1.2. In addition to reuptake and
catabolism mechanisms, DA release is regulated by receptors and autoreceptors expressed on
post and pre-synaptic neurons, respectively. These act to regulate neuronal function through
1.4 Neurodegeneration
The progressive loss of neurons or nerve function is known as neurodegeneration and is
seen in such diseases as Parkinson’s disease (PD) and Alzheimer’s disease (AD). Cell death
proceeds by means of two dominate mechanisms, apoptosis, necrosis, or a combination of
both. Programmed cell death or apoptosis, is genetically directed and used to remove cells
that no longer function or are damaged beyond repair. Although cells may enter apoptosis
naturally, cells can be forced into apoptosis when toxins, DNA damage, and oxidative stress
cause the cell to improperly function triggering a cascade of chemical messages inducing cell
death.5 Necrosis is cell death that arises in response to external factors. Neurons that are
neurodegenerative disease states characterized by various symptoms according to the area of
the brain affected or physical symptoms that present.6
1.5 Parkinson’s Disease
Neurodegenerative diseases affect more than a million Americans. PD is the second most
common neurodegenerative disorder, and typically affects people beginning in their sixties.7,8
The Parkinson’s Disease Foundation has determined that approximately 60,000 individuals
are diagnosed with PD in the United States annually. The clinical manifestations associated
with PD include rigidity, resting tremor, bradykinesia (slow movement), akinesia (lack of
movement) and dyskinesia (involuntary movements).9 The disease was first described in
1817 by James Parkinson in a discourse entitled “An Essay on the Shaking Palsy”, though
PD was not formally named until some 60 years later by Jean-Martin Charcot.10,11 PD is
characterized by a selective loss of dopaminergic cell bodies in the substantia nigra (SN) that
project to the dorsal striatum.12,13 This neural circuit is known as the nigrostriatal
dopaminergic pathway and is critical to motor movement.14 The neuronal circuitry involved
in PD is depicted in a rodent model in Figure 1.3.
Once symptoms present in PD patients, as much as 85 % of dopaminergic projections
from the SN to the dorsal striatum are irreversibly destroyed.15 The remaining DA neurons
can compensate for this loss to a certain extent by increasing their firing rate.16 However,
once a certain level of DA denervation has occurred, the remaining neurons cannot maintain
1.6 Oxidative Stress and Parkinson’s Disease
The cause of PD remains elusive; however there are various hypotheses linking
oxidative stress to the pathogenesis and progression of the disease.7, 17 The oxidative stress
hypothesis proposes that oxidative molecules present in the brain are responsible for causing
an increase in oxidant species that induce subsequent damage. These reactive oxygen species
(ROS) and reactive nitrogen species (RNS) include superoxide, nitric oxide, peroxynitrite
and hydrogen peroxide (H2O2). They are capable of oxidizing molecules, including DA, to
form quinones and other species that are broken down into radicals, leading to cellular
samples show increased iron concentrations in the SN of patients with PD, suggesting that
Fenton chemistry contributes to oxidative stress and the formation of damaging radicals in
this brain region.7
It is difficult to detect radical species due to short half-lives and rapid diffusion times,
thus direct evidence for the role of oxidative stress in PD is lacking. Some indirect evidence
comes from common animal models of PD, which are widely used research tools.
Neurotoxins such as hydroxydopamine (OHDA), 1-methyl-4-phenyl-1, 2, 3,
6-tetrahydropyridine (MPTP), rotenone and paraquat can be used to selectively destroy DA
neurons and cause a Parkinsonian-like state.19 It is hypothesized that the oxidation of the
toxins generates ROS and paraquinones that cause DA denervation.18,20 Radical species such
as Nitric oxide (NO) can react with ROS (such as superoxide radical) to form peroxynitrite, a
powerful oxidizing agent that breaks down into other radical species.20 Furthermore, the
expression of the enzyme responsible for the synthesis of NO, nitric oxide synthase (NOS), is
increased in the SN in PD.21 The excessive production of ROS and RNS that lead to
oxidative stress can also oxidize integral proteins, lipids and DNA within neurons leading to
their death.7
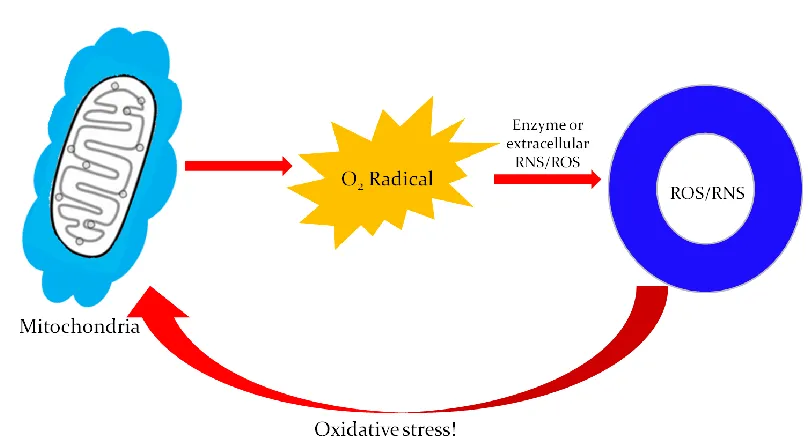
Mitochondrial dysfunction has also been hypothesized to play a role in the
pathogenesis of PD. The origin for this hypothesis stems from studies using the neurotoxin
MPTP, one of the classic PD model toxins known as a mitochondrial poison.20 The
mechanism that leads to mitochondrial dysfunction occurs when MPTP crosses the
blood-brain-barrier and is converted to 1-methyl-4-phenylpyridinium (MPP+) in the SN by the
concentrated in mitochondria, where it can inhibit Complex I.22 The inhibition of
mitochondrial Complex I can deplete the levels of adenosine triphosphate (ATP). This leads
to oxidative stress by way of the increased production of ROS, such as superoxide, which can
be converted to H2O2.22, 23 A schematic demonstrating the production of ROS and oxidative
stress in mitochondria is shown in Figure 1.4. H2O2 is a relatively stable ROS, and thus, it
can serve as an indicator molecule alerting to the presence of more reactive radical species.24
Several other mechanisms contribute to the pathogenesis of PD. The ways in which
protein aggregation and misfolding contribute to the disease are widely controversial. This is
in part due to the post-mortem tissue analysis of patients with PD in which the presence of
protein aggregates known as Lewy bodies varies from significant to non-existent.17 It has
been hypothesized that the misfolding and improper distribution and release of the protein
α-synuclein is key to the pathogenesis of PD.25 Aggregation of misfolded proteins can also lead
to protein sequestration of components that are vital to cell survival. Oxidative stress can
contribute to protein aggregation and misfolding as well. 7, 26
1.7 Treatment for Parkinson’s Disease
Currently there is no cure for PD and the treatment for PD has remained relatively
unchanged since the 1960’s.7
Treatment for is aimed at restoring the DA deficit created by
the loss of DA neurons. This is accomplished by L-DOPA therapy. Though this does not
restore DA neurons, it can restore dopaminergic tone. DA is not capable of crossing the
blood-brain-barrier due to its size, polarity and limited interactions with the protein
responsible for transport across the blood-brain-barrier, large amino acid transporter (LAT).
However, L-DOPA the precursor to DA is actively moved across the blood-brain-barrier by
LAT. Thus, PD therapy is aimed at increasing DA levels in the brain by increasing the
amount of L-DOPA present for the conversion to DA. To prevent the conversion of L-DOPA
to DA peripherally (before crossing the blood-brain-barrier), an AADC inhibitor is given
with DOPA. Furthermore, MAO inhibitors, COMT inhibitors can be coupled with
L-DOPA has successfully been used to treat the symptoms of PD by increasing DA
available for release in the remaining neurons. However, the therapeutic window for
L-DOPA therapy narrows and its efficacy wanes over time. As the disease progresses, the
efficacy of L-DOPA therapy is hindered by the development of L-DOPA induced dyskinesia.
This is characterized by involuntary movements often involving the arms and legs as well as
the trunk.27,28 The cause of L-DOPA induced dyskinesia remains unknown, though studies
have implicated oxidative stress as a contributing factor to L-DOPA induced dyskinesia.29 In
order to make progress in understanding the molecular mechanisms that underlie basic brain
function as well as dysfunction in PD, we must be able to quantitatively measure
neurochemicals in real-time.
1.8 Current Techniques to Monitor Chemicals in the Brain
Communication between neurons is complex as it involves a complex interplay of
chemical and electrical signals. Neurotransmitters and other chemicals present in the brain
rapidly fluctuate with sub-second temporal resolution to elicit a specific biological or
physiological response. Because the brain is a complex mixture of a vast number of
chemicals and hundreds of billions of living cells, understanding the chemical mechanisms
that underlie brain function is a difficult task.
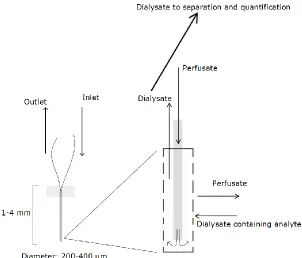
The most commonly used method for studying neurotransmitters in the brain is a
sampling technique known as microdialysis. A microdialysis probe is designed to mimic a
blood capillary, consisting of a shaft (1-4 mm in diameter) with a semi-permeable membrane
at its tip, which is connected to inlet and outlet tubing. This probe is surgically placed into a
of approximately 0.1 – 5 μL·min-1. Small solutes present in the brain can cross the
semi-permeable membrane by passive diffusion. The solution leaving the probe (dialysate) is
collected at timed intervals, separated and quantified. Typically this is accomplished with
high performance liquid chromatography (HPLC), a technique that is well-suited for this type
of analysis.30 Figure 1.5 illustrates a typical microdialysis probe that is inserted into the brain
to monitor neurotransmitters. However, sample collection requires multiple minutes—this is
not commensurate with the timescale of neuronal signaling (sub-second). Furthermore, the
size of the microdialysis probe (1-4 mm) precludes measurements in discrete brain regions.30
1.9 Electrochemical Techniques to Monitor Chemicals in the Brain
Electrochemistry is well-suited for the quantitative analysis of neurotransmission
because real-time measurements can be made using microelectrodes that impart minimal
tissue damage. Electrochemical techniques to monitor neurotransmitters include
amperometry and voltammetry.31 Amperometry is commonly used to study neurotransmitters
in biological systems. In this technique a single potential is applied to an electrode, and any
molecules that exhibit redox activity at that potential contribute to the signal. A variation of
this technique is chronoamperometry in which a potential step is repeatedly applied.32
However; these approaches do not provide selectivity to discriminate between species
detected at the electrode surface. Fast-scan cyclic voltammetry (FSCV) is an electrochemical
technique that combines selectivity with sensitivity.33 FSCV is a potential sweep method in
which the potential applied to the electrode is varied linearly with time. Specifically, FSCV
employs sweep rates that are much faster than those applied to conventional electrodes
(greater than 100 V·s-1) and have been used up to 106 V·s-1 when coupled to
ultramicroelectrodes. 31, 34 A triangular waveform is typically used. This consists of a holding
potential that is varied linearly up to a maximum potential, also called the switching
potential, and then returned to the holding potential. This is then repeated at a specific rate,
typically 10 Hz. The applied waveform is chosen based on the oxidation or reduction
properties of the analyte of interest, and can be tailored to monitor specific molecules
depending on the properties of the system.
FSCV is most often coupled with carbon-fiber microelectrodes. Carbon materials are
inert, allowing for the detection of many types of analytes.31 They are compatible in
biological systems and resist biofouling that can distort voltammetric peaks and alter electron
transfer kinetics much better than metal-based electrodes. These carbon sensors are also
inexpensive and easy to fabricate. Furthermore, the small size of carbon-fiber
microelectrodes enables high speed measurements, and the small current results in a smaller
ohmic drop that may alter electrochemical measurements. This eliminates the requirement for
an auxiliary electrode.32 The use of carbon-fiber microelectrodes with FSCV also creates a
unique situation in which the carbon sensing surface is regenerated through the application of
the waveform, with each scan oxygen-containing functional groups are regenerated and help
maintain the sensitivity of an electrode when the applied potential is scanned up to 1.3 V vs.
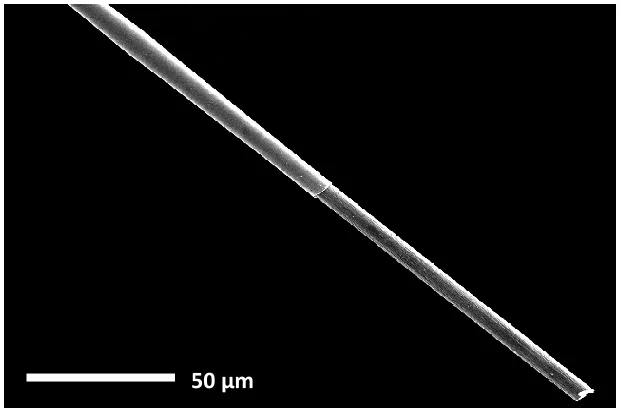
Ag/AgCl.35 An image of a typical carbon-fiber microelectrode used with FSCV is shown in
Figure 1.6. The dimensions of a typical carbon-fiber microelectrode used with FSCV are 5-7
1.10 Detecting Dopamine with FSCV in Living Brain Tissue
The use of FSCV at carbon-fiber microelectrodes is a powerful tool to monitor
rapidly fluctuating molecules such as neurotransmitters in living brain tissue in real-time.36
The rapid sweep rate associated with FSCV provides sub-second temporal resolution
necessary to observe dynamic changes in neurotransmitters. Additionally, the small size of
the probe imparts minimal tissue damage and provides the necessary spatial resolution to
distinguish between discrete brain regions that can vary significantly.
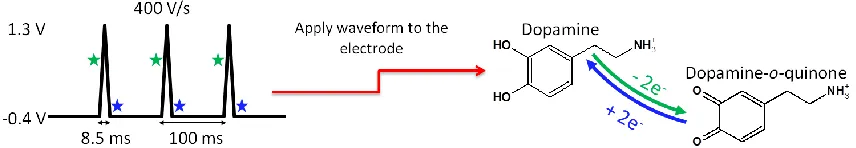
The most commonly used waveform for monitoring DA has a negative holding
potential of -0.4 V vs. Ag/AgCl during the ~90 msec between scans. Thus,
positively-charged DA molecules pre-concentrate at the electrode surface. The potential is then linearly Figure 1.6SEM Image of a Carbon-Fiber Microelectrode. A carbon-fiber microelectrode is composed of an exposed sensing surface, generally cut with a surgical scalpel to a length of 100-300 μm. The diameter of the carbon-fiber is 5-7 μm.
swept at a rate of 400 V·s-1 up to +1.3 V and back to -0.4 V a rate of 10 Hz.37 Figure 1.7
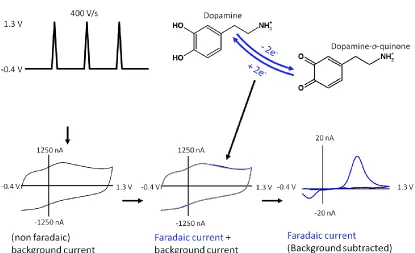
illustrates the established waveform used for the detection of DA. A large background or
capacitative current is generated when recording in a buffer solution or brain tissue. This
background current is a result of non-faradaic processes occurring at the electrode surface.
When an analyte of interest is oxidized or reduced at the electrode surface an additional
faradaic current is generated. Since the non-faradaic background current is stable over time it
can be subtracted to reveal the smaller faradaic current. As the potential is ramped upward on
the anodic scan toward the switching potential DA is oxidized (0.6 V vs. Ag/AgCl.) to
dopamine-o-quinone in a two-electron transfer process. On the cathodic return scan,
dopamine-o-quinone (-0.2 V vs. /AgCl.) is reduced back to DA. When the background
subtracted faradaic current is plotted with respect to applied voltage a unique voltammogram
for DA is generated (Figure 1.8).
The faradaic current can be converted to concentration during post-calibration
enabling quantification of real-time DA fluctuations. Therefore this technique provides both
qualitative and quantitative data in brain tissue. The process of background subtraction
reveals the cyclic voltammogram (current vs. potential) used to identify DA is shown in
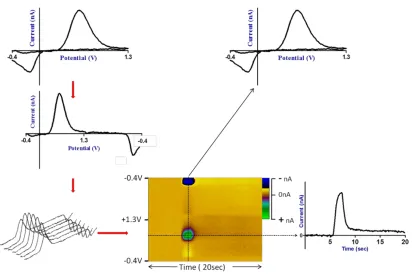
Figure 1.8. Data is generally collected at a frequency of 10 Hz. Therefore for a 30 second file
we generate 30,000 data points. In order to better understand this large volume of data at a
glance we plot the linear voltammograms with respect to time in a color plot.
The applied voltage is plotted as the ordinate, time is plotted as the abscissa and changes in
current are plotted using a color representation on the z-axis. This allows visualization of
data collected at all of the potentials. As different analytes have distinct voltammograms,
multiple chemical species can be visually discriminated in the data at any given point. Figure
1.9 demonstrates how a colorplot for DA is obtained.
1.11 Chemical Modification of Carbon-Fiber Microelectrodes
Although FSCV at carbon-fiber microelectrodes is a powerful technique for
monitoring molecules in neuroscience, there are interferents in the brain that can limit the
applicability of the technique. Some molecules, including serotonin and a variety of
neuropeptides, have been shown to polymerize at the electrode surface decreasing electrode
sensitivity and reproducibility to the analyte of interest.38 For these reasons, many
permselective membranes have been coated onto carbon-fiber microelectrodes to improve
performance.
Nafion-coated carbon-fiber microelectrodes have been used extensively to increase
the sensitivity of cationic analytes and expel anionic interfering species that oxidize or reduce
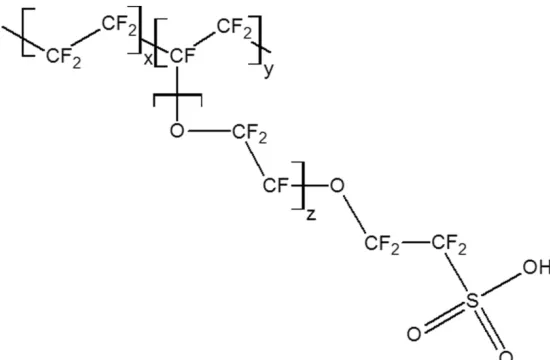
in a similar potential window. Nafion is a perfluorinated cation-exchange polymer
developed by Walther Grot of DuPont in the 1960s. The polymer is synthesized from the
Teflon monomer, perfluorinated alkyl vinyl ether, and sulfonyl acid that is treated with
sodium hydroxide to yield sulfonate groups that are terminally functionalized on the
polymer.39 The structure is shown in Figure 1.10. The terminal sulfonate group is key to the
The use of Nafion to detect cationic neurotransmitters in the central nervous system
(CNS) at carbon electrodes was first described by Ralph Adams in 1985.40 Since then, the
polymer has been widely used and has been shown to be beneficial in detecting
neurotransmitters with primary amines (serotonin, DA, and norepinephrine) while excluding
interfering anionic species (ascorbic acid) and biogenic amine metabolites.40 Furthermore,
the use of Nafion can increase the sensitivity of electrodes to these cations without
significantly slowing the time response on the electrode.41
1.12 Conclusion
Understanding the chemical dynamics underlying brain function and dysfunction
remains one of the greatest modern scientific challenges. Advances in technology have
provided us with the necessary tools to uncover the chemical dynamics underlying brain Figure 1.10Structure of Nafion. The perfluorinated polymer, Nafion, is made from a Teflon
function. Despite these advances, some molecules have been elusive and some studies
inconclusive. A complete understanding of the brain and neurodegenerative disease states
relies exclusively in the continued advancement of investigative tools including advances in
neuroanalytical techniques. Electrochemical techniques, FSCV in particular, have provided
us with the ability to monitor neuroactive molecules in real-time. The unique properties of
FSCV and future advancements in neuroanalytical tools and neuroscience from continued
research in the field will lend themselves to unprecedented discoveries that can help us
understand neurodegenerative disease states like PD, and form the foundation for which new
REFERENCES CHAPTER 1
1. Bear, M. C., BW; Paradiso, MA, Neuroscience: Exploring the Brain (3rd ed). Third ed.; Lippincott, Williams & Wilkins: Baltimor, MD, 2007.
2. Albanese, A.; Altavista, M. C.; Rossi, P., Organization of central nervous system dopaminergic pathways. J Neural Transm Suppl 1986,22, 3-17.
3. Kopin, I. J., Catecholamine metabolism: basic aspects and clinical significance.
Pharmacol Rev 1985,37 (4), 333-64.
4. Elsworth, J. D.; Roth, R. H., Dopamine synthesis, uptake, metabolism, and receptors: relevance to gene therapy of Parkinson's disease. Exp Neurol 1997,144 (1), 4-9.
5. Elmore, S., Apoptosis: a review of programmed cell death. Toxicol Pathol 2007,35
(4), 495-516.
6. Kanduc, D.; Mittelman, A.; Serpico, R.; Sinigaglia, E.; Sinha, A. A.; Natale, C.; Santacroce, R.; Di Corcia, M. G.; Lucchese, A.; Dini, L.; Pani, P.; Santacroce, S.; Simone, S.; Bucci, R.; Farber, E., Cell death: apoptosis versus necrosis (review). Int J Oncol 2002,21 (1), 165-70.
7. Dexter, D. T.; Jenner, P., Parkinson disease: from pathology to molecular disease mechanisms. Free Radic Biol Med 2013.
8. Van Den Eeden, S. K.; Tanner, C. M.; Bernstein, A. L.; Fross, R. D.; Leimpeter, A.; Bloch, D. A.; Nelson, L. M., Incidence of Parkinson's disease: variation by age, gender, and race/ethnicity. Am J Epidemiol 2003,157 (11), 1015-22.
10.Parkinson, J., An Essay on the Shaking Palsy. Whittingham and Rowland: London, 1817.
11.Goetz, C. G., The history of Parkinson's disease: early clinical descriptions and neurological therapies. Cold Spring Harb Perspect Med 2011,1 (1), a008862.
12. Dauer, W.; Przedborski, S., Parkinson's disease: mechanisms and models. Neuron 2003,39 (6), 889-909.
13.Hirsch, E.; Graybiel, A. M.; Agid, Y. A., Melanized dopaminergic neurons are differentially susceptible to degeneration in Parkinson's disease. Nature 1988,334
(6180), 345-8.
14.Beninger, R. J., The role of dopamine in locomotor activity and learning. Brain Res 1983,287 (2), 173-96.
15.Jellinger, K. A., Pathology of Parkinson's disease. Changes other than the nigrostriatal pathway. Mol Chem Neuropathol 1991,14 (3), 153-97.
16.Bergstrom, B. P.; Garris, P. A., "Passive stabilization" of striatal extracellular dopamine across the lesion spectrum encompassing the presymptomatic phase of Parkinson's disease: a voltammetric study in the 6-OHDA-lesioned rat. J Neurochem 2003,87 (5), 1224-36.
17.Jenner, P., Oxidative stress in Parkinson's disease. Ann Neurol 2003,53 Suppl 3, S26-36; discussion S36-8.
18.Tieu, K.; Ischiropoulos, H.; Przedborski, S., Nitric oxide and reactive oxygen species in Parkinson's disease. IUBMB Life 2003,55 (6), 329-35.
20.Przedborski, S.; Ischiropoulos, H., Reactive oxygen and nitrogen species: weapons of neuronal destruction in models of Parkinson's disease. Antioxid Redox Signal 2005,7
(5-6), 685-93.
21.Hirsch, E. C.; Breidert, T.; Rousselet, E.; Hunot, S.; Hartmann, A.; Michel, P. P., The role of glial reaction and inflammation in Parkinson's disease. Ann N Y Acad Sci 2003,991, 214-28.
22.Mizuno, Y.; Ohta, S.; Tanaka, M.; Takamiya, S.; Suzuki, K.; Sato, T.; Oya, H.; Ozawa, T.; Kagawa, Y., Deficiencies in complex I subunits of the respiratory chain in Parkinson's disease. Biochem Biophys Res Commun 1989,163 (3), 1450-5.
23.Schapira, A. H.; Cooper, J. M.; Dexter, D.; Clark, J. B.; Jenner, P.; Marsden, C. D., Mitochondrial complex I deficiency in Parkinson's disease. J Neurochem 1990,54
(3), 823-7.
24.Bao, L.; Avshalumov, M. V.; Patel, J. C.; Lee, C. R.; Miller, E. W.; Chang, C. J.; Rice, M. E., Mitochondria are the source of hydrogen peroxide for dynamic brain-cell signaling. J Neurosci 2009,29 (28), 9002-10.
25.Lucking, C. B.; Brice, A., Alpha-synuclein and Parkinson's disease. Cell Mol Life Sci 2000,57 (13-14), 1894-908.
26.Rubinsztein, D. C., The roles of intracellular protein-degradation pathways in neurodegeneration. Nature 2006,443 (7113), 780-6.
27.Obeso, J. A.; Olanow, C. W.; Nutt, J. G., Levodopa motor complications in Parkinson's disease. Trends Neurosci 2000,23 (10 Suppl), S2-7.
29.Jenner, P., Molecular mechanisms of L-DOPA-induced dyskinesia. Nat Rev Neurosci 2008,9 (9), 665-77.
30.Chefer, V. I.; Thompson, A. C.; Zapata, A.; Shippenberg, T. S., Overview of brain microdialysis. Curr Protoc Neurosci 2009,Chapter 7, Unit7 1.
31.Robinson, D. L.; Hermans, A.; Seipel, A. T.; Wightman, R. M., Monitoring rapid chemical communication in the brain. Chem Rev 2008,108 (7), 2554-84.
32.Bard, A. J.; Faulkner, L. R., Electrochemical methods : fundamentals and applications. 2nd ed.; Wiley: New York, 2001; p xxi, 833 p.
33.Millar, J.; Stamford, J. A.; Kruk, Z. L.; Wightman, R. M., Electrochemical, pharmacological and electrophysiological evidence of rapid dopamine release and removal in the rat caudate nucleus following electrical stimulation of the median forebrain bundle. Eur J Pharmacol 1985,109 (3), 341-8.
34.Amatore, C.; Maisonhaute, E., When voltammetry reaches nanoseconds. Anal Chem 2005,77 (15), 303A-311A.
35.Roberts, J. G.; Moody, B. P.; McCarty, G. S.; Sombers, L. A., Specific oxygen-containing functional groups on the carbon surface underlie an enhanced sensitivity to dopamine at electrochemically pretreated carbon fiber microelectrodes. Langmuir 2010,26 (11), 9116-22.
36.Roberts, J. G.; Lugo-Morales, L. Z.; Loziuk, P. L.; Sombers, L. A., Real-time chemical measurements of dopamine release in the brain. Methods Mol Biol 2013, 964, 275-94.
38.Hashemi, P.; Dankoski, E. C.; Petrovic, J.; Keithley, R. B.; Wightman, R. M., Voltammetric detection of 5-hydroxytryptamine release in the rat brain. Anal Chem 2009,81 (22), 9462-71.
39.Grot, W., Fluorinated ionomers. William Andrew Pub.: Norwich, NY, 2008; p xii, 238 p.
40.Gerhardt, G. A.; Oke, A. F.; Nagy, G.; Moghaddam, B.; Adams, R. N., Nafion-coated electrodes with high selectivity for CNS electrochemistry. Brain Res 1984,290 (2), 390-5.
41. Kristensen, E. W.; Kuhr, W. G.; Wightman, R. M., Temporal characterization of perfluorinated ion exchange coated microvoltammetric electrodes for in vivo use.
CHAPTER 2
Electrochemical Detection of Nitric Oxide 2.1 Introduction to Reactive Nitrogen Species
RNS are highly reactive nitrogen and oxygen containing molecules that are known to
contribute to nitroxidative and oxidative stress.1,2,3 In particular, NO, a highly reactive, free
radical RNS, is involved in a diverse array of biological functions including signal
transduction in the nervous system as a gaseous neurotransmitter.4,5 NO is endogenously
produced within a cell from the reduction of L-arginine through a family of enzymes known
as NOS and can quickly and easily diffuse across cell membranes.6,7
NO has been implicated in the onset and progression of various neurodegenerative
diseases including PD by contributing to oxidative stress. Though NO has been shown to be
cytoprotective, evidence suggests that derivatives of NO such as peroxynitrite and nitrogen
dioxide contribute to oxidative stress resulting in both cell dysfunction and cell death.1,2 Due
to the role that NO and its derivatives play in nitroxidative and oxidative stress,
understanding the various functions of NO in the brain and the extent to which this central
molecule contributes to oxidative and nitroxidative stress is crucial to understanding the
mechanisms underlying neurodegenerative disease states such as PD.
2.2 Measuring Nitric Oxide in Biological Systems
The detection and quantification of NO in biological systems is generally
accomplished in one of three ways, by means of spectrophotometric techniques, indicator
species, and electrochemical techniques.8 Spectrophotometric techniques provide the
indicator techniques. However, spectrophotometric analyses often require derivitization of
NO to induce a signal, such as with chemiluminesence and fluorescence methods. In these
types of analyses, derivitization of NO induces spectrophotometric signals that cannot be
easily quenched, thus signals cannot be isolated limiting the selectivity of this technique for
NO. Indicator techniques such as the Griess assay are commonly used as this is the most cost
effective method of detecting NO. The Griess assay requires a secondary molecule, in this
case nitrite, which can only be detected once bound to sulphanilic acid producing a color
change to estimate initial concentrations of NO in biological systems.9 It was recently shown
that the Griess assay is significantly less effective in various physiological buffers used to
quantify NO than both chemiluminesence and electrochemical techiques.10
The electroactive properties of NO make electrochemical techniques an inherently
viable method for the quantification and identification of NO. Electrochemical sensors can be
made from a variety of materials and tailored to provide discrete spatial resolution in samples
such as single cells and brain nuclei.11 NO diffuses rapidly, approximately 3300 μm2·s-1, and
readily reacts with many species often found in physiological buffers, including oxygen and
carbon dioxide.12,13 Electrochemical techniques provide the ability to make rapid chemical
measurements of NO in living tissue and biological media providing the necessary temporal
resolution to quantify a rapidly fleeting analyte such as NO.
2.3 Electrochemical Measurements of Nitric Oxide
The oxidation of NO is a three electron process that proceeds in multiple steps as an
electrochemical chemical electrochemical (ECE) reaction. The oxidation of NO is typically
is converted to NO+, in a single electron transfer step. NO+ then reacts in an immediate
chemical step. In the third and final electrochemical step, nitrate and hydrogen ions are
produced. The reaction scheme for the oxidation of NO is shown in equations 2.1-2.3.8
(2.1)
(2.2)
(2.3)
The majority of electrochemical sensors used in biological media have utilized the
electrochemical oxidation of NO; however, some electrochemical approaches rely on
monitoring its reduction. 8 This occurs in a single electron transfer step between 0.5 and
-1.4 V versus Ag/AgCl. The electron transfer of the reduction of NO is presented in equation
4.15 Although the electrochemical reduction of NO proceeds in a single step process, various
obstacles complicate detection. The reduction potentials of NO (-0.5 and -1.4 V vs.
Ag/AgCl) and oxygen (-1.4 V vs. Ag/AgCl) are sufficiently close that oxygen may interfere
with the detection of NO.15, 16 Furthermore, other chemical species present in biological
media make NO sensors operating via electroreduction particularly prone to the irreversible
adsorption of molecules in solution (also called fouling).8, 11 These are also sensitive to pH
shifts, such that observing dynamic fluctuations of NO are obscured.11
There are also a number of interferents that could mask the detection of NO via
oxidation, including nitrite (produced in the second electron transfer step of the oxidation of
NO), dopamine (+0.6 V vs. Ag/AgCl),uric acid (+0.3 V vs. Ag/AgCl) and ascorbic acid
(+0.4 V vs. Ag/AgCl) which are electroactive in similar potential windows.8, 11,17 However,
polymeric permselective membranes, such as Nafion have been successfully used to improve
selectivity.
To date, the overwhelming majority of sensors for the detection of NO in biological
systems rely on amperometry.18 Though this technique provides a wide dynamic range
(pM-mM), amperometric sensors lack selectivity, thus any species present in the solution that
oxidizes or reduces at a similar potential contributes to the signal.11 In comparison, the use
of FSCV provides sub-second temporal resolution, micron spatial resolution as well as high
sensitivity and selectivity for analytes of interest. Cyclic voltammograms provide a unique
chemical signature, enabling discrimination of specific analytes in complex biological
mixtures. This is particularly important due to the vast number of chemical components and
present in the brain. This work demonstrates the foundation and preliminary work of
quantifying and characterizing RNS, specifically NO, using FSCV at carbon-fiber
microelectrodes.
2.4 Materials and Methods 2.4.1 Chemicals
All chemicals were purchased from Sigma-Aldrich (Milwaukee, WI) and used as
7.40 was used in all flow injection analysis experiments. Aqueous solutions were prepared
using doubly distilled deionized water (Milli-Q Millipore, Billerica, MA).
2.4.2 Electrode Fabrication
Carbon-fiber microelectrodes were constructed in house. A single T-650 carbon fiber
(Cytec Industries, West Patterson, NJ), 7 μm in diameter, is aspirated through a 0.4 mm inner
diameter borosilicate glass capillary (A-M systems, Inc., Sequim, WA) and tapered with a
heat puller (Narishige, Japan) to create a tight seal around the exposed carbon fiber. Each
electrode was then cut to approximately 100 μm under a microscope (Zeiss Primostar) using
a surgical scalpel. Electrodes were then inspected for cracks in the seal and for the
appropriate length. A metal lead coated in conductive silver paint (GC Electronics, Silver
Print II, Rockford, IL) was then inserted into the electrode and secured with heat shrink
tubing.
2.4.3 Data Acquisition
All in vitro studies were performed using a flow injection apparatus. For all experiments a triangular waveform from -0.4 to +1.4 V vs. Ag/AgCl was applied at a scan rate of 400 V·s-1
at a frequency of 10 Hz. The instrument used to apply the potential to the electrochemical
cell and for signal transduction was custom built (United World Dominion, Mebane, NC).
Waveform output was accomplished using TarHeel CV software (UNC-Chapel Hill, Chapel
Hill, NC) with a DAC/ADC card (NI 6251 M). Triggering and synchronization of
electrochemical experiments with flow injection was accomplished using a NI 6711 card.
Background subtraction, averaging and filtering was controlled using a 4-pole Bessel Filter at
2.4.4 Flow Injection
Carbon-fiber microelectrodes were placed in a custom-built electrochemical cell
(NCSU Chemistry Machine Shop) using a micromanipulator (World Precision Instruments,
Inc. Sarasota, FL). Buffer was continuously supplied at a flow rate of 1 mL·min-1 across the
working and reference electrode using a syringe pump (NE 300, New Era Pump Systems,
Inc., Farmingdale, NY). Analytes were introduced to the microelectrode surface in 5 second
bolus injections via a six-port HPLC valve attached to an air actuator by means of a digital
pneumatic solenoid valve kit (Valco Instruments, Houston, TX). The flow injection
apparatus was housed in a home-built Faraday cage. Unless otherwise specified, all
experiments were performed at room temperature.
2.4.5 Preparation of Nafion-Coated Electrodes
Bare carbon-fiber microelectrodes were electrochemically pre-treated by applying the
waveform for 10 minutes at 60 Hz and subsequently for 10 minutes at 10 Hz. Electrodes
were then initially tested for ascorbic acid sensitivity, rinsed with doubly deionized water,
and cleaned for 30 minutes in filtered isopropyl alcohol. A solution of 5 % Nafion in
methanol (Ion Power DuPont 10521 Nafion Solution, New Castle, DE) was electro-deposited
onto the electrode by applying a potential of +1.0 V versus Ag/AgCl for 30 seconds forming
a membrane. Electrodes were then dried in an oven at 70°C for ten minutes to ensure that the
methanol was evaporated. Each Nafion-coated electrode was then tested for sensitivity to
ascorbic acid, to verify the integrity of the Nafion membrane. Only those exhibiting less than
2.4.6 Nitric Oxide Sample Preparation
All NO stock solutions were graciously supplied courtesy of Dr. Mark Schoenfisch in
the department of Chemistry at UNC-Chapel Hill. Solutions of filtered PBS at pH 7.40 were
placed on ice in centrifuge tubes and capped with a rubber septum. A stainless steel cylinder
containing saturated potassium hydroxide was used to scavenge any oxygen present in the
argon used to purge the solution and the NO used to prepare the stock solution. PBS
solutions were bubbled with argon for approximately 30 minutes, followed by NO gas for 20
min. The resulting stock solution contained 1.9 mM NO.7 Standard solutions (10-38 μM)
were freshly prepared using the saturated NO solution in argon-bubbled PBS (pH 7.40). All
standard solutions were prepared in an oxygen-free atmosphere (courtesy of Dr. Reza Ghiladi
at NCSU).
2.4.7 Statistics
For all studies, n refers to the number of electrodes. Statistical significance was designated at
P < 0.05 using a one-tailed Student’s t-test. All graphical and statistical analyses were accomplished using GraphPad Prism 5 (GraphPad Software, Inc., La Jolla, CA).
2.5 Results and Discussion
2.5.1 Nitric Oxide Cyclic Voltammetry
For all NO studies, data was collected in an in vitro flow injection apparatus. The potential applied to the electrode was ramped linearly from -0.4 to 1.4 V versus Ag/AgCl at
400 V·s-1 andat a frequency of 10 Hz to oxidize NO in solution. A representative
voltammogram following the introduction of a 5 s bolus injection of 10 μM NO solution is
peak occurs at approximately 1.35 V versus Ag/AgCl on the anodic scan. This may possibly
correspond to the first electrochemical step generating NO+. A second oxidative peak
appears near the switching potential. These two oxidative peaks are also present in the
representative colorplot as shown in Figure 2.1 B.
The final electrochemical step in the oxidation of NO produces nitrate and hydrogen
ions. If detected at our electrode, this would result in a pH shift in the data. The cathodic
comparison, representative voltammograms and the corresponding color plot for an acidic pH
shift (7.30 or ΔpH = -0.1) are shown in Figure 2.2 A-B.
The relationship between current and NO concentration was characterized (10-38
μM). Figure 2.3 A demonstrates representative cyclic voltammograms for increasing
concentrations of NO and the corresponding calibration curve is shown in Figure 2.3 B (n =
1). The current increases with increasing concentrations of NO. However, the response
between electrodes was highly variable, as seen in Figure 2.3 C-D. The maximum current is
expected to correspond to the highest concentration of NO; however, this was not always the
case and this contributes to the variability inherent to Figure 2.3 A-D. The variability can be
attributed to several possibilities. All dilutions prepared from the stock NO solution (1.9
did not include passage through a stainless steel cylinder containing saturated potassium
hydroxide as described in the preparation of calibration and stock solutions of NO.7
Although gases used in this study were high purity, traces of oxygen and other oxidant
species may have been present in the argon, differentially affecting each solution. A second
possibility is excessive aeration of the samples. Although samples were prepared in an
oxygen-free atmosphere, the flow injection apparatus was not housed in an oxygen-free
atmosphere. Samples were drawn from vials via 5 mL syringes and injected into the six-port
HPLC valve. Any aeration of the samples may have changed the concentration of NO
present in solution, affecting the voltammetric response. The variability in the
2.5.2 Variability in Nitric Oxide Electrochemistry
The variability in the electrochemistry of NO was also evident between batches of
stock solution. As seen in Figure 2.4, voltammograms collected from different stock
solutions in different months and years lack reproducibility. Again, this may be attributed to
February injection appears to be an acidic pH shift. This can be compared with the
voltammogram from Figure 2.2 A.
2.5.3 Nitric Oxide Detection at Nafion-Coated Electrodes
Due to the variability exhibited in preliminary electrochemical experiments, Nafion
was used to coat the carbon-fiber microelectrodes. Recall that Nafion is a cation exchange
polymer that has been shown to increase sensitivity to NO and expel interfering anionic
species. 17, 19 Figure 2.5 A depicts representative voltammograms for varying concentrations
of NO collected at Nafion-coated carbon-fiber microelectrodes (n = 2). As expected, with increasing concentrations of NO, the current increases as seen in Figure 2.5 B.
Figure 2.4Variability in NO Voltammetry between Batches. The voltammograms for a 10 μM bolus injection of NO varied from solution to solution.
Potential, V (vs. Ag/AgCl)
A direct comparison of bare versus Nafion-coated carbon-fiber electrodes is shown in
Figure 2.6 A-C. For each concentration, the current response at Nafion-coated electrodes is
greater than that of the bare electrodes. The Nafion-coated electrode current response is
significantly greater than that of bare electrodes for both the 10 and 20 μM solutions (Figure
2.6 D , P < 0.05, n = 2, Student’s t-test).
Figure 2.5FSCV of Nitric Oxide at Nafion-Coated Electrodes (A) Cyclic voltammograms of increasing concentrations of NO for n = 2 electrodes. (B) Increasing current with increasing
The current response of the highest concentration of NO solution (38 μM) at
Nafion-coated electrodes was not significantly different than the current response of bare electrodes.
When using a bare electrode, some samples produce more current for the 20 μM solution of
NO than the 38 μM solution of NO (Figure 2.3). This may have contributed to the lack of
significance at the highest concentration. Nafion is a cation exchange polymer, therefore a Figure 2.6Comparison of Bare and Nafion-Coated Electrodes (A-C) Representative
Nafion membrane at a carbon-fiber microelectrode surface has the capacity to exclude
interfering anionic species that may interfere with the detection of an analyte of interest.
Nitrite produced during the oxidation of NO may interfere with the detection .8 The
enhancement in signal seen with Nafion-coated carbon-fiber microelectrodes may in part be
due to expelling nitrite present at the electrode surface.
2.6 Conclusion
The data presented in this study provide a foundation for the quantification and
characterization of NO with FSCV at carbon-fiber microelectrodes. A unique voltammetric
signature for NO was obtained and found to contain two oxidation peaks. The first oxidation
peak is present at approximately 1.35 V versus Ag/AgCl, and the second is evident near the
switching potential. A reduction peak was also present at approximately 0.28 V versus
Ag/AgCl. This could be attributed to an acidic pH shift due to nitrate and hydrogen ions
generated in the final electrochemical step of the oxidation of NO (equation 2.3). There was
significant variability in the data, possibly due to the introduction of oxygen to NO solutions.
The use of Nafion as a permselective membrane significantly enhanced the current in
response to concentration at calibration standards of 10 and 20 μM NO solutions. In order to
optimize and validate the detection of NO with FSCV, further studies should investigate
various parameters to discriminate NO from other ROS and RNS, and to better define the
chemical transformations at the electrode surface. The linear dynamic range for NO detected
with FSCV should be assessed. Although the concentrations evaluated in this study
produced a signal, the concentrations may have surpassed the linear dynamic range for NO
concentrations of NO at Nafion-coated carbon-fiber microelectrodes if aeration and improper
bubbling of the samples can be controlled. The switching potential should be optimized to
produce well-resolved peaks. Although the waveform employed in this study was sufficient
to oxidize NO, the oxidation peaks are poorly resolved. Varying the scan rate would also
help to determine if the chemical step, defined in equation 2 is taking place. At 400 V·s-1, we
may be outrunning this reaction. A slower scan rate on the order of 0.1-10 V·s1 would allow
us to investigate this further. However, maintaining a fast scan rate is necessary for detection
in live tissue, as these chemical species are short-lived. Selectivity versus common
interferents must be assessed. Next, the approach should be validated in live tissue using a
controlled condition, such as application of exogenous NO to a brain slice. Finally,
validation by pharmacological manipulation is necessary. The use of a drug to manipulate
REFERENCES CHAPTER 2
1. Przedborski, S.; Dawson, T. M., The role of nitric oxide in Parkinson's disease.
Methods Mol Med 2001,62, 113-36.
2. Tieu, K.; Ischiropoulos, H.; Przedborski, S., Nitric oxide and reactive oxygen species in Parkinson's disease. IUBMB Life 2003,55 (6), 329-35.
3. Moilanen, E.; Vapaatalo, H., Nitric oxide in inflammation and immune response. Ann Med 1995,27 (3), 359-67.
4. Ignarro, L. J.; Buga, G. M.; Wood, K. S.; Byrns, R. E.; Chaudhuri, G., Endothelium-derived relaxing factor produced and released from artery and vein is nitric oxide.
Proc Natl Acad Sci U S A 1987,84 (24), 9265-9.
5. Rand, M. J.; Li, C. G., Nitric oxide as a neurotransmitter in peripheral nerves: nature of transmitter and mechanism of transmission. Annu Rev Physiol 1995,57, 659-82.
6. Habib, S.; Ali, A., Biochemistry of nitric oxide. Indian J Clin Biochem 2011,26 (1), 3-17.
7. Davies, I. R.; Zhang, X., Nitric oxide selective electrodes. Methods Enzymol 2008, 436, 63-95.
8. Privett, B. J.; Shin, J. H.; Schoenfisch, M. H., Electrochemical nitric oxide sensors for physiological measurements. Chem Soc Rev 2010,39 (6), 1925-35.
9. Griess, P., On a New Series of Bodies in Which Nitrogen is Substituted for Hydrogen. Phil. Trans. R. Soc. Lond. 1864,154.
11.Hetrick, E. M.; Schoenfisch, M. H., Analytical chemistry of nitric oxide. Annu Rev Anal Chem (Palo Alto Calif) 2009,2, 409-33.
12.Malinski, T.; Taha, Z.; Grunfeld, S.; Patton, S.; Kapturczak, M.; Tomboulian, P., Diffusion of nitric oxide in the aorta wall monitored in situ by porphyrinic microsensors. Biochem Biophys Res Commun 1993,193 (3), 1076-82.
13.Zacharia, I. G.; Deen, W. M., Diffusivity and solubility of nitric oxide in water and saline. Ann Biomed Eng 2005,33 (2), 214-22.
14.Brunet, A.; Pailleret, A.; Devynck, M. A.; Devynck, J.; Bedioui, F., Electrochemical sensing of nitric oxide for biological systems: methodological approach and new insights in examining interfering compounds. Talanta 2003,61 (1), 53-9.
15.Bartberger, M. D.; Liu, W.; Ford, E.; Miranda, K. M.; Switzer, C.; Fukuto, J. M.; Farmer, P. J.; Wink, D. A.; Houk, K. N., The reduction potential of nitric oxide (NO) and its importance to NO biochemistry. Proc Natl Acad Sci U S A 2002,99 (17), 10958-63.
16.Venton, B. J.; Michael, D. J.; Wightman, R. M., Correlation of local changes in extracellular oxygen and pH that accompany dopaminergic terminal activity in the rat caudate-putamen. J Neurochem 2003,84 (2), 373-81.
17.Robinson, D. L.; Hermans, A.; Seipel, A. T.; Wightman, R. M., Monitoring rapid chemical communication in the brain. Chem Rev 2008,108 (7), 2554-84.
18.Amatore, C.; Arbault, S.; Bouton, C.; Drapier, J. C.; Ghandour, H.; Koh, A. C., Real-time amperometric analysis of reactive oxygen and nitrogen species released by single immunostimulated macrophages. Chembiochem 2008,9 (9), 1472-80.
CHAPTER 3
Investigating the Effect of L-DOPA Treatment at Microelectrodes with Fast-Scan Cyclic Voltammetry in Brain Slice Tissue
3.1 Introduction
PD is a neurodegenerative disease in which DA neurons that project from the SN to
the dorsal striatum selectively degenerate.1,2 Clinical manifestations of this disease are
characterized by motor deficits such as rigidity, resting tremor, bradykinesia and akinesia.3,4
Typically, symptoms do not present until 60-85% of DA neurons are destroyed.5 There is
currently no cure for PD and the treatment for PD has remained unchanged since the 1960s.6
The goal of PD pharmacotherapy is aimed at decreasing the DA deficit by restoring
dopaminergic tone through increasing the available L-DOPA , the precursor to DA. Despite
the effectiveness of L-DOPA therapy to treat symptoms of PD, serious complications are
associated with prolonged treatment with L-DOPA.7 Thus creating the need to understand
the molecular mechanisms underlying DA potentiation with L-DOPA therapy in PD.
The effects of L-DOPA on DA release have been studied in both intact and
Parkinsonian-like rodent models using doses of L-DOPA ranging from 6 mg·kg-1 to 250
mg·kg-1 and have demonstrated that L-DOPA can significantly increase DA levels in the
brain .8,9,10,11,12 Furthermore, significant increases in electrically-evoked DA release have
been elicited in single cells and brain slice studies with concentrations of L-DOPA ranging
from 60-100 μM.13,14,15 This work aims to investigate the effect of L-DOPA on DA
dynamics at a more clinically relevant dose of L-DOPA in a rat brain slice. Brain slice
since many biological functions are preserved in the brain slice.16 Specifically, striatal brain
slices preserve the terminals of neurons originating in the SN, and these can be
pharmacologically manipulated with ease, and without the confounding effects of afferent
projections to the region. The rates of DA release and reuptake can be quantified by
comparing data collected in response to an electrical stimulation using the electrochemical
form of the Michaelis-Menten equation. This model is well characterized and takes
advantage of the unparalleled temporal and spatial resolution of FSCV to quantify the
maximum DA release and the rate of its reuptake into the presynaptic terminal by way of the
DAT. 11,12,17 The electrochemical form of the Michaelis-Menten equation is presented in
equation 3.1.
(3.1)
DA release is a function of the DA evoked per stimulus pulse ([DA] p) and the frequency (f) at which the stimulus is delivered. Reuptake is defined in the second term of the equation.
Vmax is the maximum reuptake rate of DA achieved by the DAT. Km is the Michaelis
constant; a measure of the affinity of DA for the DAT, the value of Km in the dorsal striatum
is accepted to be 0.16 μM.18, 19 The instantaneous [DA] is found by determining the
difference between release and reuptake. The model is capable of predicting changes in Vmax
and Km following pharmacological manipulation.20 Changes in Vmax and Km will
DA neurons in the brain fire in both tonic and phasic modes.21 Tonic DA firing occurs
at frequencies less than 20 Hz and is constant over longer periods of time. Phasic DA firing,
or burst firing, occurs at greater than 20 Hz. Phasic firing events elicit prominent DA
‘transients’ in the striatum of intact rats.22
The burst firing of DA neurons is highly
implicated in motivated behavior, and in well-trained animals striatal DA transients occur
time-locked to the delivery of cues that predict reward availability.23, 24, 25 Thus, there is
broad interest in understanding phasic DA firing because these events, and the DA that is
released, may be a target in pharmacotherapies for drug abuse and addiction. This work
examined the effects of L-DOPA on the dynamics of DA released in response to single pulse
Understanding the parameters that govern the rates of DA release and reuptake in response
to L-DOPA treatment in this control group will provide a framework enabling us to interpret
the effects of this drug on Parkinsonian animals with compromised DA systems.
3.2 Materials and Methods 3.2.1 Chemicals
All chemicals were purchased from Sigma-Aldrich (Milwaukee, WI) and used as
received unless otherwise noted. Phosphate buffered saline (PBS) solution adjusted to pH
7.40 was used in all flow injection analysis experiments. Aqueous solutions were prepared
using doubly distilled deionized water (Milli-Q Millipore, Billerica, MA).
3.2.2 Electrode Fabrication
Carbon-fiber microelectrodes were constructed in house. A single T-650 carbon fiber
(Cytec Industries, West Patterson, NJ), 7 μm in diameter, is aspirated through a 0.4 mm inner
diameter borosilicate glass capillary (A-M systems, Inc., Sequim, WA) and tapered with a
heat puller (Narishige, Japan) to create a tight seal around the exposed carbon fiber. Each
electrode was then cut to approximately 100 μm under a microscope (Zeiss Primostar) using
a surgical scalpel. Electrodes were then inspected for cracks in the seal and for the
appropriate length. A metal lead coated in conductive silver paint (GC Electronics, Silver
Print II, Rockford, IL) was then inserted into the electrode and secured with heat shrink
tubing.
3.2.3 Data Acquisition