Performance of Different Statistical
Techniques on Indian Administrative Data by
Using GeoDa
Prof.Dr.P.K.Srimani1, K.Balaji2
Former Chairman, R&D Division, B.U., DSI, Bangalore, India1
Research Scholar, Rayalaseema University, Kurnool, Andhra Pradesh, India2
ABSTRACT: This paper deals with the different statistical functionality of Indian administrative data by using GEODA tool. Spatial mining is an emerging interdisciplinary research area that mainly felicitates to take effective decisions with regard to the development of India in the taluk levels. The data comprises 2340 instances and 14 attributes. The results provides us with a natural path through an empirical data analysis and geovisualization moving on to exploration, spatial autocorrelation analysis.
KEYWORDS: Spatial data mining, clustering, geovisualization, spatial autocorrelation, Moran statistics.
I. INTRODUCTION
Spatial Data Mining is the process of discovering interesting and previously unknown, but potentially useful patterns from large spatial datasets [1]. Extracting interesting and useful patterns from spatial datasets is more difficult than extracting the corresponding patterns from traditional numeric and categorical data due to the complexity of spatial data types, spatial relationships, and spatial autocorrelation.
Spatial databases reside terabytes of spatial data that may be obtained from topographic maps, aerial photos, satellite images, medical equipment’s, laser scanners, video cameras among others in public and private organizations which also access several databases comprising census, economic, security, and statistical information for enterprise business processes[2]. It is costly and often unrealistic for users to examine spatial data in detail and search for meaningful patterns or relationships among data. Spatial data mining (SDM) aims to automate such a knowledge discovery process in large databases along with visual exploration techniques for correct communication.
Voluminous geographic data have been and continue to be, collected with modern data acquisition techniques such as Global Positioning Systems (GPS), high-resolution remote sensing, location-aware services and surveys and internet-based volunteered geographic information [3]. There is an urgent need for effective and efficient methods to extract unknown and unexpected information from spatial data sets of unprecedentedly large size, high dimensionality and complexity. To address these challenges, spatial data mining and geographic knowledge discovery has emerged as an active research field, focusing on the development of theory, methodology and practice for the extraction of useful information and knowledge from massive and complex spatial databases.
relations since the neighbours of many objects have to be investigated in a single run of a typical algorithm. Thus, providing general concepts for neighbourhood relations as well as an efficient implementation of these concepts will allow a tight integration of spatial knowledge discovery algorithms with a spatial database management system. This will speed-up both, the development and the execution of spatial KDD algorithms.
Related Work
No doubt most of the related works have used Spatial Data Mining Techniques but their objectives and analysis are different. Some of the recent works are from [2], [3], [6], [7], [10], [12], and [14]
II. SPATIAL DATA MINING TECHNIQUES
Spatial clustering is a process of grouping a set of spatial objects into clusters so that objects within a cluster have high similarity in comparison to one another, but are dissimilar to objects in other clusters. For example, clustering is used to determine the “hot spots” in crime analysis and disease tracking. Hot spot analysis is the process of finding unusually dense event clusters across time and space. Many criminal justice agencies are exploring the benefits provided by computer technologies to identify crime hot spots in order to take preventive strategies such as deploying saturation patrols in hot spot areas. Spatial clustering can be applied to group similar spatial objects together; the implicit 10 assumption is that patterns in space tend to be grouped rather than randomly located. However, the statistical significance of spatial clusters should be measured by testing the assumption in the data. The test is critical before proceeding with any serious clustering analyses [5].
The goal of cluster analysis is to partition a set of spatial objects into clusters so that objects within a cluster have similarity in comparison to one another, but are dissimilar to objects in other clusters. The application range of cluster analysis is enormous. There is now a well-established body of literature on application of cluster analysis in the context of spatial research and environmental research. For example, the authors provides an overview of studies about using cluster analysis to group cities and towns [6] [7].
III. METHODOLOGY
The present work employs the following statistics components for the data set considered.
GeoDa [8] a free software program intended to serve as a user friendly and graphical introduction to spatial analysis
for nongeographic information systems (GIS) specialists. It includes functionality ranging from simple mapping to
exploratory data analysis, the visualization of global and local spatial autocorrelation, and spatial regression. A key feature of GeoDa is an interactive environment that combines maps with statistical graphics, using the technology of dynamically linked windows.GeoDa[9] is the latest incarnation of a collection of software tools designed to implement techniques for exploratory spatial data analysis (ESDA) on lattice data. It is intended to provide a user friendly and graphical interface to methods of descriptive spatial data analysis, such as autocorrelation statistics and indicators of spatial outliers.
lag of the variable on the vertical axis and the original variable on the horizontal axis.
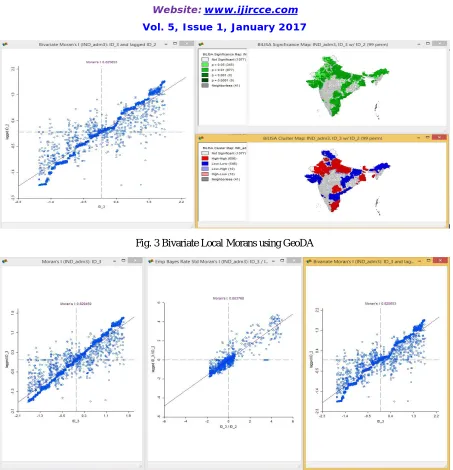
A bivariate Moran’s I is scatter plot with the spatial lag of the first variable on the vertical axis and the second variable on the horizontal axis. Both variables are standardized internally (such that their mean is zero and variance one), and the spatial lag operation is applied to the standardized variables.
IV. DATA SET DESCRIPTION
Geographic Information System(GIS) has become an important tool for managing, analysing and decision making, by seamlessly combining both spatial and non-spatial data, promising to enhance the delivery of public goods and services to citizens not only by improving the processes and management of government, but also by redefining the traditional concepts of information handling [10]. In India, a vast volume of spatial data sets have been generated through GIS projects undertaken by several departments and agencies, hence the key challenge is to integrate and coordinate these varied and disparate efforts to build a GIS structure for the state as a whole.
The data set used in the present investigation for our example will focus on the Indian administrative data sets. The description is as follows:
% Data on Indian Administrative Area. % no of instances = 2340
% no of attributes = 14
V. EXPERIMENTS AND RESULTS
This section contains the results of the experiments conducted on the Indian administrative data sets mentioned earlier. This data set consists of 2340 instances with 14 attributes. As mentioned earlier, the main objective of the present analysis is to predict different statistical techniques to take effective decisions.
Figure 1 and 2 represent the different types of maps for the given data:
In a quantile map, the data are sorted and grouped in categories with equal numbers of observations, or quantiles. A standard deviational map groups observations according to where their values fall on a standardized range, expressed as standard deviational units away from the mean. The Standard Deviational Map creates a choropleth map with the categories corresponding to multiples of standard deviational units. A Percentile map is also a special case of a quantile map. In this case, no additional categories are created, but the categories are grouped to accentuate the extreme values.
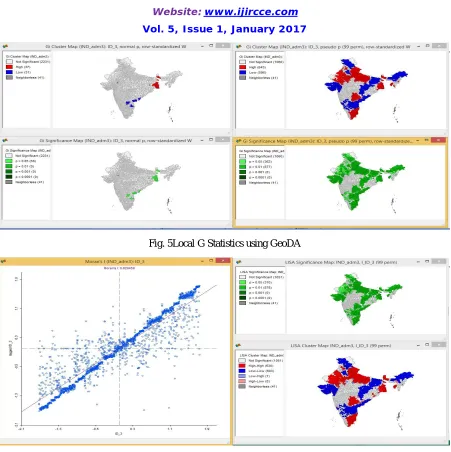
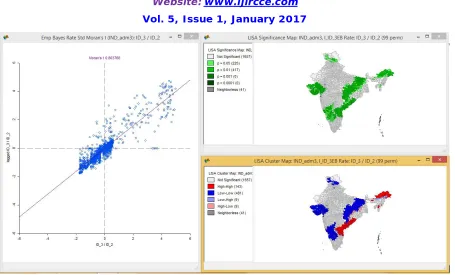
Figure 3,4,5,6 and 7 represents the following statistical results for the given data. Local spatial autocorrelation analysis is based on the Local Moran LISA statistics. This yields a measure of spatial autocorrelation for each individual location. Both Univariate LISA as well as Multivariate LISA are included in GeoDa. The latter is based on the same principle as the Bivariate Moran’s I, but is localized. In addition, the LISA can be computed for EB Standardized Rates.
Fig. 1 Classification of different MAPs using GeoDA
Fig. 3 Bivariate Local Morans using GeoDA
Fig. 5Local G Statistics using GeoDA
Fig. 7 Local Morans with EB rate using GeoDA
VI. CONCLUSION
In this paper, experiments on Indian administrative data set are conducted to study the behaviour of the different GeoDa functionalities. The data set comprises 2340 instances with 14 attributes. The raw data is obtained from the data on Indian Administrative Area and the results obtained are discussed in detail. These results provide an excellent platform for making effective decisions. In developing country like India, by using the above results we can do implementation and monitoring of national and regional development strategies in state, district and taluk level. All the above results are being promoted and sponsored by public administrations because geographic information is a basic resource for their operational work.
ACKNOWLEDGEMENT
One of the authors Mr.K.Balaji acknowledges Rayalaseema University, Kurnool, Andra Pradesh, India and Surana College PG Departments, Bangalore, Karnataka for providing the facilities for carrying out the research work.
REFERENCES
[1] Shashi Shekhar and Pusheng Zhang, “Data Mining and Knowledge Handbook” , Chapter 3, pg 833 – 851, 2005.
[2] Abdulvahit Torun & Sebnem Dizgun, “Revealing spatial patterens through spatial data mining and visual exploration in temporal data”, XXII
International Cartographic Conference, Augest 2007.
[3] Jeremy Mennis and Diansheng Guo, “Spatial mining and geographic knowledge discovery – an introduction", Computers, Environment and
urban systems, Volume 33, Issue 6, November 2009.
[4] Martin Ester et.al, “ Knowledge discovery in spatial databases”, Insititue for computer science, University of Munich, 1999.
[5] Krzysztof Koperski and Jiawei Hun, “ Discovery of Spatial association rules in geographic information database”, Proceddings of the
4thinternational symposium on advances in spatial databases, London, 1995.
[6] Behnisch, “ Urban Data Mining” . Doctoral thesis, Karlsruhe, 2007
[7] Behnisch, “ Spatial similarities in urbanisation and regional diversity” EnviroInfo, 2008
[9] Luc Anselin, ”GeoDa 0.9 user’s guide”, Centrefor spatially integrated social science, Department of Agricultural and Consumer Economics, University of Illinois, 2003.
[10] Jayanthi et al, “ Decentralized governance through GIS- A case study for Cuddalore District of Tamilnadu”, State planning commission report.
[11] Anselin,”GeoDa 0.95i Release Notes”, Spatial Analysis Laboratory,Department of Agricultural and Consumer Economics, University
ofIllinois.
[12] Ahamed Shafeeq and Binu,”Spatial Patterns of Crimes in India using DataMining Techniques”, Intennational Journal of Engineering and
Innovative Technology, Volume 3, Issue 11, May 2014.
[13] Shashi Shekhar et al,” Trends in Spatial Data Mining”, Department of Computer Science and Engineering, University of Minnesota, 2004.
[14] Pui-Jan Tsail,” Spatial autocorrelation analysis of 13 leading malignant neoplasms in Taiwan: a comparison between the 1995-1998 and