ISOLATION OF PRE-ADAPTIVE MUTANTS I N BACTERIA BY SIB SELECTION1
L. L. CAVALLI-SFORZA’ AND JOSHUA LEDERBERG
Department of Genetics, University of Wisconsin, Madison, Wisconsin and Istituto Sieroterapico Milanese “Serafino Belfanti”, Milan
Received November 25, 1955
H E ROLE of antibiotics in provoking the development of resistant mutants
T
of bacteria has been repeatedly discussed (CAVALLI 1952; Society of General Microbiology Symposium 1953; CAVALLI and LEDERBERG 1953; BRYSON and SZYBALSKI 1955; SEVAG, REID and REYNOLDS 1955). The two principal conceptions may be labelled the pre- and post-adaptation theories, respectively, according to whether the adaptive hereditary alteration occurs in individual cells prior to their contact with the drug, or in consequence of it. One basis of decision has been the isolation of resistant mutants by indirect (sib clone) selection (LEDERBERG and LEDERBERC 1952). The over-all result of this method is the isolation of lines of re- sistant mutants that have never been exposed to the drug in question, and are therefore indisputably preadaptive. This method, which depends on a technique of replica plating with a velvet sheet from one agar plate to another, gives a clear-cut qualitative result but is inherently not quantitative, so that failures are difficult to assess. In this paper, a more general procedure for indirect selection that allows of quantitative control will be described in its application to resistance to strepto- mycin and chloramphenicol, respectively, in Escherichia coli.INDIRECT SELECTION I N LIQUID MEDIA : LIMIT SAMPLING
The principal difficulty in assessing mechanisms of drug resistance is the rarity of resistant cells. On the preadaptation theory, a population of bacteria may already contain, say one resistant per million cells. Short of individual tests on a million isolates, on one hand, and the direct but ambiguous use of the antibiotic as a se- lective agent on large populations, on the other, how can these rare resistant cells (or clones from them) be extracted? The method to be described depends on the indivisibility of single cells in progressively smaller samples of these populations.
Consider, for example, a population containing lo9 sensitive and lo3 resistant organisms per ml. A 0.1 ml sample will contain, on the average, 108 sensitives and 100 resistants. But a lW4 ml sample will contain lo5 sensitives and 0.1 resistant cells. What is 0.1 cell? The statement refers, of course, to the expectation that of ten samples, nine will contain no resistants, the tenth will contain one. I n this tenth sample, however, the ratio of resistant to sensitive will have been raised from 1 :
lo6
to 1:105, a tenfold enrichment. If the resistant cells can hold their own in mixed1 Paper No. 592 of the Department of Genetics. The work at Madison has been supported in
part by grants (C-2157) from the National Cancer Institute, Public Health Service, and from the Research Committee, Graduate School, University of Wisconsin, with funds provided by the Wis- consin Alumni Research Foundation.
368 L. L. CAVALLI-SFORZA AND JOSHUA LEDERBERG
culture with sensitives, such a sample can be inoculated in fresh broth, and give rise to a new population with lo9 sensitive and lo4 resistants. The same enrichment procedure can then be reiterated until the resistant clone is obtained in pure culture, in six calculated cycles. A t each stage, ten samples must be taken that have an ex- pectation of 0.1 resistant cell each; the one which actually contains it is identified retrospectively by assays on samples of each culture. These assays further serve to guide the practice of the next cycle.
For a quantitative treatment, consider an initial culture with
N o
cells of which Ro are resistant, giving a ratio ro = Ro/No. If samples of size q are taken they will contain m = qR0 resistants, and qNo = m/ro total cells. If the sample is then dis- tributed among n tubes of fresh medium, each tube will receive m/nr, cells, and, ifm
<<
n, either zero or one resistant. In the latter tubes, the proportion of resistant cells in the inoculum will be 1/- = nro/m = r1 = Rl/N1.If
the ratio of resistant cells remains unaltered during growth, the final culture will have been enriched by a factor E = rl/ro = n/m.However, if the ratio is altered owing to differential growth, the resistant ordi- narily being slower, the effective enrichment E(t) will be a function of the amount by which the inoculum is permitted to grow. If we take t as the number of e-fold increases of the sensitive cells, k as the relative growth rate of the resistants, and
RI = 1, the sensitives will grow as (NI
-
l)et, and the resistants as ekt. Thus rl(t) =R ( t ) / N ( t ) will be given by
m
nro
and approximately, if Er0
<<
1 and rl(t)<<
1,(2)
E(t)
= Eet(”l)which approaches zero asymptotically with increasing t. From (2) also, E(t)
5
1 and enrichment becomes impoverishment after t = logE/(1
-k).
It is therefore desirable, or even essential, to limit the number of generations as much as con- venien t.In the above discussion, we have taken
RI
as either zero or one; actually bothR1 and m = qRo follow the Poisson series and may take any integral value. The sample with expectation m might contain no resistants a t all with a probability
e-” = e - v o N o
,
so that none of the tubes would be “positive” (i.e., no tube will havehad a t least one resistant in the inoculum) and the enrichment cycle would fail entirely. For this reason, the positive tube of each cycle should be saved until the next cycle has been successfully completed.
PRE-ADAPTIVE MUTANTS I N BACTERIA 369
TABLE 1
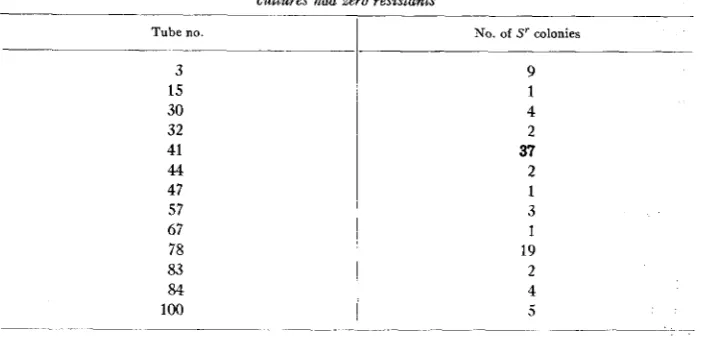
Distribution of resistant mutants in samples of 100 cultures. I n addition to the numbers shown, 87 cultures had zero resistants
Tube no.
I
No. of S‘ colonies- 3 15 30 32
41
44
47
57 67 78 83
84
100
- _ _ _ _ _ _ _ _ _ _
9 1
4
2
37 2
1 3 1 19 2
4
5
~ _ _ _ _ _ _ _ -
while in small samples R follows the Poisson series, so that a calculable fraction of samples will have a ratio Ro/.Yo which exceeds any stated value. The procedure is thus applicable, in principle, for any value of m but is most efficient for m
<
n.The calculated enrichment E can also be adjusted to minimize the total number of tubes required to achieve complete enrichment, R = N , which will take i cycles where E $ = l/r0. The total number of tubes
Ei
will then be minimal for E N eand
i
N log l/yo. As a compromise between economy of time and of material, E waschosen around 10 in the experiments reported here.
As m, 11 can be established in advance, and k can be measured, it is possible to estimate with fair accuracy the enrichment expected and compare it with the en- richment observed; the agreement between the two values will supply a test that the resistant mutants are actually present in the right number in the culture un- treated with the antibiotic, and thus that all of the resistant mutants recovered by direct assay with the drug are spontaneous mutants.
RESISTANCE TO STREPTOMYCIN
Escherichia coli W-1802 (a stock from the K-12 strain) was used for the experi- ment. A single-colony culture was used for the inoculation of 100 tubes containing
7
ml each of penassay broth, all tubes being seeded with about 100 cells. At the end of incubation half of each culture was plated on nutrient agar containing 100 pg/ml of streptomycin, while the remaining half was stored in the refrigerator.The plates from 87 tubes showed no growth on streptomycin, while the counts of streptomycin resistant organisms from the remaining 13 tubes were as given in table 1.
The “best” culture (i.e., with maximum y o ) (No. 41) contained 37 resistants in
3 70 L. L. CAVALLI-SFOKZA AXD JOSHUA LEDERBEKG
of broth. From this dilution ten tubes were made, each containing 10 ml of broth, and incubated. To reduce the chance that the enrichment cycle would fail, another series of 10 tubes with 10 ml broth was prepared with an 0.2 ml sample from culture 41, thus expected to contain two resistant organisms.
After the 20 tubes were grown to saturation a sample was taken from each and plated on streptomycin agar. The estimates of resistant organisms per ml were as follows:
First enrichment from culture 41
Sample seeded
0.1 ml 0.2 ml
-
No. of resistant organisms per ml in each of the ten cultures
_ _
0 4 0 0 0 0 0 0 0 0
0 0 3 3 9 11 3 6 0 0 6 0
It is d&cult to judge whether the second culture of the first series and the fourth, fifth, ninth culture of the second series contain the same mutant as the original culture or new mutants. It is very likely instead that the third and sixth culture of the second series contain the same mutant as in the original, enriched 3.3 and
3.5 times respectively by the procedure. The expected enrichment for
k
= 1 is 5 X in the second series, there being n = 10 tubes and m = 2 resistant organisms in the inoculum distributed into the ten tubes.As a control, one of the original 100 cultures (No. 42) which showed no resistant organisms in the sample plated on streptomycin was treated in parallel to culture 41 and exactly in the same way. The results were:
0.1 ml 0.2 ml
Examination of culture 42 in parallel with culture 41
0 0 0 0 0 0 0 0 0 2
0 0 0 0 0 0 0 0 0 0
Sample seeded
1
No. of resistant organisms per ml in each of the ten culturesI n the series from culture 42 no enrichment was expected, there being no re- sistant mutants to be enriched upon, and none is indeed found (except “background” mutants, e.g. in the tenth culture of the first series).
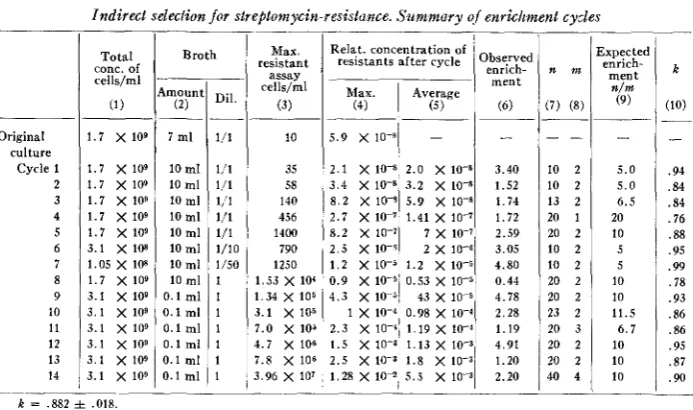
The total count in the conditions employed was 1.7 X lo9 bacteria per ml. At the beginning there were in the best culture 10 resistants per ml, or a ratio ro = 6 X lW9. After the first cycle of enrichment the concentration of resistants had increased to a maximum of 21 X lO-9 and the best culture was chosen for a further enrichment cycle. It was thus possible to reach, by a succession of fourteen cycles conducted in a way identical or very similar to the first one just described, a concentration of
resistant organisms such that plating of the culture on nutrient agar and direct scoring for resistance of the colonies thus obtained permitted a line made entirely of streptomycin-resistant cells to be indirectly selected.
PRE-ADAPTIVE MUTAKTS I N BACTERIA 371
5.9 x 10⁻⁹ 2.1 X 10V 3.4 X
8 . 2 X 10’
TABLE 2
Indirect selection f o r streptomycin-resistance. Summary qf enrichment cycles
-
- - - - -
2.0 X 10⁻⁸ 3.40 10 2 5.0 .94 3.2 X 1.52 10 2 5.0 .84 5.9 X 10” 1.74 13 2 6 . 5 .84
Broth Max. Relat. concentration of Expected Total resistant resistants after cycle observed
celis”l Max.
1
Averageconc. of enrich- n m k
cells/ml ment
n/m
-____ assay
Amount1 Dil.
(2) (3) (4) (5 1
2.7 x 10⁻⁷ 8.2 x 10⁻⁷ 2.5 x 10⁻⁵
Original culture
Cycle 1 2 3 4 5 6 7 8 9 10 11 12 13 14
1.41 x 10-7
I x 10-7 2 x 10⁻⁶ 1.7 x 10⁹
1.7 x 10⁹ 1.7 x 10⁹ 1.7 x 10⁹ 1.7 x 10⁹ 1.7 x 10⁹ 3.1 X 10s 1.05 x 10⁸ 1.7 X 10⁹ 3.1 X 10⁹ 3 . 1 x 10⁹ 3.1 x 10⁹ 3.1 x 10⁹ 3 . 1 x 10⁹ 3.1 x 10⁹
7 ml
10 ml
10 ml
10 mi
10 ml
10 ml
10 ml
10 ml 10 ml
0.1 ml
0 . 1 ml
0.1 ml
0.1 ml
0.1 ml
0.1 ml
1/1 1,/1 1/1 1,‘l 1/1 1/1 1/10 1/50 1 1 1 1 1 1 1 10 35 58 140 456 1400 790 1250 1.53 x 10⁴ 1.34 x 10³ 3.1 x 10⁵ 7.0 X 10⁵
4.7 X 10⁶ 7.8 X 10⁶ 3.96 x 10⁷
1.72 2.59 3.05 4.80 0.44 4.78 2.28 1.19 4.91 1.20 2.20
20 1 20 2
LO 2 10 2 20 2 20 2 23 2 20 3 20 2 20 2 40 4
20 10 5 5 10 10 11.5
6 . 7 10 10 10 .76 .88 .95 .99 .78 .93 .86 .86 .95 .87 .90
k = 882 f 018
size of the culture. The latter method was found more satisfactory. Reconstruction experiments showed in fact that while dilution of the nutrient broth a i t h saline did not decrease proportionately to dilution the final concentration of bacteria a t satura- tion, the disadvantage of the resistant increased a t lower broth concentration. Another simple device that could reduce the number of doublings in the fresh medium, and thus improve the enrichment if k
<
1, might be that of stopping grow-th before saturation. However, it was preferred to use saturation as the endpoint of growth because it was already known that a saturated culture, stored a t 4”C, kept the ratio of the resistant cells to the total unaltered for over a week. Such a stabilization for a t least 24 hours and preferably several days is essential for this kind of experiment, because the enrichment tubes must be stored until they have been assayed for re- sistants and the next enrichment cycle started.The comparison of the enrichment observed (col. 4, table 2) uith that expected,
E = n/m for k = 1 (col. 6, table 2) permits one to calculate, by the use of formula (l), the value of k (the relative growth rate of the resistants) that would explain the observed enrichment rates. k was found to be 0.88 f .02.
Recovery of the resistant line that was selected by indirect selection permitted the value of k thus calculated to be compared vith that obtained directly from recon- struction experiments. Mixtures were made in various initial proportions of
s8
ands’ cells, and the ratio between the two types of cells were measured a t the end of growth. An average of two experiments gave k = 0.856 f 0.013, in good agreement with the value obtained from the indirect selection experiment. In reconstruction experiments with mixtures of sensitive and streptomycin resistant mutants of
E. coli, CEPPELLINI (1954) had also obtained a closely similar value of k .
372 L. L. CAVALLI-SFORZA AND JOSHUA LEDERBERG
trations of resistants after each cycle are given in column 3 of table 2. Observed enrichment (col. 4) is calculated as the ratio of the average relative concentration of resistant mutants after one cycle, and the concentration of resistants in the best tube before the cycle, the best tube having of course been employed for continuing selection.
Enrichment cycles were missed three times, i.e. no resistant cell showed up in the tubes after dilution. Thus, altogether seventeen cycles were made; the third, eighth and eleventh cycles had to be repeated. As already stated the probability of “miss- ing” a cycle is e& = 0.37, if one resistant cell is seeded; ec2 = 0.14 if two resistant cells are seeded; ec3 = 0.05 if both series with 1 and 2 resistant cells are employed, as in most cycles of the present experiment. Failures were 3/17, i.e. slightly more frequent than expected, but not significantly so.
At the end of the fourteenth cycle, the relative concentration of streptomycin re- sistant cells was estimated to be 1.28% in the best tube as shown by the assay on streptomycin agar. The culture concerned was plated on nutrient agar (without streptomycin) and 149 colonies were subcultured on nutrient agar and tested indi- vidually for streptomycin resistance by planting them on agar with and without the drug. Two colonies (1.34 %) were resistant.
One resistant isolate was restreaked on plain agar, then inoculated into penassay broth from which twenty serial passages of .001 ml in 10 ml were made in the course of one month. These passages entailed a cumulative total of about 260 generations. The twentieth passage culture was then plated out on agar with and without strepto- mycin, giving the following assays: on plain agar, 4.1 f .1 X lo9; on agar with 200 pg/ml streptomycin, 4.3 f .1 X lo9; on agar with lo00 wg/ml streptomycin, 4.2 f .2 X lo9 per ml. In addition several hundred colonies on the plain agar plates were tested by replica plating to streptomycin agar without any sensitive reversions being detected. This indirectly selected resistant clone, which has never been ex- posed to streptomycin, may be concluded to be stably and completely resistant to streptomycin.
One more fact which was noticed in the present experiment is worth comment. When more than one tube of a series was “positive”, a high variability of the num- ber of resistant cells was almost always present among tubes. It must be remembered that the number of resistant cells in one of these tubes represents the total progeny of (usually) one resistant cell in a fixed time, i.e. the time necessary for the majority of the cells, the sensitive ones, to reach saturation.
This variability may reflect the variability in lag of individual cells and perhaps the variability in the time of individual divisions (KENDALL 1953). This variability is of such a size, that it may occasionally reverse enrichment into impoverishment, as has happened a t the 8th cycle.
HERITABILITY O F VARIAXCE OF STREPTOMYCIN RESISTANTS
PRE-ADAPTIVE MUTANTS I N BACTERIA 373
samples of one ml each were reinoculated into
7
ml fresh penassay broth, both from culture 41 (which had a calculated level of about 10 resistants per ml) and 42 (which had none). Reassays of the whole cultures gave the following results:From culture 41: 135, 142, 181, 123, 177, 111, 138, 149, 140, 144 From culture 42: 0, 0, 8, 2, 0, 0, 0, 1, 0, 1
These results should be considered together with those of more dilute samples from the same cultures, page 370.
If the difference between the original culture 41 and 42 is to be ascribed to the physiological state of the cells, it would then be necessary to assume that this dif- ference is heritable with the further growth of the cells in the absence of the drug.
INDIRECT SELECTION FOR CHLORAMPHENICOL RESISTANCE
Chloramphenicol resistance offers a particular challenge for various reasons. Resistant mutants are found which show only a moderate degree of resistance; only by the cumulation of independent mutations it is possible to reach high degrees of resistance (CAVALLI and MACCACARO 1952). Single resistance steps do not permit complete (i.e. 100%) survival a t the concentrations of drug which are necessary for a complete inhibition of the sensitive parents. The increase of resistance in “training” experiments is therefore almost perfectly gradual, a trend particularly acceptable to advocates of the post-adaptation theory.
AIoreover, the survivorship varies with the medium, time of incubation, amount of background of sensitives, and other conditions. In view of incomplete survival, it has to be assumed that assays on drug agar gave a variable under- estimate of the number of resistant cells. As, for a rapid application of the enrich- ment method here employed, it is essential that limiting dilutions are used, five series of broth tubes (each of n = 10 tubes) were employed, containing respectively
2, 1,
%,W,
resistant cells (as estimated from the assay). Thus, even if the assay estimate were only 12.5% of the true number of resistants, the last series would contain just one resistant. Actually, later tests, which became possible when the in- directly selected resistant line was secured, showed that the estimate from the assay may even be lower than 12.5%.An E . coli stock (from the K-12 line) No. 373 was employed. A single colony culture was used for the inoculation of 0.5 ml broth cultures, 50 in all, 100 cells being seeded in each tube. After saturation, 0.1 ml from each culture was plated on a penassay agar plate containing 18 pg/ml chloramphenicol. The rest of each culture was stored in the refrigerator. Plates were incubated 48 hours, this time being neces- sary for the development of a good fraction of the colonies. At the time and con- centration of cells and drug employed, resistant colonies were mostly of a pin-point size but there was no background growth, which would otherwise make counts dif- ficult. Counts of resistant colonies were:
Chloramphenicol resistance, distribution of resistants
No. of resistant colonies
374 L. L. CAVALLI-SFORZA AND JOSHUA LEDERBERG
Expected no. of positive cultures in each series.. . . .
Number of resistants in chloramphenicol agar plates prepared from each tube
TABLE 3
Number of chloramphenicol resistant organisms in subcultures from culture No. 40, containing originally 230 resistantslml, from which samples were taken expected to contain 2, 1,
$4,
>i, % resistant.Boldface indicates cultures which are believed to Lave been seeded with at least one resistant mutant
2 2 5 2 2 13 10 1 16 4 1 - _ _ _ _
Expected no. of positive cultures in each series
M
7 7
1 4 Number of resistants in chloramphenicol a(
plates prepared from each tube
Yi 14 16 10 4 ~~~ 2 16 7 7 33 9 4 16 1 27 2 Enrichment series 1 15 23 15 2 2 0 49 25 1 131 M 1 62 216 2 1 1 9 10 1 0 Yi 0 18 0 0 0 4 7 29 1 8 0 2 5 1 25 2 0 2 0 24
TABLE 4
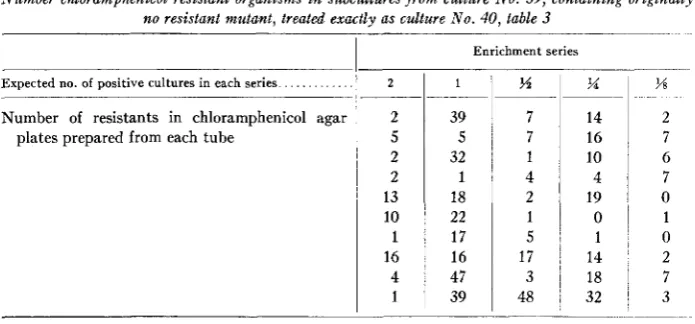
Number chloramphenicol resistant organisms in subcultures from culture No. 39, containing originally no resistant mutant, treated exactly as culture No. 40, table 3
I
Enrichment series1 39 5 32 1 18 22 17 16 47 39 M 2 7 6 7 0 1 0 2 7 3
Culture No. 40 contained the highest number of resistants (23 in 0.1 ml, or r a little less than lo-').
From culture 40 a sample was taken and diluted so that samples of 5 ml of broth would contain each 2, 1,
%,
x,
resistant cells. These numbers will thus represent also the approximate expectations for the numbers of positive cultures in each series. Culture No. 39 which gave no resistant colonies on the drug plate was treated in exactly the same way, as a control. The 5 ml samples were then distributed into ten small test tubes, each receiving thus 0.5 ml of broth. After incubation, 0.1 ml from each culture was spread on 18 pg/ml chloramphenicol agar, while the remain- ing 0.4 ml of each culture were stored in the refrigerator. Counts of resistant colonies after 48 hours on chloramphenicol agar were as given in tables 3 and 4.PRE-ADAPTIVE MUTANTS I N BACTERIA 3
75
Resistants inoculated and expected number of positive cultures Enrichment ratio
Expected number of resistants after enrichment in 0.1 ml of positive cultures from culture 40, table 3.
culture, or new mutants. Assuming that the resistant cells in the original culture (No. 40) were 23 in 0.1 ml of broth, in the same amount of broth after enrichment the following numbers of resistants would be expected in the five series inoculated with culture 40.
2 1
5 10 115 230
Pi
40 520
w
20 460
%
80 1040
%
13 2 6 1 9 0 0 1 0 10
~-
-
If, however, 23 is an underestimate of the resistant cells due to the diffculties of assay mentioned above, the expected numbers of resistants will be overestimated.
Taking 100 to be the maximum number of “new” resistants that may be counted in 0.1 ml, one finds that while no clear enrichments are observed in the first series (with 2 organisms), in the second series (with 1) one culture, and in the third (with
%)
another culture (indicated by boldface, table 3) showing enrichment are avail- able. The limit of 100 resistants is of course arbitrary, but has a t least the advantage that it is not overtaken in the control series (culture 39, table 4) where no enrich- ment is expected.Unless the mutant has a smaller growth rate than the sensitive, it may be argued from the figures observed that 23 was an underestimate, and therefore that the figures of enrichment expected in the calculation above are overestimated. If this is so, the numbers of resistants expected in the first series are not sufficiently high to permit the old clones to be distinguished from the background of new mutants, as indeed seems to have occurred.
Choosing the best of the enrichment cultures, i.e. the third culture of the third series for the second cycle, and diluting it again in broth so as to have 5 ml samples containing each 2, 1,
45,
x,
g
)
resistant cells, and distributing these in 10 small tubes as before, subculture of them and plating on chloramphenicol agar gave the counts reported in table 5.The following facts are worth noting: underestimation of resistants in the plate
M
~ _ _ 2
0 9 5 0 2 4 0 246 136
T‘4BLE 5
Second enrichment cycle, from the culture indicated in table 3 as 216
178 8 18 216 92 248
67 42
Expected number of positive cultures
25 107
814
7 208 161 0 0 Resistants in plates prepared from each of the
ten cultures of the series
Enrichment series
15 3 1 0 10 460 23
4
5 3
376 L. L. CAVALLI-SPORZA AND JOSHUA LEDERBERG
TABLE 6
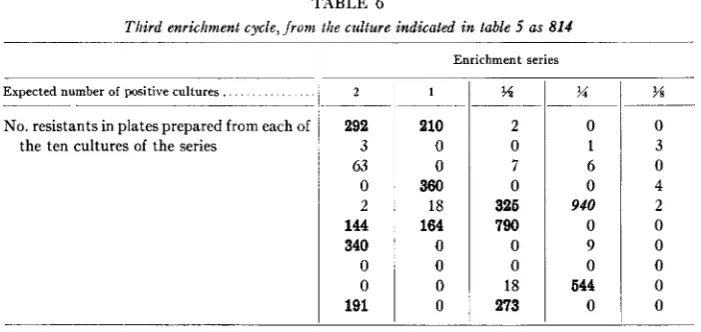
Third enrichment cycle, from the culture indicated i n table 5 as 814
Expected number of positive cultures.
.~
No. resistants in plates prepared from each of the ten cultures of the series
~
2
292 3 63 0 2
144 340
0 0
191
Enrichment series
1
~- -
210
0 0
360 18 164
0 0 0 0
?4
2 0
7 0
326 790 0 0
18
273
%
~
0 1 6 0
940
0 9 0
644 0
w
0 3 0 4 2 0 0 0 0 0
assay is more prominent than before; the variability of counts in parallel positive cultures is remarkably high; enrichments observed are therefore somewhat erratic, but clearly higher than in the previous cycle.
The third cycle, started with the best culture of the second cycle, is also given in detail in table 6 in order to strengthen these points and show that, with increasing enrichment, the positive cultures are more clearly differentiated from those con- taining background mutants.
Altogether, nine cycles were necessary to reach, from the original lo-' concentra- tion, a concentration of 2 % resistants. At this stage, the best culture of the last enrichment cycle was plated on ordinary agar, and 317 colonies subcultured from it; they were then individually tested for resistance a t the standard chloramphenicol concentration. Four colonies were found to be resistant, with a clearcut differentia- tion from the sensitives (see fig. l ) .
Indirect selection having thus been fully achieved, it remains to be seen whether the rate of enrichment corresponds to that expected if all the resistants counted are spontaneous mutants. The incomplete survival of the resistant a t the standard drug concentration interferes with this calculation. The actual survival of the indirectly selected mutant, however, could be estimated directly as soon as the mutant was isolated in pure culture: it proved to be variable from day to day, but constantly dependent on the frequency of sensitives which, if present a t a high concentration, proved to provide some protection to the resistants. A typical experiment with mixtures of sensitives and resistants is given as follows:
Connts on niixtures of resistants and sensitives 2 plates at eucli level
Resistants . .
I
2001
200 200 200No. of plated
Sensitives. . . , . .
Counts on non drug-agar. . . .
'
Chloramphenicol 18 pg/ml agar. . . ~ 34; 70
. . . 106
-
0 ; 9
I
0 ; lPRE-ADAPTIVE MUTANTS IN BACTERIA
loo]* 10
I
indirectly selected resistant
A
mutantitive ent
I
377
I V
f I I I
0 10 20 30 40
pg chloramphenicol / ml
FIGURE 1 .-Survival curves on chloramphenicol agar plates of sensitive parent culture and an indirectly selected resistant mutant.
TABLE 7
Indirect selection jor chloramplrenicol resistance i n E. coli
I
1 1 2
1
31
4I
5Cycle Ratio dilution/ plate assay x2 df
1 2 3 4 5
P No. of positive cultures
Cycle
_ _ _ _
216 1 . 1 f 0 . 8 .8 3 non signif. I
I1
I11 940 3 . 8 f 1 . 1 3 . 8 4 nonsignif.
33.50 21 f 4 . 6 4 . 0 4 non signif.
V 9 . 9 f 2 . 2 0.9 4 nonsignif.
1 . 7 f 0 . 7 1 . 4 4 nonsignif. 814 3 . 0 f 1 . 0 10.6 4 5-270
IX
_ _ _ _ _ _ _ _
_____
34.3 35 50%
~
Column 1: Enrichment cycle. Column 2: No. of “fertile” cultures in each of the five series of 10 tubes, each series being seeded with the number of resistant bacteria indicated a t the top of each subcolumn (estimated by previous plate assay). Column 3: No. of resistant bacteria in 0.1 ml of the best “fertile” culture, i.e. the culture which was found to contain the highest number of re- sistant mutants by plate assay on chloramphenicol agar and was used for the next enrichment cycle. Such a culture belongs to the series indicated by italics in column 2. Column 4: Ratio between dilution assay of resistant mutants and plate assay. Column 5: .%nalysis of the validity of the dilu-
I
Max. no. ofI resistants No. of positive cultures
2 1
% . + j
-..-I
__--
~I ? 1 1 0 0 216 1 . 1 f 0 . 8 .8 3 non signif.
I11 4 3 3 2 0 940 3 . 8 f 1 . 1 3 . 8 4 nonsignif.
I V 1 0 ’ 9 8 ’ 4 0 33.50 21 f 4 . 6 4 . 0 4 non signif. V 9
1
6 3 3 1 10,700 9 . 9 f 2 . 2 0.9 4 nonsignif. 1 1 0 52,750 1 . 7 f 0 . 7 1 . 4 4 nonsignif. 1.68 X lo5 15.4 f 3 . 4 4 . 9 4 nonsignif. 2.19 X 10‘ 3 . 3 f 1 . 0 5 . 5 4 nonsignif. V IVI1
I1 3 1 1 1 1 0 1 2 814 3 . 0 f 1 . 0 10.6 4 5-270
4 . 2 X 10⁶ 3 . 8 f 1 . 1 2 . 4 4 nonsignif.
I
Column 1: Enrichment cycle. Column 2: No. of “fertile” cultures in each of the five series of 10 tubes, each series being seeded with the number of resistant bacteria indicated a t the top of each subcolumn (estimated by previous plate assay). Column 3: No. of resistant bacteria in 0.1 ml of the best “fertile” culture, i.e. the culture which was found to contain the highest number of re- sistant mutants by plate assay on chloramphenicol agar and was used for the next enrichment cycle. Such a culture belongs to the series indicated by italics in column 2. Column 4: Ratio between dilution assay of resistant mutants and plate assay. Column 5: .%nalysis of the validity of the dilu-
P
378 L. L. CAVALLI-SPORZA AND JOSHUA LEDERBERG
A summary of the results obtained in the nine enrichment cycles is given in table
7.
The value given in the 4th column, i.e. the ratio between the resistants found by the test in liquid medium and the resistants, given by the assay on chloramphenicol agar plates may deserve some comment. I t is obtained by considering that the pro- portions of fertile tubes a t the various relative concentrations of 2, 1,%, %, %
constitute, in fact a “dilution assay” of the numbers of resistants in the culture to be enriched.Estimation was carried out by maximum likelihood, and the fifth column (table 7) contains an analysis of the validity of the assay by the calculation of an (approxi- mate) value of
x2
for each cycle. Totalx2
is 34.3 with 35 d.f., showing a good fit.The ratios given in the 4th column of table
7
agree with the previously noted fact that plate counts tend to underestimate the numbers of resistants. The values estimated by dilution assay are more reliable, but unfortunately are subject to high standard errors, as is well known. This makes computation of enrichment a t every step hardly worth while. However, some information can be obtained from the total enrichment observed. In nine enrichment cycles, the concentration of resistant organisms went up from lo-’ to 0.023, i.e. there was a total enrichment, whose logarithm is 5.37 (this figure may, if any, be higher than the real one, being based on the best samples a t every step).The expected enrichment a t every step can be calculated, as before, assuming equal growth rates for normals and mutants, from n/m, where n is the number of tubes into which the sample is distributed and m the number of bacteria seeded, which is given a t the head of the appropriate subcolumn of column 2.
Such a value is, however, the estimate by the previous plate assay, and this, we have seen, is deficient by a factor given in column 4. The number m can therefore be obtained by multiplying the estimate from plate assay (top of the corresponding subcolumn, column 2) by the corresponding value in the fourth column. The total expected enrichment is obtained by summing the logarithms of the expected en- richments a t each cycle and equals 6.1 f 1.1.
The magnitude of this standard error does not permit a detailed comparison of the total observed and expected enrichment. The latter should be greater than the former if k
<
1; it may therefore be predicted that probably the growth rate of the mutant is slightly smaller than that of the sensitive. In view of counting dif- ficulties of the resistant types in mixtures, no direct examination of the relative growth rates of mutant and parent in mixtures was carried out.A comparison of the relative resistance to chloramphenicol of the normal parent and of the indirectly selected mutant by plate assays is given in figure 1. After 25 daily transfers in broth, with a multiplication factor of lo4 a t every transfer, for a total of 332 generations, there is no variation in resistance.
DISCUSSIOK
PRE-ADAPTIVE MUTANTS IN BACTERIA 3-79
environment varies uncontrollably from one culture tube to the next. The bacteria would then differ in physiological state, and hence in their responses when later confronted with the drug. Experiments in this paper show how this question can be elaborated, by a test of the “heritability” of the variance, when samples from “high” and “low” cultures are regrown in fresh medium. These experiments were not specifically designed for the purpose, but as far as they go, they agree precisely with the expectation that “high” cultures already contain many stably resistant cells and “low” cultures do not. To give the obtained result that inocula from “high” cultures generate further “high” cultures, the resistance would have to be heritable in a new set of culture tubes, in conflict with the supposition of purely physiological variability. Whether physiological accidents in the culture tubes of plain broth ultimately cause individual mutational events is not in question here; the issue is whether such variations arise and persist independently of the drug.
The replica-plating and indirect selection procedure has provided still more direct evidence of preadaptation, as drug-resistant mutants can be isolated that have not experienced the drug (LEDERBERG and LEDERBERG 1952; BRYSON and SZYBALSKI 1955). However, certain precautions are required for the correct interpretation of negative results. For example, DEAN and HINSHELWOOD (1953) report having prepared plates of synthetic medium carrying 2 X lo7 single colonies (sic) of Bad. Zactis aerogenes. The plates were then replicated in two passages to chloramphenicol agar, and “the congruent site on the corresponding non-drug plate (about five colonies) was picked off”. Needless to say, the further experience with this isolate gave no evidence of the presence of a mutant clone: the limit of resolution of replica plating is perhaps 0.1% of the area of a plate, not 5/2 X lo’ after two passages. These authors, and LAM and SEVAG (1955) have also overlooked the occurrence of mutations during the growth of colonies which had been shown to contain resistant cells by replica plating. As with other populations of bacteria, the colony may con- tain resistant cells in only very small proportions, as GOLDSTEIN, MAGASANIK and UMBARGER (1955) have explicitly shown with the same material. The method of indirect selection in liquid medium described in the present paper is somewhat less liable to these troubles, as it is possible to distinguish small and large clones, which are not readily distinguished in replica platings.
Unlike replica plating, limit sampling is subject to precise quantitative formula- tion, though all the subtleties of population dynamics must be taken into account. The success of the procedure testifies that all of the resistant cells that are counted in the assays are already in the population being tested. The method will, of course, break down in situations, as can be devised, where the selective action of the drug is limited or delayed so that further growth and new mutations may ensue on the test plates. When either method of indirect selection should appear to fail, it should a t least be shown that it is applicable to the recovery of already adapted clones arti- ficially added to the tested populations, if the negative result of indirect selection has to testify against preadaptation.
380 L. L. CAV.4LLI-SFORZA A N D JOSHUA LEDERBERG
drug (as discussed by EAGLE 1955). However, we must exclude from our discussion phenomena of survival or persistence which entail no genetically stable variations in the survivors. For example, DEAN (1955) reports that “cultures prepared from colonies on proflavine plates are no more resistant than a normal organism”. I t is plausible that physiological adaptations are concerned here, and they may also be involved in the biochemical defenses which genetically resistant organisms can raise against antibiotic attack. These are, unfortunately, very obscure and we know very little about whether these defenses are, in a physiological sense, adaptive or constitutive. For the purpose of this discussion, our operational definition of re- sistance is the ability of a cell to survive exposure to the drug which, like the other inherent potentialities of the organism, is defined by the genotype.
SUMMARY
Indirect selection of resistant mutants, i.e. in the absence of the toxic agent or drug can be carried out not only by replica plating but also by a procedure making use of subcultures in liquid media, and choosing the best subcultures by testing samples of them on drug media. A repetition of this process can lead to pure re- sistant lines which have never been in contact with the drug or toxic agent, thus proving the spontaneous origin of resistants by mutation. The procedure can be speeded up considerably by the subdivision of limiting dilutions containing one or few resistant organisms. Although more time-consuming than replica plating, this procedure is more easily amenable to quantitative analysis, to conclude whether resistant mutants obtained by direct selection (in presence of the drug) are all, or in part, the result of spontaneous mutation. Our conclusions from experiments carried out on first step streptomycin and chloramphenicol resistance in Escherichia
coli are in agreement with the hypothesis that all resistant mutants on drug plates have a spontaneous origin. The observed rate of enrichment of resistant mutants in indirect selection has been comparable with that which was expected on the basis of the experimental conditions, and of growth rate differentials between mutant and parent.
LITERATURE CITED
BRYSON, V., and W. SZYBALSKI, 1955 CAVALLI, L. L., 1952
CAVALLI, L. L., and J. LEDERBERG, 1953
CAVALLI, L. L., and G. A. MACCACARO, 1952
CEPPELLINI, R., 1954
DEAN, A. C. R., 1955
DEAN, A. C. R., and C. N. HINSHELWOOD, 1952
Microbial drug resistance. Advances in Genet. 7: 1-46. Genetic analysis of drug-resistance. Bull. W.H.O. 6: 185-206.
Genetics of resistance to bacterial inhibitors. Symposium on Growth Inhibition and Chemotherapy. Rome, pp. 108-142.
Polygenic inheritance of drug-resistance in the bac- terium Escherichia coli. Heredity 6 : 311-331.
Anilisi di un process0 selettivo in popolazioni batteriche. Boll. 1st. Sieroter. Milanese 33: 236-243.
Mechanism of resistance to proflavine in Bacterium lactis aerogenes (Aero- bacter aerogenes), 42-60, i n Sevag, Reid and Reynolds, 1955.
The resistance of B a t . lactis aerogenes to proflavine (2,8-diaminoacridine). I. The applicability of the statistical fluctuation test. Proc. Roy. Soc. London B 139: 236250.
Observations on bacterial adaptation. Society of General Microbiology. Symposium, pp. 1953
PRE-ADAPTIVE MUTANTS IN BACTERIA 381 EAGLE, H., 1955 Challenging problems in antibiotic research. Perspectives and Horizons in Micro-
biology. Edited by S. A. WAKSMAN. Rutgers University Press, pp. 168-178.
GOLDSTEIN, A., B. MAGASANIK, and H. E. UMBARGER, 1955 On the mechanism of development of resistance to streptomycin in Micrococcus pyogenes var. aureus. J. Bacteriol. 70: 620-621. KENDALL, D. G., 1953 Stochastic processes and the growth of bacterial colonies. Symposia Soc.
Exp. Biol. 7: 55-65.
LAM, G. T., AND M. G. SEVAG, 1955 Mechanism of the development of resistance to streptomycin. 11. Biochemical differences of replica colonies. J. Bacteriol. 69: 184-187.
LEDERBERG, J., and E. M. LEDERBERG, 1952 Replica plating and indirect selection of bacterial mutants. J. Bacteriol. 63: 399406.
LURIA, S. E., and M. DELBRUCK, 1943 Mutations of bacteria from virus sensitivity to virus re- sistance. Genetics 28: 491-51 1.
SEVAG, M. G., R. D. REID, and 0. E. REYNOLDS, eds., 1955 Origins of Resistante to Toxic Agents. Academic Press.