ABSTRACT
CASTILLO, GILBERT ALEXANDER. Surface Modifications and Functional Silicate Coatings for Polyesters and Cellulose Esters. (Under the direction of Jan Genzer).
This Ph.D. Dissertation focuses on understanding the phenomena of solvent-induced crystallization of polyesters, modifying polyester surfaces via aqueous transamidation reaction, and deposition of silicate coating onto amidated polyester surfaces and hydrolyzed cellulose ester surfaces to enhance surface functionality. Surface functionalities such as scratch resistance, wettability, and fouling resistance can be imparted onto polyesters surfaces for use in applications like flexible displays, filters, an tissue scaffolds.
Surface Modifications and Functional Silicate Coatings for Polyesters and Cellulose Esters
by
Gilbert Alexander Castillo
A dissertation submitted to the Graduate Faculty of North Carolina State University
in partial fulfillment of the requirements for the degree of
Doctor of Philosophy
Chemical Engineering
Raleigh, North Carolina 2017
APPROVED BY:
_______________________________ _______________________________ Kirill Efimenko, Ph.D. Michael Dickey, Ph.D.
_______________________________ _______________________________ Christopher Gorman, Ph.D. Jason Jenkins, Ph.D.
External Member
DEDICATION
Dedico esta Disertación a mis padres, Santos & Faustina Castillo, quienes han sido mis más ávidos partidarios. No estaría donde estoy ahora sin ellos. Estaré eternamente agradecido por el apoyo incondicional que me han dado a lo largo de mi vida. A mis hermanos, Mariela, Javier, y Cristina, por hacerme reír y siempre poder contar con ellos pase lo que pase. A mis mejores amigos, Brice & Emily Peters, y Tiffany Teske, por su apoyo. No hubiera logrado mi doctorado sin ellos; ellos han estado siempre a mi lado durante los buenos tiempos y los no tan buenos. Finalmente, dedico esta Disertación a la memoria de mis abuelos, Santos Portillo, Natividad Castillo, Lucia Castillo de Portillo, y María Padilla de Castillo.
BIOGRAPHY
Gilbert Alexander Castillo was born in Washington, DC. He attended elementary school in San Miguel, El Salvador and obtained his high school diploma from Benjamin Banneker Academic High School in Washington, DC. Gilbert attended Florida Institute of Technology in Melbourne, FL, where he received a Bachelor of Science in Chemical Engineering in 2011. During his undergraduate career, he became a NASA MUST Scholar, which allowed him the opportunity to do internships at NASA Ames Research Center in Mountain View, CA and NASA Goddard Space Flight Center in Greenbelt, MD.
Gilbert spent a year in Germany between 2011 and 2012 as part of the Congress-Bundestag Youth Exchange for Professionals (CBYX), where he attended the University of Cologne for a semester and did an internship at BASF SE in Ludwigshafen. Throughout the year in Germany, Gilbert had the opportunity to learn the German language and explore the German/European culture.
ACKNOWLEDGMENTS
First and foremost, I want to acknowledge my faculty advisors, Jan Genzer, Kirill Efimenko, and Michael Dickey, for their support, guidance, mentorship, and all of the skills, knowledge, and expertise they have imparted onto me. Also, to the rest of my dissertation committee, Christopher Gorman and Jason Jenkins, for their guidance and support throughout my graduate career. Many thanks to the GEM National Consortium, who in conjunction with Corning, Inc. provided partial financial support for my graduate studies via the GEM fellowship. Additionally, I thank the Eastman Chemical Company for funding my dissertation work.
I want to thank Mark Novak, Lyssa Malvoso, and Aliea Hernberg for planting the seed of research, providing the foundation, and encouraging me to pursue my Ph.D. I have used and sharpened those skills I learned while doing undergraduate research during my college years. Thanks to Rohan Patil, Preeta Datta, and Edwin Walker for all of the fruitful discussions and all of the training they provided. Also, thanks to Yeongun Ko, Matthew Melillo, Shreya Erramilli, Jason Miles, Steven Zboray, Julie Albert, Pandiyarajan Chinnayan Kannan (“Pandi”), Casey Galvin, Russell Schmitz, and Sean Steadley for keeping the lab running, the
TABLE OF CONTENTS
LIST OF TABLES ... viii
LIST OF FIGURES ... ix
CHAPTER 1 - MOTIVATION AND DISSERTATION SYNOPSIS ... 1
1.1. Introduction ... 1
1.2. Surface Properties ... 2
1.2.1. Surface Chemical Composition ... 2
1.2.2. Surface Ionic and Electrostatic Charge ... 5
1.2.3. Surface Energy ... 6
1.2.4. Topography ... 7
1.2.5. Surface Hardness ... 8
1.3 Importance of Polyesters ... 8
1.3.1. Unsaturated Polyesters and Copolyesters ... 9
1.3.2. Thermoplastic Polyester Fibers and Films ... 10
1.3.4. Properties and Morphology of PET ... 11
1.4. Importance of Cellulose Esters ... 12
1.5. Dissertation Synopsis ... 13
CHAPTER 2 - SOLVENT-INDUCED CRYSTALLIZATION OF POLY(ETHYLENE TEREPHTHALATE) ... 17
2.1. Introduction ... 17
2.3. Results and Discussion ... 22
2.4. Conclusions ... 29
CHAPTER 3 - AQUEOUS AMIDATION OF POLY(ETHYLENE TEREPHTHALATE) WITH 3-AMINOPRPYLTRIETHOXYSILANE ... 31
3.1. Introduction ... 31
3.2. Experimental Section ... 34
3.3. Results and Discussion ... 39
3.4. Conclusions ... 52
CHAPTER 4 - DEPOSITION OF SILICATE COATINGS ON POLY(ETHYLENE TEREPHTHALATE) ... 54
4.1. Introduction ... 54
4.2. Experimental Section ... 56
4.3. Results and Discussion ... 61
4.3.1. Characterization of Silicate Films ... 62
4.3.2. Improved Solvent Resistance ... 68
4.3.3. Tunable Wettability ... 70
4.3.4. Anti-fouling Coating ... 71
4.4. Conclusions ... 73
CHAPTER 5 - DEPOSITION OF SILICATE COATINGS ON CELLULOSE TRIACETATE ... 75
5.1. Introduction ... 75
5.3. Results and Discussion ... 78
5.4. Conclusions ... 82
CHAPTER 6 - OUTLOOK ... 83
6.1. Kinetics and Mechanism of Solvent-induced Crystallization ... 83
6.2. Amidation Kinetics of PET Surfaces ... 84
6.3. Smudge Resistant Surfaces ... 85
6.4. Deposition of Silicate Coating onto Polymeric Substrates ... 86
REFERENCES ... 87
APPENDICES ... 99
Appendix 1 - Spin-coating of Thin Films ... 100
Appendix 2 - Supplemental Information for Chapter 3 ... 102
LIST OF TABLES
Table 1.1: Properties of amorphous and crystalline PET42,46. ... 12 Table 2.1: Diffraction pattern of PET’s triclinic crystalline unit51,72,73. ... 21
Table 2.2: Percent transmittance measured with UV/vis at 550 nm wavelength of PET exposed to various solvents at 23 °C and 60 °C for 1 hour. ... 23 Table 3.1: Thickness, surface root-mean-square (RRMS) roughness of virgin PET, PET
treated with APTES, and PET-APTES-mF8H2 ... 44 Table 5.1: Water contact angle of virgin CTA, hydrolyzed CTA, and silicate coating
LIST OF FIGURES
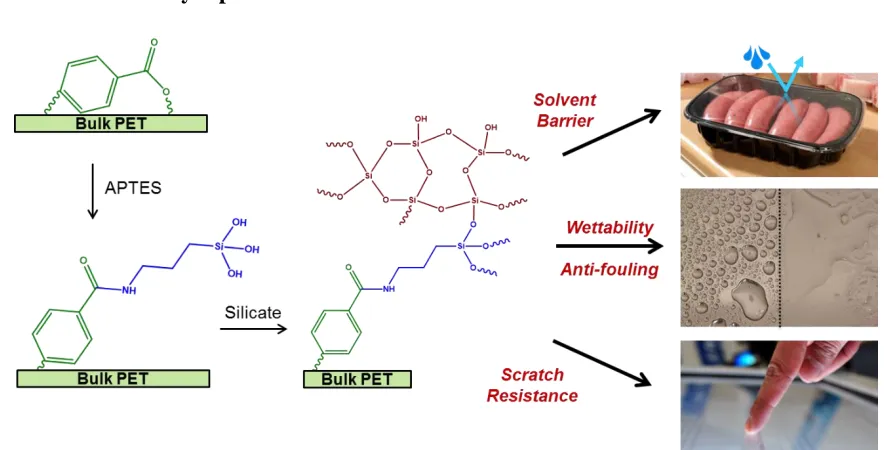
Figure 1.1: Addition-elimination mechanism of nucleophilic acyl substitution11. ... 4 Figure 1.2: Chemical structure of poly(ethylene terephthalate) (PET). ... 9 Figure 1.3: Chemical structure of cellulose acetate. ... 13 Figure 1.4: Schematic of surface functionalization scheme of PET surfaces to improve solvent barrier properties, scratch resistance, tune wettability, and impart anti-fouling
characteristics. ... 13 Figure 1.5: Schematic of surface functionalization of cellulose triacetate (CTA) to improve solvent barrier properties, scratch resistance, and tune wettability. ... 15 Figure 2.1: 5x5 µm AFM images of PET surface annealed at 85 °C for a) 0 min, b) 5 min, c) 10 min, d)15 min, e) 20, and f) 30 min58. ... 18 Figure 2.2: Three layer model of different Tg within polymer thin films and formation of
surface crystal structures upon heating above Tg64,65. ... 19
Figure 2.3: PET films exposed to polar protic solvents for 1 hour at room temperature and at 60 °C. ... 24 Figure 2.4: PET thin films exposed to non-polar solvents for one hour at room temperature and at 60 °C. ... 25
Figure 3.4: AFM image of virgin PET (A, top left), APTES treated PET (B, top right), virgin PET exposed to mF8H2 vapor (C, bottom left), and PET-APTES exposed to mF8H2 vapor (D, bottom right). ... 45 Figure 3.5: High resolution XPS spectra of PET (A & C, black) and PET-APTES (B & D, red) collected at =90° (top panel) and =15° (bottom panel) take-off angles. Spectra
feature the O 1s region (527~539 eV), N 1s region (393~405 eV), C 1s region (281~293 eV), and Si 2p region (95~107 eV). At = 90°, d 9 nm and at = 15°, d 3 nm. ... 48
Figure 3.6: ToF-SIMS image of C7H4O2- (A & B, top row) fragment corresponding to PET,
CN- (C & D, middle row) and CNO- (E & F, bottom row) fragments corresponding to
amidated PET. ... 49 Figure 3.7: ToF-SIMS image of F- fragment of virgin PET (A, top left), APTES treated PET
(B, top right), virgin PET exposed to mF8H2 vapor (C, bottom left), PET-APTES exposed to mF8H2 vapor (D, bottom right). ... 51 Figure 4.1: Changes in optical transparency when PET is exposed to various solvent at room temperature. Virgin PET (left), PET exposed to toluene for 1 hour (middle), and PET
Figure 4.10: High resolution XPS spectra of O 1s, N 1s, C 1s, and S 2p of p(SBMA) brush grown on silicate coated PET substrate. ... 72 Figure 4.11: Fluorescence microscopy images of virgin PET prior to protein exposure (left), virgin PET exposed to the fluorescent protein for 24 hours (middle), and PET with anti-fouling coating exposed to fluorescence coating for 24 hours (right). The top row images were taken with a 10x magnification and the bottom row were taken with a 50x
CHAPTER 1 - MOTIVATION AND DISSERTATION SYNOPSIS
This Ph.D. Dissertation is motivated by the desire to take existing materials, such as polyesters and cellulose esters, which possess excellent mechanical and optical properties, and impart surface functionality in order to expand their use in a wider range of applications. This introductory chapter describes unique surface properties of this class of polymeric materials compare to its bulk properties. The chapter also explains the appeal of polyesters and cellulose esters and provide a synopsis of the dissertation.
1.1. Introduction
When selecting polymers for any given applications, the surface attributes of a polymer are often just as important as its bulk properties. Given the versatility of polymers to be processed into various forms, their low cost, and desirable bulk properties, surface modifications have become a crucial part of the plastic industry to make relatively inexpensive polymers into value-added finished products.
1.2. Surface Properties
Surface physical properties of polymers can vary widely from their bulk characteristics. These variations can be due to end-groups of polymeric chains, the difference in arrangement and properties of crystalline and amorphous regions, and molecular weight distribution1,2. The
surface chemical composition, surface charge, surface tension, topography, and surface hardness are all important attributes that ultimately determine if a polymer is suitable for a specific application. Often these properties depend on one another, and changing one attribute leads to variations in the other.
1.2.1. Surface Chemical Composition
The functional groups that are present on a polymer surface determine surface tension and surface charge, which can be tuned to enhance a polymer’s viability in various applications. For example, to improve adhesion, modification of the surface chemistry may be necessary to ensure adhesion between two different substrates via covalent bond, hydrogen bond, or ionic interactions3. For biocompatibility, depending on polymer system, the surface chemistry may need to be modified to encourage the adhesion of cells4,5, as in the case for tissue scaffolds, or repel proteins6. There are numerous polymer surface modification techniques that enable controllable alteration of surface chemical composition. Generally, all those methods are split into two big categories; physical or chemical treatments. The actual choice of the treatment protocol is determined by the initial chemical composition of the polymer surface and type of chemical functionality desired at the end of the process.
One way to tailor a polymer’s surface property is via radiation grafting, which
radiation, X-rays, ultraviolet (UV) radiation, or visible light (though UV and X-rays radiation are the most common) in the presence of a monomer in solution7. Alternatively, radiation
treatment can also be used to pre-irradiate the sample to create hydroxyl functionalities, for example, and then expose it to a monomer to initiate grafting through surface-induced polymerization7. Many studies have explored radiation grafting as a way to modify surfaces of polymers8,9. In a recent study, UV radiation was coupled with ozone to change the surface of PET9. The study concluded that ~2 minutes of UV/ozone exposure to the surface was
sufficient to adequately alter the surface for the addition of semi-fluorinated organosilane molecules with minimal degradation of the surface.
Plasma treatment is another route for physical surface modifications of polymers7. One advantage of this technique is that the excited species in gas plasma can modify the surface of all polymers, regardless of their chemical structures and chemical reactivity7. Additionally,
choosing different plasma gases allows for controllable chemical tailoring of polymer surface. Another advantage of plasma treatment is that one can avoid some of the problems inherent with wet chemical modifications, i.e., residual solvent on the surface and swelling of the substrate. However, plasma treatment must be carried out in vacuum, which increases the cost of the final product7. The process parameters are highly system dependent, which makes
Corona and flame treatments are also commonly used in the plastic industry to improve the surface adhesion and printability of polymer films10. These two processes utilize
equipment that is easy to operate and cost efficient and runs in continuous operations. However, both of these processes operate in open air, thereby increasing the chance of contamination of the polymer surface7. Furthermore, all of the aforementioned physical treatments degrade polymer surfaces to varying degrees.
Figure 1.1: Addition-elimination mechanism of nucleophilic acyl substitution11.
For other polymer systems, different reaction pathways are possible depending on the functional group of the polymer’s repeat unit and/or side groups16. For instance, polymers
containing hydroxyls (i.e., polyvinyl alcohol and cellulosics) can be reacted with acyl halides to form esters, isocyanates to form a carbamate, and anhydrides to form a carboxylate17-19. Polymers containing phenyl groups, like polystyrene, can be modified by reacting with halogens (in presence of a catalyst), or reacting with nitric acid and sulfuric acid to make nitrated or sulfonated polymers, respectively20-22.
1.2.2. Surface Ionic and Electrostatic Charge
The surface charge of a polymer is a crucial parameter for multitude of applications. Namely, the generation of electrostatic charge on the surface is detrimental for electronic devices. Many procedures have been developed to minimize electrostatic discharge events during manufacturing and during use by the customer. While many factors affect surface charging, the chemical composition and presence of charged species dictate whether a surface is more likely to become positively charged or negatively charged. Polymeric materials tend to be dielectrics, i.e., meaning that under the right conditions they can build-up electrostatic charge and discharge it. Making the surface conductive to bleed-off charge is one way to avoid sporadic surface electrostatic discharge. Another method is to decorate the surface with charged species (ions) to prevent the build-up of electrostatic charge on the surface23.
redistribution of ions on the material surface. These two theories however do not explain why two identical materials become electrified when rubbed together. A theory that might explain that behavior is that charge transfer is the result of nanoscale pieces of material transferring between two surfaces during contact24. Another theory states that the electron clouds of surface atoms overlap when the two surfaces (A and B) come into contact24. Upon separation, there is a probability that the electron that was originally on surface A ends up on surface B. These last two theories are not as widely accepted, but all four theories are plausible explanations to surface electrification.
1.2.3. Surface Energy
discussed in Chapter 6, is the generation of smudge resistant surfaces, where a small surface energy in addition to surface roughness topography is needed.
1.2.4. Topography
The surface topography is a vital parameter in display applications, anti-fouling, and adhesion. Surface roughness can affect the capability of materials to adhere to another substrate (by increasing the area of contact). It can also influence the electrostatic charging properties26,28, and it can even affect the wettability properties29 of the material. For anti-fouling applications, it has been shown that surface topography can play a significant role in determining if microorganisms can irreversibly attach to surfaces30,31.
There are several ways to image surface topography. The available methods range from simple optical microscopy, which can show topographical features in the range of microns to slightly more complex, like atomic force microscopy (AFM) and profilometry, which can image features that are nanometers in size. Surface roughness is measured by taking a one-line scan on a surface and calculating the vertical variation from the mean line. Both the average roughness, Ra (most commonly used), and root-mean-square roughness (RRMS)
parameters gives a good general description of height variations. But, the RRMS is more
1.2.5. Surface Hardness
Hardness is a measure of a material’s resistance to localized plastic deformation. The surface hardness of a material plays a significant role in determining how well a material can withstand scratching, which for polymeric materials is critical for the maintenance of optical clarity. Surface hardness is very closely related to the material’s bulk tensile strength33. As we will discuss in Chapter 2, the bulk glass transition temperature can vary from the surface glass transition temperature. This in turn, can have a significant impact on the surface tensile strength, which can be very different from that of the bulk34-36. Improving the surface hardness of polyesters takes advantage of the toughness, optical clarity, and lightweight properties that are not shared by other materials with high surface hardness, namely ceramics (brittle) and metals (non-transparent and dense).
1.3 Importance of Polyesters
Polyesters are produced by polycondensation of glycols (or dialcohols) with difunctional carboxylic acids (or diacids). Because of countless combinations of dialcohols and diacids, many different kinds of polyesters exist today. However, only about a dozen of such materials are of commercial significance37. Polyesters are employed in a variety of applications, including, textiles, automotive, packaging, and construction, just to name a few.
tons of thermoplastic polyesters in the year of 200739 and in 2014, worldwide polyester production was 46.1 million tons40.
Figure 1.2: Chemical structure of poly(ethylene terephthalate) (PET).
Most polyesters are thermoplastics, which can be melted and reshaped by applying heat and pressure. However, there is an increase in the global market share of thermosetting unsaturated polyesters, which degrade when exposed to heat and pressure37. Depending on their application, production of polyesters can be produced as fibers, films, liquid crystals, and unsaturated resins.
1.3.1. Unsaturated Polyesters and Copolyesters
An unsaturated polyester resins represent versatile polymer systems due to growing number of applications. They consists of polyesters and a reactive diluent, typically styrene, which lowers the viscosity and irreversibly cross-links with the polyester41 becoming a
additives, fillers, and reinforcements results in further modification of the resin. Therefore, unsaturated polyesters have thousands of possible variations that can be fine-tuned for specific applications.
Typical properties of thermosetting polyesters include excellent electrical properties (high surface and volume electrical resistivity, high dielectric strength, and low dielectric constant), low cost, and the ability to be formulated for use at both room-temperature and high-temperature applications42. Many thermosetting polymers are often reinforced with filler
materials, such as glass fiber, wood flour, and others38. These composites are molded via transfer molding, compression molding, or injection-compression molding. The mechanical properties of the final part depend on the filler orientation. The thermal expansion coefficients and the shrinkage of these polymers depend strongly on the type and volume fraction of filler38. Unsaturated polyester resins are often reinforced, usually with fiberglass, to give the resin additional mechanical strength. Glass-reinforced unsaturated polyesters are widely used as building materials for boats, yachts, and cars37.
1.3.2. Thermoplastic Polyester Fibers and Films
PET film is one of the toughest plastic films. It possesses excellent fatigue and tear strength, and a high resistance to humidity, acids, greases, oils, and solvents42. The strength
of PET film is increased by applying heat and pulling of the film. A biaxially oriented PET film (commonly known as Mylar®) is one of the strongest films available. Thicker films are used to manufacture carbonated drink containers (due to low CO2 permeability) and are also
employed as a magnetic film in X-ray and other photographic applications. Thinner films are used in food applications, i.e., food packaging, including the boil-in-a-bag foods43.
Another advantage is that thermoplastic PET can be recycled multiple times without significant loss of its mechanical and optical properties. PET is the most recycled plastic in the United States44; recycled PET can be manufactured into the original product or used to fabricate other polyester-based products like clothing or automotive parts44. PET can be recycled by cleaning the plastic to remove contaminants followed by melt processing into new products45. Alternatively, PET can be depolymerized via hydrolysis or glycolysis and using the resulting monomers to make PET pellets45. Bottles, jars, and containers made from PET resin are identified by a number “1” surrounded by chasing arrows (numbering system was developed by the Plastics Industry Trade Association).
1.3.4. Properties and Morphology of PET
manufactured via injection/blow molding exhibit a high degree of crystallinity (with the excess of 40%)13.
Table 1.1: Properties of amorphous and crystalline PET42,46. PET Morphology Density
(g/cm3) Degree of Clarity
Tg (°C) Tm (°C) Amorphous Crystalline 1.3 1.4 - 1.5
Clear Opaque
67 81 – 125
250 – 265 250 – 265
1.4. Importance of Cellulose Esters
Cellulose acetates, the most common type of cellulose esters, are widely used for the manufacture of filter tow, textile fibers, films, and molded parts. In 2001, the global cellulose acetate production for cigarette filters accounted for $2.2 billion and $0.6 billion was attributed to textile yarn47. One of the attractive aspects of cellulose esters is that, unlike most other industrial plastics, they are manufactured from cellulose (a natural, renewable resource) instead of petroleum. Additionally, cellulose acetates are biodegradable48,49, making this material attractive to produce environmentally friendly products that can minimize the amount of waste that ends up in landfills.
thermal, and rheological properties of the resulting cellulose ester. In this Ph.D. Dissertation cellulose acetate (see Figure 1.3) was used, given its ubiquity.
Figure 1.3: Chemical structure of cellulose acetate.
1.5. Dissertation Synopsis
to impart various functionalities to the surface, including scratch resistance and improved solvent barrier properties. The surface functionalities to be discussed are improved solvent barrier properties, tunable wettability, anti-fouling, and scratch resistance.
In Chapter 2, we describe challenges one faces when attempting to perform chemical modifications using organic solvents. It was observed that most organic solvents caused the formation of crystalline surface morphologies even at low temperatures (below the glass transition temperature of PET). We elaborate that this phenomenon (solvent-induced crystallization) is not restricted to polar aprotic and non-polar solvents, but to protic solvents as well. Furthermore, we show that for certain solvents the formation of crystalline features take place only within the top few nanometers of the surface. These findings limit the number of solvents one could use to perform the chemical modification on PET substrates. We also provide evidence that utilization of water as a modification media enables controllable formation of highly reactive surface chemical functionalities without the alteration of other important attributes of PET films i.e., optical clarity.
In Chapter 3, we describe the amidation process on PET surfaces; it establishes that the amidation reaction proceeds faster in water compare to other organic solvents. We use a model system of 3-aminopropyltriethoxysilnae (APTES) to investigate chemical reactions that take place at PET interface at different modification conditions. We also discuss uniformity/extent of the reaction and utilization of alkoxysilane groups for post-modification reactions.
deposition of films with a thickness ranging from a few nanometers to a few hundred nanometers. This coating allows for tuning the wettability and application of an antifouling coating. Additionally, we show that we can use sodium silicate (a water-soluble silicate) to form a thick film in the order of microns that imparts solvent barrier properties and scratch resistance.
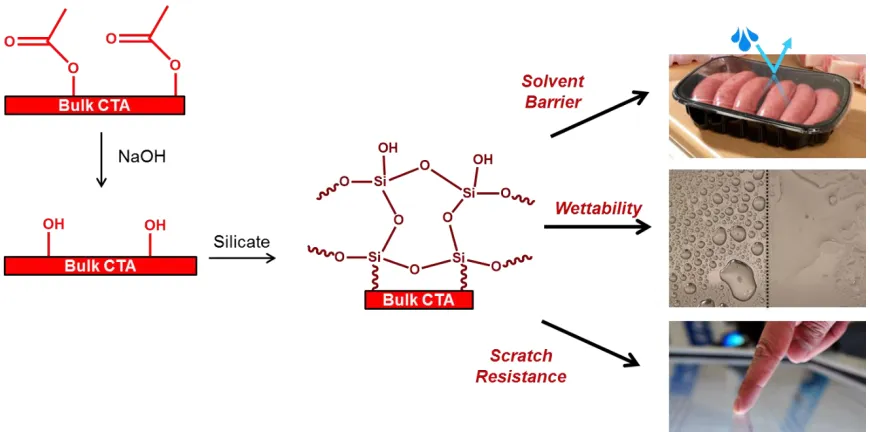
Figure 1.5: Schematic of surface functionalization of cellulose triacetate (CTA) to improve solvent barrier properties, scratch resistance, and tune wettability.
characteristics of cellulose triacetates allow for utilization in display, packaging, and biomedical applications.
CHAPTER 2 - SOLVENT-INDUCED CRYSTALLIZATION OF POLY(ETHYLENE TEREPHTHALATE)
Chemical surface modifications of poly(ethylene terephthalate) carried out in organic solvents can cause the formation of dendritic structures on the polyester surface. Depending on the solvent used and the reaction temperature, solvent-induced crystallization can turn the polymer film opaque, increase surface roughness, and detrimentally affect the mechanical properties of the polyester film. We examine the impact of various organic solvents (polar protic, polar aprotic, and nonpolar) on the optical transparency, degree of crystallinity, and surface topography in order to evaluate the viability of those solvents to perform surface chemical modifications on polyesters.
2.1. Introduction
Physical properties of PET (i.e., optical clarity, density, strength, stiffness, and toughness) depend upon the degree of crystallinity. Previous studies have determined that spin-coated PET film are highly amorphous51 when prepared using similar spin-coating procedure as described in the Appendices to this Ph.D. Dissertation. Jukes et al. characterized spin-coated PET film using GI-SAXS and showed that there was no molecular order in either the bulk of the film or in the surface of the film51. Another study using sum frequency
Figure 2.1*: 5x5 µm AFM images of PET surface annealed at 85 °C for a) 0 min, b) 5 min, c)
10 min, d)15 min, e) 20, and f) 30 min58.
Thermal-induced crystallization of PET occurs when the material is heated above the glass transition temperature (Tg) but below the melting point (Tm). Crystalline PET can also
be formed by slow cooling from the melt. As shown in Figure 2.1, upon heating a highly amorphous PET sample to 85 °C, dendrite-like structures start to form on the surface, which then propagate as a function of time until they merge with other dendrites and cover the entire surface58. Several studies59-61 have demonstrated that amorphous PET exists mostly in the ‘gauche’ conformation while highly crystalline PET adopts mostly the ‘trans’ conformation.
These two conformations have two different absorption signals in infrared spectroscopy.
Several studies have utilized infrared spectroscopy to study crystallinity of PET and have shown evidence that thermal induced crystallization occurs faster at the surface since the Tg is
lower at the surface62,63.
Figure 2.2: Three layer model of different Tg within polymer thin films and formation of
surface crystal structures upon heating above Tg64,65.
Wang64 and Shinotsuka65 have proposed a three layer model for polymer films (see Figure 2.2), where the Tg varies between the substrate-bulk, bulk, and bulk-surface interfaces.
The Tg of the polymer film surface is lower than the Tg of the bulk. For PET, surface Tg as
low as 48.1 °C has been reported when PET film is exposed to air only65. The formation of dendritic structures has been observed when films are exposed to temperatures above 48.1 °C. In addition to thermal-induced crystallization, PET can undergo solvent-induced crystallization. Several studies have shown that exposure of PET to certain organic solvents causes crystallization even at temperatures below the Tg66-70. These studies, however, were
2.2. Experimental Section
Chemicals and Reagents. PET copolymer (Eastapak 9921) pellets and film (250 µm thick) were provided by Eastman Chemical Company. 2-chlorophenol, methanol, 1-propanol, 1-butanol, acetone, tetrahydrofuran, toluene, ethyl acetate, dimethyl formamide, dimethylsulfoxide, toluene, dichloromethane, chloroform, and cyclohexane were purchased from Sigma-Aldrich. All chemical were used as received. Silicon wafers (p-type, boron-doped, orientation ⟨100⟩) were purchased from Silicon Valley Microelectronics.
Preparation of Thin PET Films. PET pellets were dissolved by heating them in 2-chlorophenol at concentrations between 0.5% and 1.0% (w/w). Once dissolved, each polymer solution was filtered using a 0.2 μm PTFE filter to remove any particulates and undissolved
polymer. Silicon wafers were rinsed with methanol, followed by UVO treatment for 5 min, to remove any organic contaminants on the surface. Thin PET films having thicknesses of about 100 nm were spin-coated onto the silicon wafer segments measuring 1 cm × 1 cm by varying the polymer concentration in solution. Thin films were dried in air for at least 1 h, followed by drying under vacuum at room temperature for at least 24 h. Spin-coated PET films were uniform and smooth as assessed via optical microscopy and atomic force microscopy (AFM). The root-mean-square (RMS) surface roughness obtained from a 5 × 5 μm2 AFM scan for a
spin-coated PET film was ≈ 0.2 nm.
(RMS) surface roughness was calculated using a 5 × 5 μm2 scan area. All images were
processed and analyzed using IgorPro software.
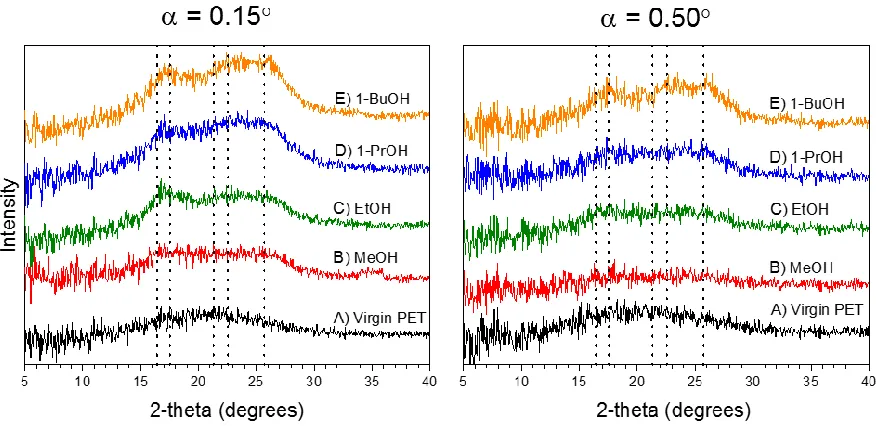
GI-XRD Measurements. Presence of surface crystal in PET films was determined using a Rigaku SmartLab X-Ray Diffractometer in grazing-incidence X-ray diffraction mode. Diffractions between 2-theta of 5° and 40° (0.05° steps) were measured at an angle of incidence of 0.15° and 0.5°. For PET, the critical angle of incidence is 0.2°; above this angle (0.5° in our case) the beam penetrates through the bulk of the film and below this angle (0.15°), the scattering depth is less than 8 nm71. PET has a triclinic crystalline unit cell and the diffraction pattern was determined by calculating the d-spacing between the triclinic Miller planes (01̅ 1),
(0 1 0), (11̅ 1̅), (0 1 1), and (1 0 0). Where a = 4.56 Å, b = 5.94 Å, c = 10.75 Å; =98.5°,
=118°, and =112° and tabulated in Table 2.151,72,73.
Table 2.1: Diffraction pattern of PET’s triclinic crystalline unit51,72,73. Miller Plane d-spacing
(Å)
Q (Å-1)
2-theta (degrees)
01̅ 1 5.40 1.16 16.42
0 1 0 5.06 1.24 17.53
11̅1̅ 4.17 1.51 21.31
0 1 1 3.78 1.66 22.54
1 0 0 3.47 1.81 25.70
peak observed using the following equation: d = 2π/q, where d is the distance between domains and q is the scattering vector.
UV/Vis Spectroscopy. The percent-transmittance was calculated using a Cary 500 UV spectrometer. All measurements were performed at 550 nm wavelength, which is within the recommended range per ASTM D1746 (“Test Method for Transparency of Plastic Sheeting”)74.
2.3. Results and Discussion
Exposure of PET films to various organic solvents causes a decrease in the measured %transmittance at 550 nm wavelength. As shown in Table 2.2, heating PET in air and water up to 60 °C for one hour causes no changes to the percent transmittance. Exposure to polar protic solvents at room temperature also causes no changes to its percent transmittance. This makes polar protic solvents suitable to perform chemical modification reaction on PET surfaces. When heated to 60 °C in alcohols for one hour, however, we do notice a decrease in percent transmittance. Methanol has the sharpest decrease out of the alcohols tested (77 %transmittance). All other alcohols tested, the %transmittance remained above 85%.
relatively high transparency was observed in cyclohexane-treated PET films. No decrease in transparency was obtained even after performing the experiments at elevated temperature (i.e., 60 °C) for one hour.
Table 2.2: Percent transmittance measured with UV/vis at 550 nm wavelength of PET exposed to various solvents at 23 °C and 60 °C for 1 hour.
Solvent Type Solvent Temperature
(°C)
Transmittance at 550 nm (%)
n/a
Air 23
60
92 92
Polar protic
Water 23
60
92 92
Methanol 23
60
92 77
Ethanol 23
60
92 86
1-Propanol 23
60
91 87
1-Butanol 23
60
92 91
Polar aprotic
Dimethyl sulfoxide 23 2
Dimethylformamide 23 0
Acetone 23 14
Ethyl Acetate 23 33
Tetrahydrofuran 23 0
Non-polar
Dichloromethane 23 0
Chloroform 23 0
Toluene 23 76
Cyclohexane 23
60
Figure 2.3: PET films exposed to polar protic solvents for 1 hour at room temperature and at 60 °C.
at various spots in the surface and fuse together with neighboring crystal fronts until the entire surface is covered.
As shown in Figure 2.4, PET surfaces exhibits dendrites that fully cover the surface when exposed to toluene at room temperature for one hour. Exposure of PET to toluene at 60°C for one hour roughens the PET surface and it cannot be imaged using AFM. The observed dendritic structures on PET surfaces correlate with the decrease in %transmittance measured using UV/vis. Figure 2.4 also show the formation of dendrites on the surface when PET is exposed to cyclohexane at 60 °C for one hour. Initially, the dendritic structure resembles a bow-tie, which eventually forms a near-perfect circular dendrite.
Solvent-induced crystallization is not limited to the solvents studied in this work. Most common organic solvents (protic polar, aprotic polar, and non-polar) cause solvent-induced crystallization to varying degrees, which poses a variety challenges to perform chemical modifications on PET surfaces. Surface crystallization changes the refractive index of the surface, which makes it difficult to accurately calculate the change in thickness via common optical techniques (e.g., ellipsometry). In addition, the presence of surface topography and surface roughness make ellipsometry data nearly impossible to interpret. Additionally, crystallization of PET due to solvent exposure causes changes in mechanical properties and optical clarity, which may be undesired depending on the application. Formation of dendritic structures at the surface by various organic solvents places a limit on which solvent can be used to activate PET surfaces. Any chemical modification procedure used must not significantly affect the optical and mechanical properties of PET.
To get insight into the phenomenon of solvent-induced crystallization, grazing-incidence X-ray diffraction (GI-XRD) was performed on samples that exhibited topographical changes as shown in Figure 2.3 and Figure 2.4 . The GI-XRD results show that the topographical features observed in the AFM images are indeed crystals (see Figure 2.5 and Figure 2.6). The data in Figure 2.5 show that virgin PET has a broad peak for both angles of incidence, which indicates that virtually no crystalline regions are present (within the resolution of the instrument). For the alcohol series, we note the appearance of peaks in the region that encompass five of the expected peaks as described in the experimental section. At
higher intensity relative to those recorded at = 0.5° (probing bulk of film). This indicates
that there is a higher density of crystals present at the surface of PET than in the bulk.
Figure 2.5: GI-XRD spectra at angles of incidence of = 0.15° (left) and = 0.5° (right). From bottom to top, virgin PET (A), and PET exposed to methanol (B), ethanol (C), 1-propanol (D), and 1-butanol (E) for one hour at 60 °C. Dotted vertical line denote theoretical crystalline peaks of PET (see Table 2.1).
PET film exposed to toluene for 1 hour at room temperature show more pronounced
crystalline peaks at = 0.15° (see Figure 2.6). PET films exposed to cyclohexane for one
Figure 2.6: GI-XRD spectra at angles of incidence of 0.15° (left) and 0.5° (right) of PET exposed to toluene at room temperature (bottom) and cyclohexane at 60 °C (top) for one hour. Dotted vertical line denote theoretical crystalline peaks of PET (see Table 2.1).
To gain further insight into the crystal domains present in solvent-induced crystals of PET, we performed GI-SAXS experiments at an angle of incidence of 0.15° (which is below
the critical angle). Virgin PET shows a prominent peak at q 0.00514 Å-1, which equal to a
Figure 2.7: GI-SAXS data of virgin PET (left plot, black spectrum) and PET exposed to alcohols for one hour at 60 °C (left plot) and the right plot shows PET exposed to toluene at room temperature and to cyclohexane at 60 °C for one hour.
The right plot in Figure 2.7 show the scattering intensity of PET films exposed to toluene at room temperature and cyclohexane at 60°C for one hour. PET film exposed to cyclohexane exhibits a d-spacing of 21 nm whereas films exposed to toluene possesses multiple scattering peaks; the most dominate peak results in a d-spacing of ~26 nm. PET films exposed to toluene exhibited the smallest d-spacing observed during this study ~12 nm.
2.4. Conclusions
CHAPTER 3 - AQUEOUS AMIDATION OF POLY(ETHYLENE
TEREPHTHALATE) WITH 3-AMINOPRPYLTRIETHOXYSILANE†
This Chapter describes surface functionalization of poly(ethylene terephthalate) (PET) films by transamidation of the ester groups with primary amines. The use of water as a solvent improves tremendously the reaction rate and yield compared to conventionally used alcohols. In this study PET films were exposed to an aqueous solution of 3-aminopropyltriethoxysilane (APTES) which resulted in ester-to-amide reactions on the surface of the film. Hydrolysis of the resulting ethoxy moieties creates hydroxyl groups that can be used as anchoring points for further modification of PET films. This scheme offers an alternative approach to modify polyesters using water as the solvent. The work described in this chapter was carried out in close collaboration with Lance Wilson in Christopher Gorman’s laboratory in the Department of Chemistry at North Carolina State University.
3.1. Introduction
This chapter describes a water-based chemical reaction, which facilitates simple modification of the surface of poly(ethylene terephthalate) (PET). PET is an important commercial polymer utilized in the production of disposable beverage bottles, food packaging, and textiles37. However, PET is an inert material; it possesses a relatively low surface energy
and does not have the desired surface properties required by a number of industrial applications that benefit from engineered surface properties. Examples include adhesives, tissue scaffolds,
†Adapted with permission from Castillo, G.; Wilson, L.; Efimenko, K.; Dickey, M.; Gorman, C.; Genzer, J.
medical implants, flexible displays, filters, protective coatings, friction and wear, microelectronic devices, thin-film technology, and composites7,75-77.
The ability to modify the surface of PET in controllable fashion is an important asset to alter surface energy, improve chemical inertness, induce surface cross-linking, increase or decrease surface roughness and hardness, enhance surface lubricity and electrical conductivity, impart functional groups at the surface for specific interactions with other functional groups, and/or provide anti-fouling properties7. Addition of reactive functional groups to PET surfaces
can serve as a means of generating anchoring points for grafting materials onto the PET surface, which can be utilized to further tune its surface characteristics. Surface modification of PET aims to take advantage of its inherent mechanical and optical properties, its malleability retain its low cost and ease of manufacturing.
PET surfaces can be modified via a multitude of different physical8,9,13 (i.e., high
energy radiation, plasma, and corona) and chemical12-15,78-80 (i.e., hydrolysis, glycolysis, and aminolysis) treatments. Many of these modifications, however, lead to degradation of the PET polymer chains at the surface78,81-85. Nonetheless, there are examples of surface reactions of PET with 3-aminopropyltriethoxysilane (APTES) in toluene without significant physical or chemical surface degradation79,80,86. The stability of the polymer surface in toluene was
solvents66,67,87,88. Solvent-induced crystallization results in embrittlement and haziness of PET films. This phenomenon is not limited to PET only; other polyesters, such as poly(butylene terephthalate), also exhibit similar behavior89,90. Many organic solvents cause depression of the glass transition temperature (Tg) of polyesters thus limiting the range of solvents that can
be used to modify polyester surfaces. Depression of the Tg also limits modification reactions
to be carried out at lower temperatures to avoid solvent-induced crystallization.
importantly, water is a poor solvent for most polyesters of interest and therefore should neither dissolve PET nor change the surface morphology due to plasticization and solvent-induced crystallization. Here we show that not only can PET be surface-amidated using APTES in dilute aqueous solutions, but also that this reaction proceeds far more rapidly in water than in other, polar solvents, such as alcohols.
3.2. Experimental Section
Chemical and Reagents. PET copolymer (Eastapak™ 9921) pellets and film were provided by Eastman Chemical Company. 2-chlorophenol, perfluoro(methyldecalin), 40 w/w% aqueous methylamine, and APTES were purchased from Sigma-Aldrich. 4-methylbenzoic acid was purchased from Acros Organics. Sulfuric acid was purchased from Fisher. Methanol was purchased from Macron Fine Chemicals. Chromatography solvents and n-propylamine were purchased from Alfa Aesar. Column chromatography was performed on silica gel cartridges purchased from Biotage. 1H,1H,2H,2H-perfluorodecyldimethylchlorosilane was purchased from Gelest. All chemical were used as received. Silicon wafers (p-type, boron-doped, orientation <100>) were purchased from Silicon Valley Microelectronics.
Preparation of Thin PET Films. PET pellets were dissolved by heating them in 2-chlorophenol at concentrations between 0.5% and 1.0% (w/w). Once dissolved, each polymer solution was filtered using a 0.2 μm PTFE filter to remove any particulates and undissolved
the polymer concentration in solution. Thin films were dried in air for at least 1 h, followed by drying under vacuum at room temperature for at least 24 h. Spin-coated PET films were uniform and smooth as assessed via optical microscopy and atomic force microscopy (AFM). The root-mean-square (RMS) surface roughness obtained from a 5 × 5 μm2 AFM scan for a spin-coated PET film was ≈ 0.2 nm.
Synthesis of Methyl-4-Methylbenzoate. In a 20 mL round bottomed flask, 4-methylbenzoic acid (1.36 g, 0.01 mol), methanol (10 mL), and a catalytic amount of concentrated H2SO4 (~1 drop) were combined and stirred at reflux for 12 hours. Methanol was
then removed under reduced pressure. The crude material was taken up in ethyl acetate and washed three times with deionized water. The organic layer was dried over sodium sulfate, the solvent was removed under reduced pressure, and the resulting crude material was purified via silica column chromatography eluting with a gradient from 0 to 10% ethyl acetate/hexanes solution. The product was the first compound to come off of the column. Removal of the solvent afforded a thin clear residue. Yield: 1.10 g (73%). 1H-NMR (300 MHz, CDCl3) δ ppm
7.87 (d, 2H), 7.17 (d, 2H), 3.83 (s, 3H), 2.34 (s, 3H).
Synthesis of N,4-dimethylbenzamide. In a 5 mL scintillation vial, methyl-4-methylbenzoate (0.116 g, 0.776 mmol) and 2 mL of 20% w/w aqueous methyl amine were
combined and stirred at room temperature (approximately 25 C) for 12 hours. The crude
column. Removal of the solvent afforded a fluffy white solid. Yield: 0.0914 g (79%). 1 H-NMR (300 MHz, CDCl3) δ ppm 7.70 (d, 2H), 7.24 (d, 2H), 6.63 (s, 1H), 3.02 (d, 3H), 2.42 (s,
3H). 13C-NMR (75 MHz, CDCl3) δ 21.3, 26.6, 126.8, 128.9, 131.6, 141.5, 168.3. MS (ESI)
m/z 150.0912 [M+H]+.
Synthesis of 4-methyl-N-propylbenzamide. In a 5 mL scintillation vial, methyl-4-methylbenzoate (0.119 g, 0.715 mmol) and 2 mL of 20% w/w aqueous propyl amine were combined and stirred at room temperature for 12 hours. The crude reaction was extracted three times with dichloromethane. The organic layer was dried over sodium sulfate and the solvent was removed under reduced pressure. The resulting crude material was purified via silica column chromatography eluting with 4% methanol/dichloromethane solution. The product was the second compound to come off of the column. Removal of the solvent afforded a fluffy white solid. Yield: 0.0446 g (35%). 1H-NMR (300 MHz, CDCl
3) δ ppm 7.71 (d, 2H), 7.25 (d,
2H), 6.33 (s, 1H), 3.44 (q, 2H), 2.42 (s, 3H), 1.66 (m, 2H), 1.01 (t, 3H). 13C-NMR (75 MHz, CDCl3) δ 11.3, 21.2, 22.8, 41.6, 126.8, 128.9, 131.9, 141.4, 167.5. MS (ESI) m/z 178.1229 [M+H]+.
Aminolysis of Shredded PET. A 3 g portion of 250 µm thick, amorphous, free-standing PET film (Eastapak™ 9921 copolyester) was shredded using scissors and placed in a
Aminolysis of PET Thin Films. Aqueous solutions of 1% v/v APTES were prepared in deionized (DI) water. APTES was added slowly to DI water with stirring. The solution was stirred for at least one hour prior to any reaction. Spin-coated PET thin films were placed in the reaction solution for one hour at room temperature. The samples were then removed and rinsed with copious amounts DI water followed by aqueous acetic acid (pH 4). Samples were then dried with nitrogen gas.
Deposition of mF8H2. A 20% v/v 1H,1H,2H,2H-perfluorodecyldimethylchlorosilane (mF8H2) solution was prepared in perfluoro(methyldecalin). PET-APTES samples were attached to the lid of a Petri dish using double-sided tape. The lid was placed on top of the Petri dish that contained a small amount (~1 mL) of mF8H2 solution so a ~1 cm vertical gap was between the inverted samples and mF8H2solution. The vapor deposition of mF8H2 onto the PET-APTES surface was allowed to proceed for about 5 minutes. The samples were then rinsed with copious amounts of hexane and dried under a stream of nitrogen gas.
AFM Measurements. Surface topography was imaged using an Asylum Research MFP-3D Origin AFM in non-contact (tapping) mode. Silicon tips, model AC160TS, with a radius of 9 ± 2 nm, a frequency of 300 kHz, and a spring constant of 42 N/m were used. All AFM images have a 512 x 512 pixel resolution at a scan rate of 0.5 Hz. The root-mean-square (RMS) surface roughness was calculated using a 5 x 5 μm2 scan area. All images were processed and analyzed using IgorPro software.
normal). Each layer was modeled as a Cauchy layer. Film thickness was measured before and after each modification step.
FTIR Spectroscopy. Infrared spectra were taken using a Bruker ALPHA Platinum single reflection diamond ATR-FTIR spectrometer scanning between 400 and 4000 cm-1 with a resolution of 4 cm-1. Small molecules were introduced by placing several milligrams of material into the sample well, and pressed between the well and the diamond reflectometer. Spectra of thin films were taken by placing glass slides sample side down before scanning using the gold on glass backing as a reflective layer.
Mass Spectrometry. Mass spectra of surfaces were collected using a TOF-SIMS 5 from ION-TOF GmbH, using a bismuth ion source and an ION-TOF reflectron energy compensating TOF mass analyzer with ~2 meter path length and a lateral resolution of 60 nm. Mass Spectrometry analysis of small molecules was carried out on a high resolution mass
spectrometer – the Thermo Fisher Scientific Exactive Plus MS, a benchtop full-scan Orbitrap
mass spectrometer – using Heated Electrospray Ionization (HESI). Samples were dissolved in methylene chloride and acetonitrile and analyzed via syringe injection into the mass spectrometer at a flow rate of 20 µL/min. The mass spectrometer was operated in positive ion mode.
NMR Spectroscopy. Nuclear Magnetic resonance experiments were performed on a 300 MHz 1H, 75 MHz 13C Varian spectrometer. Spectra were Fourier-transformed and analyzed using the ACD software.
plane of the film and the entrance lens of the detector optics). The XPS used an Al monochromated x-ray source. The pass energies used were 160 and 20 eV for survey and high resolution respectively. The resolutions used were 1 and 0.1 eV for survey and high resolution respectively. All spectra were calibrated to the carbon aliphatic peak and were analyzed using the CasaXPS software. All synthetic components were modeled using Gaussian-Lorentzian peaks. The full-width-at-half-maximum (FWHM) was constrained such that the FHWM’s of all peaks were within ± 0.2 eV of each other.
3.3. Results and Discussion
Amidation reactions were first studied using a small molecule analogue of PET to identify the appropriate conditions for aminolysis of polyesters with primary amines. The products of the reaction between small molecule analogue and primary amine are easy to isolate and characterize using traditional analytical methods (NMR, IR, and MS). Methyl-4-methylbenzoate was chosen as a suitable analogue for PET due to its similarity in structure to the ester in the PET repeat unit.
A number of studies in the literature report on the rates of amidation of small molecule esters, particularly acetate and phenyl esters99-110. One notable difference between the current
79%, and 35%, respectively, as evidenced by NMR, IR, and mass spectrometry characterization (see Experimental section and Figure 3.2 A-C). These reactions were also conducted in methanol and tetrahydrofuran. Even with longer reaction times (120 hrs) and higher reaction temperatures (60 °C) in these solvents, no amide products were detected by thin layer chromatography or after workup of the reactions, with the exception of methanolic methylamine, which afforded a 9% yield after chromatography.
Figure 3.1: Aminolysis of methyl-4-methylbenzoate, a small molecule analogue of PET, using primary amines.
The aqueous aminolysis conditions were then applied to PET films. Reaction between PET and aqueous methylamine has been reported82. The glycol soluble portion of the reaction showed IR bands at 1630 and 1543 cm-1 as an evidence of aminolysis82. In an attempt to re-examine and expand this work, free-standing PET films (250 µm thick) were shredded and treated with aqueous methylamine (20% w/w) and aqueous propylamine (20% w/w). ATR-FTIR on the resulting solids from these reactions showed IR bands concurrent with the IR bands of both the methyl and propylamide small molecule analogues (3300, 1650 (amide I), 1550 (amide II), and 1330 (amide III) cm-1, in Figure 3.2 D-F). Figure 3.2 E-F show that the carbonyl stretch (~1710 cm-1) disappears almost completely, which indicates that the polyester
produced no such amide bands, leading to the conclusion that aminolysis of polyesters by primary amines occurs readily only under aqueous conditions. The reactions proceeding in water but not in other polar solvents could be due to differences in dielectric constants of the solvent. Water has a much higher dielectric constant relative to other solvents, which may help stabilize the tetrahedral intermediate that forms during the reaction.
Additional direct evidence for amidation of PET under aqueous conditions was sought by using spin-coated PET on gold-backed glass slides. Previous attempts to identify amide bands in PET treated with amines, suffered from poor signal-to-noise ratio111. Using thin PET films on reflective gold-backed slides facilitated the use of ATR-FTIR spectroscopy with repeated scanning to improve the signal to noise ratio. Figure 3.3 shows IR spectra of the PET films in 1% (w/w) aqueous methylamine, 1% (v/v) aqueous APTES, and 20% (w/w) methylamine.
Figure 3.3: ATR-FTIR spectra of gold coated glass slides with (A) spin-coated PET (black), (B) PET treated with 1 w/w% aqueous methylamine (red), (C) PET treated with 1 w/w% aqueous APTES (blue), and (D) PET treated with 20 w/w% aqueous methylamine (green). Shaded areas in the insets denote the expected locations for amide I, amide II, and amide III bands.
the aminolysis reaction via ellipsometry. A thickness increase after the aminolysis reaction corresponds to deposition of APTES molecules onto the surface. As shown in Table 3.1, virgin PET films had an initial average thickness of 20.5 nm. After the aminolysis reaction, there was an average increase in thickness of about 0.7 nm, which is within the range of the theoretical length for an APTES molecule112.
Table 3.1: Thickness, surface root-mean-square (RRMS) roughness of virgin PET, PET treated
with APTES, and PET-APTES-mF8H2
Sample Thickness
(nm)
RRMS
(nm)
Virgin PET 20.5 ± 0.2 0.2
PET – 1 hr. reaction with APTES 21.2 ± 0.1 0.5
PET-APTES-mF8H2 21.5 ± 0.1 0.5
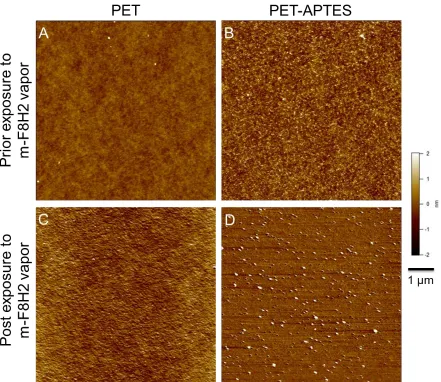
Figure 3.4: AFM image of virgin PET (A, top left), APTES treated PET (B, top right), virgin PET exposed to mF8H2 vapor (C, bottom left), and PET-APTES exposed to mF8H2 vapor (D, bottom right).
XPS measurements at two different take-off angles were utilized to analyze chemical changes on the surface of the PET specimens before and after aminolysis. Varying the take-off angle () facilitates adjusting the probing depth (d) of XPS. d = 3sin(), where is the
electron mean free path. Using a mean free path of 2.78 nm for C 1s electrons113, 95% of the
originate from the top 2-3 nm of the film. This value is important since the measured APTES layer thickness is only ~0.7 nm. XPS spectra of virgin PET (Figure 3.5) shows peaks at ~284.5, ~286, ~289 eV for C 1s region corresponding to sp2 hybridized carbon in the aromatic rings, and carbon bonded as to C-O, and O=C-O, respectively. The peaks at ~531.8 and ~533.4 eV correspond to oxygen bonded as C=O and C-O, respectively. Figure 3.5 (XPS probing depth 8-9 nm) show unequal amounts of C=O and C-O (though they should theoretically be equal) in the O 1s region. This study used commercially available PET, and the unequal amounts of C-O and C=O could be due to plasticizers and additives added to the bulk resin for processing by the manufacturer. As shown in Figure 3.5C (probing depth of 2-3 nm), however, there is an equal amount of C-O and C=O in the O 1s region indicating that the surface consists of pure PET. As shown in Figure 3.5, at =90 a broad nitrogen peak appears
at around 399 eV after exposing PET to 1% APTES for one hour. The appearance of silicon is also evident at binding energy of ~102 eV. The high resolution XPS spectra at C 1s and O
1s edges collected at =90 show no difference between virgin PET and APTES treated PET
since a large portion of electrons come from the bulk PET. The C 1s high resolution spectrum
at =15 shows the appearance of a series of new peaks, located at ~283.5, 285, ~286, and
~288 eV, which correspond to carbon bound to silicon, sp3 hybridized carbon, and carbon bonded as C-N, and amide O=C-N, respectively. The first three aforementioned peaks correspond to APTES. The peak at ~288 eV corresponds to the amide bond. This peak also
correlates with the O 1s high resolution peak at =15, which shows the appearance of two
magnitude when the sample is tilted at =15 (Figure 3.5D). The decrease in the intensity of
the nitrogen and silicon peaks between =15 and =90 along with the disappearance of the
amide and APTES peaks in the O 1s and C 1s at =90 demonstrates that APTES does not penetrate into the bulk of PET. Instead, APTES is attached on the surface most likely via covalent binding and not surface physisorption, though some physisorbed species may also be present at the polymer surface.
Variable angle XPS provides information about the chemical homogeneity of the surface at different probe depths, but it is not well suited to provide information about the lateral (e.g. in-plane) chemical uniformity of amidated PET surfaces. ToF-SIMS was employed to obtain this information. ToF-SIMS provides high resolution chemical mapping of surfaces and it is more surface sensitive than XPS. Specifically, the sampling depth of
ToF-SIMS is 1 nm when using a low primary ion beam-current density and low voltage7 as in this
Figure 3.6: ToF-SIMS image of C7H4O2- (A & B, top row) fragment corresponding to PET,
CN- (C & D, middle row) and CNO- (E & F, bottom row) fragments corresponding to amidated PET.
Organic molecules have a characteristic fragmentation pattern, which can be used to differentiate among chemical species present on any given surface of interest. For example, PET fragments observed in the negative ToF-SIMS spectrum include the following: C7H5O2
-(m/z= 121), C7H4O2- (120.02), C6H4- (76), C5H5- (65)114. For simplicity, only the C7H4O2
-(42.00)115-117. Figure 3.6 shows 100 x 100 µm2 images of virgin PET (left column) and PET after aminolysis reaction with APTES (right column). The relative intensity of the C7H5O2-
PET fragment (top row) decreases slightly after amidation reaction, which is indicative of surface coverage by APTES molecules. Furthermore, the relative intensity of both the CN -and CNO- fragments (middle and bottom row) increased upon aminolysis reaction with APTES. Based on the 100 x 100 µm2 ToF-SIMS chemical image, one can discern that APTES is uniformly present throughout the surface as there are no islands or spots observed on the chemical images of either the PET fragment (C7H5O2-) or the amide fragments (CN- and CNO
-). These results reveal that aminolysis reaction at a 1% v/v APTES concentration conducted for 1 hr is sufficient to uniformly amidate PET surfaces. Increasing the reaction temperature may reduce the reaction time to achieve uniform surface amidation of PET, which will be addressed in future studies.
To illustrate the utility of APTES activated PET with respect to further surface functionalization, the substrates were further reacted with 1H,1H,2H,2H-perfluorodecyldimethylchlorosilane (mF8H2) via vapor deposition. A monofunctional silane (mF8H2) was chosen to avoid the formation of multi-layers on the surface as would be the case for difunctional and trifunctional silanes. After completion of the vapor deposition of mF8H2, a thickness increase of ~0.3 nm was observed as discerned via ellipsometry (Table
significant increase in the surface roughness after vapor deposition of mF8H2 on PET-APTES surface.
Figure 3.7: ToF-SIMS image of F- fragment of virgin PET (A, top left), APTES treated PET (B, top right), virgin PET exposed to mF8H2 vapor (C, bottom left), PET-APTES exposed to mF8H2 vapor (D, bottom right).
a significant increase in F- intensity when PET-APTES is exposed to mF8H2 vapor for 5 minutes (right column) indicating that mF8H2 adhered very well to APTES treated PET surfaces, probably via Si-O-Si linkages. Also, as shown in Figure 3.7, the mF8H2 covers the area of the sample uniformly. This further confirms that PET has been uniformly amidated with APTES, since silanol moieties on the surface were found to be necessary for mF8H2 to react with the surface. ToF-SIMS results are complemented by XPS analysis, where the appearance of the fluorine peak at ~689 eV is only observed for PET-APTES samples exposed to mF8H2 vapor but not for virgin PET samples that have been exposed to the same vapor (see supporting information).
3.4. Conclusions
This chapter shows that PET surfaces react with 3-aminopropyltriethoxysilane in aqueous solutions, and the reaction is much slower in other solvents (alcohols, tetrahydrofuran, and toluene). The procedure described here creates a uniform coverage of hydrolyzed APTES layer on PET surfaces as shown by thickness measurements and ToF-SIMS imaging, which has a lateral resolution of 60 nm. Water is an attractive solvent as it is flammable, non-toxic, and inexpensive, and thus makes this process suitable for scale-up. The formation of islands or cross-linked APTES aggregates was not observed either in AFM images or ToF-SIMS images. Furthermore, the described procedure should also be applicable to polyester fibers.
CHAPTER 4 - DEPOSITION OF SILICATE COATINGS ON POLY(ETHYLENE TEREPHTHALATE)
Poly(ethylene terephthalate) (PET) films exhibit changes in topography when exposed to certain solvents. Even though organic solvents like ethanol do not change the optical clarity of free-standing PET, AFM imaging shows that solvent exposure causes the formation of dendritic structures on the surface of PET thin films. This phenomenon is not limited to ethanol. Most common organic solvents (protic polar, aprotic polar, and non-polar) cause solvent-induced crystallization to varying degrees, which poses a variety challenges. This chapter describes a method to deposit a silicate film on PET surfaces to impart solvent resistance. Improved tolerance to organic solvents will enable us to perform various surface modification reaction in a variety of solvents without affecting the mechanical and optical properties of polyesters due to solvent-induced crystallization.
4.1. Introduction
The deposition of silicate films via sol-gel chemistry involves preparation of a “sol” by hydrolyzing an alkoxysilane with either an acid or a base as the catalyst followed by condensation forming a gel, which is subjected to heat to densify the gel, if the desired118. The most cited sol-gel protocol is the Stöber method119, which allows for the growth of
The factors affecting the thickness, porosity, and structure of sol-gel silicate films deposited via dip-coating involve not only the type of precursor used, the acid/base catalyst used, but the deposition conditions, i.e., withdrawal rate of the substrate from the sol-gel solution, evaporation rate of the solvent, the pH during deposition, and curing conditions
120-125. The final pH must be high enough to drive the condensation reaction of the silicate, but
low enough to prevent gelation of the solution prior to deposition of the silicate. The solvent used (typically alcohols) also affects the evaporation rate and thus the porosity and quality of the film. Given the many variables that affect the sol-gel condensation reaction, it is difficult to ascertain a direct relationship of the process reaction parameters to the final properties of the deposited silicate film126. Despites those challenges, sol-gel films can be prepared readily and the reaction conditions can be tailored to minimize porosity of the film by controlling evaporation and condensation rates122.
In addition to sol-gel chemistry as a route to deposit silicate films, sodium silicate (also called ‘water-glass’) has been used to minimize metal corrosion127,128, as an adhesive129, and
formation of gels130. One of the main advantages of sodium silicate is that it can be deposited from a water medium. There are many setting agents that have been used including inorganic salts, mineral acids, organic acids, and inorganic oxides131. It has been reported that zinc