THE VARIABILITY O F RESPONSE TO SELECTION I. INTERLINE
AND INTRALINE VARIABILITY I N A POPULATION OF
DROSOPHILA AFFINIS SELECTED FOR BODY WEIGHT'
J. C. DEFRIES AND R. W. TOUCHBERRY
Department of Dairy Science, University of Illinois, Urbana, Illinois Received July 3, 1961
M O S T expectations relating to breeding systems have been derived under the assumption of an infinite or very large population and are based almost entirely upon deterministic theories in which random variation is discounted ( KEMPTHORNE 1957). However, the advance of a finite genetic population through time is subject to variation through random sampling as a consequence of Mendelian segregation and selection. Therefore, quantitative estimates of the magnitude of the random variation inherent in finite breeding systems are necessary in order to determine the reliability of the existing expectations.
Results from selection experiments involving both large animals and labora- tory organisms have demonstrated that selection is a powerful tool for changing the genetic composition of a population. The expected rate of change per genera- tion may be estimated from population genetic theory if the selection differential and the heritability of the characteristic under consideration are known. Actual responses, however, may be quite variable when only a small effective number of parents is used to perpetuate selected lines if random sampling is a n impor- tant source of variation in a selection program.
The variability of response to selection has apparently not been thoroughly studied and the various experiments designed to test this variability are not in complete agreement (CLAYTON, MORRIS and ROBERTSON 1957; MARIEN 1958; RASMUSON 1955; ROBERTSON 1955). Quantitative estimates of the variability between lines selected alike are needed to determine if the Variability in response to selection is an important source of variation in a selection program. The pri- mary objective of the present study is to obtain the interline and intraline vari- ance components from replicated lines of Drosophila ufinis subjected to two intensities of selection for body weight in each of two directions. With such in- formation, it shall be possible to construct intervals to attach to various means in order to indicate the magnitude of the variability of response to selection.
MATERIALS AND METHODS
The body weight of Drosophila is easily measured with the proper facilities and has responded to two-way selection in a large population at a low degree of
1 The data in this paper are from a thesis submitted by the senior author to the Graduate College of the University of Illinois in partial fulfillment of the requirements for the degree of Doctor of Philosophy, February, 1961.
1520 J. C. DEFRIES A N D R. W. T O U C H B E R R Y
inbreeding (MARTIN 1959; MARTIN and BELL 1958, 1960). When selected lines are perpetuated by a small effective number of parents, it is feasible to incorpo- rate much replication into an experimental design using Drosophila. Therefore, the body weight of Drosophila was chosen to be studied in this selection experi- ment.
The stock used in this study was derived from a large population that was trapped in Urbana, Illinois, in 1959 and later identified as Drosophila aflinis Sturtevant ( STURTEVANT, personal communication). This population was ran- dom mated for 14 generations in the laboratory before selection was initiated in order to insure that the population was in or near a state of genetic equilibrium. The laboratory in which the study was conducted is air-conditioned and the mean daily temperature is maintained at approximately 76°F.
All flies from which data were taken were reared in 100 X 23 mm shell vials containing approximately one half inch of the usual corn meal-karo medium which had been slanted and then lightly dusted with live yeast. Parents were removed from the vials when pupation began. The flies were weighed individually to the nearest microgram on a microbalance which was found to yield highly repeatable results. The intrasex repeatability, as determined by three repeated individual weighings of 25 males and 25 females, was found to be 0.96. All flies were weighed between zero and 14 hours after emergence, and most within 12 hours, i n order to reduce the effect of ovarian development.
E X P E R I M E N T A L RESULTS
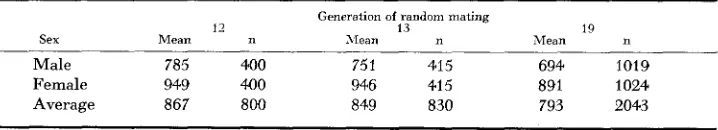
Parameter estimation: Three large samples of data were obtained from indi- viduals representing generations 12, 13 and 19 of random mating. The mean body weights of males and females and the average of these means were de- termined from the samples and these are presented in Table l . The data of gene- rations 12 and 13 were collected during February and March of 1960, whereas those of generation 19 were obtained during June of the same year. These data confirm the general observation that the body size of the flies was smaller during the summer months, even though the room temperature in the laboratory was maintained by a thermostatically controlled air conditioner. From this table it is seen that the average body weight of Drosophila afinis reared under the cultur- ing conditions of this laboratory is approximately 850 micrograms, the average weight of females exceeding that of males by approximately 200 micrograms.
T A B L E 1
M e a n body weight of Drosophila affinis in micrograms
Generation of random mating
12 13 19
Sex Mean n &lean n Mean n
Male 785 400 75 1 415 694 1019
Female 949 WO 946 41 5 891 1024
RESPONSE TO SELECTION 1521
The phenotypic variance of body weight of males and females was calculated individually from data of each of the three samples and these estimates are pre- sented in Table 2. The magnitude of the variance ratios indicates a highly sig- nificant difference between the variances of the sexes in each sample. The remarkable similarity among estimates of the variance in body weight of males should be noted.
Pooled regressions of the average body weight of five male and five female offspring on the individual weights of male and female parents, respectively, indicated that the heritability of body weight in Drosophiu'la afinis is approxi- mately 0.06, the heritability associated with the male parent being somewhat higher than that of the female parent, 0.08 us. 0.04. Full-sib correlations indicated that the heritability of body weight was substantially higher, approximately
0.50, but this estimate is believed to be greatly inflated because of the environ- mental correlation common to full-sibs reared in the same vial. Paternal half-sib correlations were also determined, but these were found to be negative. It is possible that these negative paternal half-sib correlations, as well as the higher heritability which is associated with the male parent, may be due in part to the presence of a negative maternal effect on body weight in Drosophila which is described elsewhere( DEFRIES and TOUCHBERRY 1961 )
.
Selection experiment: Ten vials representing generation 14 of random mating were randomly assigned the numbers one through ten. From each of these ten vials, ten males and ten females were randomly drawn and individually weighed between zero and 12 hours after emergence. The heaviest male and female within each vial were mated and the resulting single pair matings were desig- nated lines 1-10, respectively. The lightest pair of the ten from each vial was also mated and these matings were designated lines 11-20. From each of the same ten vials, a second random group was drawn, but this time consisting of four males and four females. As before, the heaviest and lightest pairs were mated and the resulting lines denoted 21-30 and 31-40, respectively. Finally, one pair from each of the original ten vials was randomly chosen and mated, yielding lines 41-50. The direction and intensity of selection applied to each of the groups of lines may be summarized as follows: lines 1-10, upward at ten percent (UIOX); lines 11-20, downward at ten percent (D10%); lines 21-30, upward at 25 percent (U25%) ; lines 3140, downward at 25 percent (D25%) ; and lines 41-50, unselected (100%).
TABLE 2
Phenotypic variance of body weight in Drosophila affinis
Generation of random mating
12 13 19
Sex Variance n Variance n Variance n
Male 9,176 400 9,246 41 5 9,274 1019
Variance ratio 2.0** 2.4* * 1.9* *
Female 18,636 440 22,197 41 5 17,997 1024
1522 J. C. DEFRIES A N D R. W. T OU C HB E R RY
The progeny of these matings were designated the first selected generation. It was intended to select each line each generation as intensively as the parents of the first generation had been selected in that particular line. Thus, selection was to be practiced at two intensities in each of two directions, plus a control group, with ten lines in each of the five selection groups. This design would permit the experimental determination of the interline and intraline variability in re- sponse to selection even if a number of lines were lost. Occasionally, provisional matings had to be used when the selected parents produced no offspring. When this happened, it was necessary to compensate for the lowered selection intensity by selecting more intensively in the succeeding generations. A table of selection differentials in terms of standard deviations attained by various intensities 07
selection was consulted to determine how intensively one should select in later generations to compensate for the previous loss.
I t should be noted that the parents of all 50 lines were selected contempora- neously from only ten full-sib groups, with all five selection “intensities” being applied to each. For example, lines 1, 11, 21, 31 and 41 were all selected differ- ently but were derived from the same full-sib group. This design should tend to reduce any confounding of effects of the various selection intensities with the experimental material on which they were applied.
The amount of random variation caused by chance at Mendelian segregation in a selection program is probably greatest when the effective number of parents is small. The use of single pair matings to perpetuate the lines, i.e. the smallest possible effective number of parents, therefore, should maximize the amount of random variation caused by chance segregations. Since each line is closed, how- ever, it is necessary to use full-sib mating, thus resulting in a high degree of inbreeding. Nevertheless, it was decided to use single pair matings because it made possible the handling of more lines. ROBERTSON (1955) has stated that the consistency of results in selection experiments is less when there is a high degree of inbreeding and a small foundation population. Therefore, this design should provide an estimate of the upper bound of the interline variability.
In order to measure the mean and variance of each selection group each gen- eration, it was planned to weigh at least five male and five female offspring from each line, but sometimes less than five flies of each sex were available. When- ever more than five flies of a sex were weighed only the first five were included in establishing the mean and variance for that particular line and generation.
Because of the continual loss of lines throughout the experiment it was decided that the tenth generation of selection should be the terminal point for this study, before the data of that generation were analyzed. Only 18 of the original 50 lines had not been lost by the tenth generation and there were only two remaining lines in the D25
%
selection group.RESPONSE TO SELECTION 1523
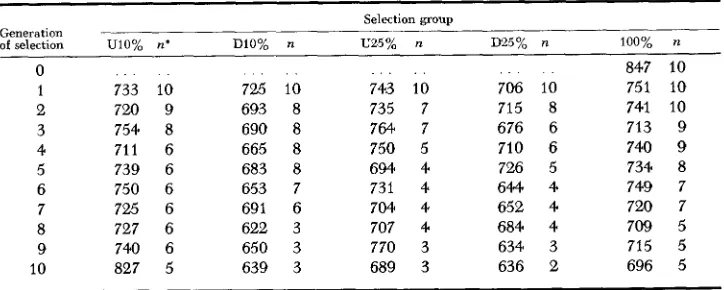
tion the coefficient of inbreeding was approximately 90 percent. However, because all lines were inbred at the same intensity and mated contemporaneously, any effects from changes in level of environment were confounded with those of intensity of inbreeding. The mean body weight of each selection group was adjusted for sex differences each generation and these adjusted means, as well as the number of lines present in each selection group, are presented in Table 3. It should be noted that the group means in the later generations are based on fewer observations than the earlier generations because of the continual loss of lines.
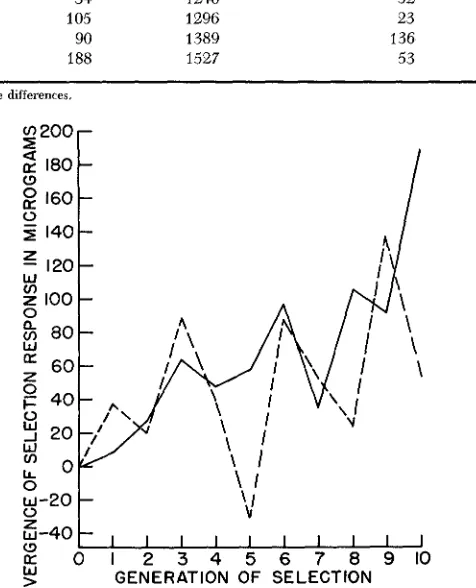
Because of the large variation between generations, the divergence between the high and the low groups of lines at the two intensities of selection was de- termined for each generation. This divergence is expressed on an intrageneration basis and is free of intergeneration differences in inbreeding and level of environ- ment, except for any interaction which may have occurred between heredity and environment. The divergence between the high and the low selected groups, as well as the cumulative realized selection differential, is presented for each generation at the two intensities of selection in Table 4. In addition, the diverg- ence between the high and low selection groups is plotted in Figure 1 and it may be seen that there is still much fluctuation between generations, with the large responses following the small ones. It is possible that this “rebounding effect” may be associated with the negative maternal effect which was mentioned previously.
The loss of lines throughout the selection experiment resulted in a confounding of the generation means with line differences. Therefore, a least squares method was employed to determine the generation means, independently of the lines, in order to measure any bias that might have arisen as a result of this confound- ing. A set of simultaneous equations was constructed involving line means con- taining both line constants and the group mean. The line constants were absorbed
TABLE 3
Mean body weight of selection group of Drosophila in micrograms
Generation
of selection UlO% R*
0 1 2 3 4 5 6 7 8 9 10 . . . . . 733 10 720 9 754 8 711 6 739 6 750 6 725 6 727 6 740 6 827 5
Selection group
DlO% 725 693 690 665 683 653 69 1 622 650 639 10 8 8 8 8 7 6 3 3 3
743 10 735 7 764 7 750 5 694 4 731 4 704 4 707 4 770 3 689 3
706 715 676 710 726 644 652 684 634 636
R 100% R
847 10 75 1
8 741 6 713 6 740 5 734 4 749 4 720 4 709 3 715 2 696
10 10 10 9 9 8 7 7 5 5 5
1524 J. C. DEFRIES .4ND R. W. TOUCHBERRY
TABLE 4
Diuergence between high and low selected groups in microgram
~~
"5 %
______ 10%
Generation Cumulatire reali7ed Cumulative realized
of selection Response se1 ection differential * Response selection differential'
0 1 2 3 4
5
6 7 8 9 10
0 8 27 64 46 56 97
34
105 90 188
0 230 442 559 762 869 1050 1246 1296 1389 1527
0 37 20 88 40 -32
87 52 23 136 53
0 140 232 358 515 635 815 91 9
1013 1201 1480
* Corrected for line differences.
8
160-5
140-120-
0
0
w - 2 0
-
0
5 - 4 0 - 1 I I I I I I I I I
cl
CK 0 1 2 3 4 5 6 7 8 9 1 0
W
2
n
1'
GENERATION OF SELECTION
FIGURE 1.-Divergence between high and low groups at two intensities of selection. The solid line refers to the divergence at the ten percent intensity of selection, whereas the dashed line refers to the divergence at the 25 percent intensity of selection.
RESPONSE TO SELECTION 1525
intensities of selection. Also, the mean of each of these groups was obtained from the average of the line means. Thus, it was possible to determine the divergence between the high and low groups by adding the respective differences between the generation constants to those between the group means. This least squares method yielded similar results to those obtained from the actual differences between the high and low group means. Thus, it was concluded that there was little or no bias present in the previous results due to the confounding of the generation means with line differences. Consequently, the divergences of response presented in Table
4
are based on the actual differences between the means of the high and low groups.The loss of lines also resulted in a confounding of the selection differentials with line differences. Thus, it was necessary to determine the cumulative selec- tion differential of each group at a particular generation, independently of lines, and this was accomplished by calculating the cumulative selection differentials on a basis of only those lines which remained. The difference between the means of the parents of the high lines and those of the low lines which remained was found for all previous generations and the divergence of response in the previous generations for those lines was then subtracted from that difference, yielding the total cumulative selection differential at that particular intensity of selection, The cumulative selection differential was determined for each generation of selection at both intensities of selection in this manner. These differentials devi- ate somewhat from those in which line differences are included; thus, the cumu- lative selection differentials presented in Table 4 are those calculated independ- ently of line differences.
The realized heritability was estimated from the regression of the divergence of response on the cumulative selection differential. The regressions, beginning with generation zero, from the data of the ten percent and 25 percent selection groups were 0.09 and 0.04, respectively. It should be noted that these realized heritability estimates are very close to those predicted from the pooled parent- offspring regressions previously presented. MARTIN ( 1959), using several differ- ent methods, has estimated that the heritability of body weight in Drosophila melanogaster is approximately 0.2.
I t was questioned whether the intense inbreeding in this selection experiment may have reduced the selection differentials or the responses to selection. In order to check this possibility, regressions of the selection differentials (not cumulative) and the divergences of response (as measured by intergeneration differences) on (1 - F ) M were calculated. (1 - F ) estimates the fraction of the additive genetic variance remaining within a given line at a given coefficient of inbreeding ( F )
.
It was found that for each one percent increase in (1 - F ) $, the selection differ-ential at the ten percent intensity increased by 1.8 micrograms, whereas that at the 25 percent intensity decreased 1.3 micrograms. Similarly, for each one per- cent change in (1 - F ) %, the response to selection at the ten percent intensity
1526 J. C. DEFRIES A N D R. W. TOUCHBERRY
inbreeding and these variables may be due to the fact that the additive fraction of the total variance of body weight in Drosophila afinis is relatively small.
Interline and intralim variances: The primary objective of this study was to measure the interline and intraline variability in response to selection. Com- ponents of variance between ( U : ) and within (v:.) lines were estimated for each
sex and for each of the five selection groups each generation. These components were calculated from the following relations:
Expected mean square between lines = a: f no“;
Expected mean squares within lines = u:~
( 1 )
(2)
no =
nL - 1 (3)
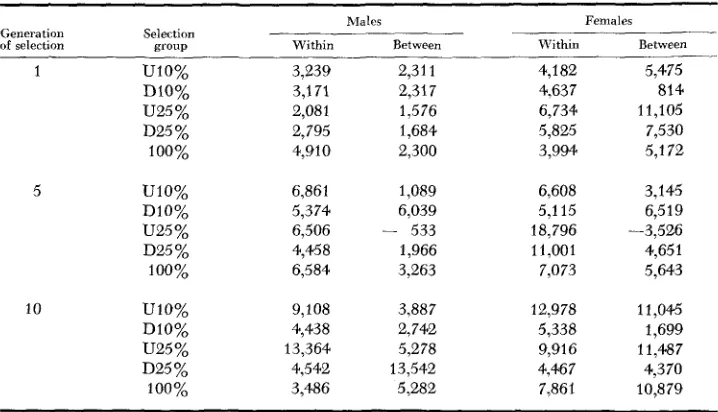
where nL is the number of lines, n. is the total number of individuals of a given sex in the particular group under consideration and ni is the number of indi- viduals of a given sex in the ith line of a group. The various components of vari- ance were estimated by equating the calculated mean squares to the expected mean squares. A complete listing of the components for each generation would require an extensive table; therefore, only components from generations 1, 5
and 10 are contained in this presentation and these are found in Table
5.
From this limited sample, however, the large variation between and within generations may be noted.The interline and intraline variance components may be used to calculate
TABLE 5
Variance components between and within lines of selection groups
-
Males Females
Generation Selection
of selection “ T U P Within Between Within Between
1 UlO%
Dl0% U25 %
D25 %
100%
5 UlO%
DlO% U25 %
D25 %
100%
10 UlO%
DlO% U25 %
D25 %
100%
3,239 2,311 3,171 2,317 2,081 1,576 2,795 1,684 4,910 2,300
6,861 1,089 5,374 6,039
4,458 1,966 6,584 3,263
9,108 3,887 4,438 2,742 13,364 5,278 4,542 13,542 3,486 5,28B 6,506 - 533
4,182 5,475
4,637 814
6,734 11,105 5,825 7,530 3,994 5,1 72
6,608 3,145 5,1 15 6,5 19
11,001 4,651 7,073 5,643
RESPONSE TO SELECTION 1527 confidence intervals for the mean of a particular line, means of lines selected alike and the mean of lines selected alike. The confidence intervals (CI) for the three criteria of grouping means are presented in equations 4-6, respectively.
CI of the mean of a line
(4)
(5) CI of the means of lines selected alike
=r+-
[ta, (no-l)]CI of themean of lines selected alike
=y*
[ta, ( n o - l ) ( n L - l ) ]where
7
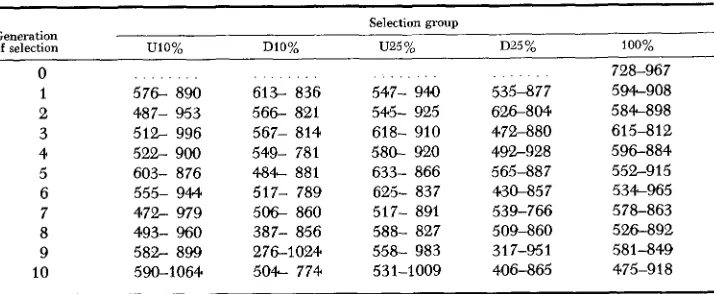
is the appropriate mean and “t” is the appropriate value from the t-distribution, given the number of degrees of freedom and the probability of a Type I error (a), i.e. the probability of rejecting a true hypothesis. The level of probability to be used in the ensuing discussion will be 0.05; therefore, it should be expected that not more than 0.05 of the actual values will occur outside of the calculated intervals.Equation 5 was used to calculate the Confidence intervals for the means of lines selected alike and these intervals were attached to the mean body weight of selec- tion groups; the resulting confidence intervals, pooled with respect to sex, are presented in Table 6. In these and the following intervals, no was considered as being equal to five for each sex and nt was assumed to be equal to ten each genera- tion. These intervals were compared to the actual means of lines selected alike and it was found that the mean of only one line in one generation, line 42 in the third generation, occurred outside of the calculated interval. It should be noted
TABLE 6
Confidence intervals for the means of lines of Drosophila selected alike
Selection group Generation
of selection W O % DlO% U25 % D25% 100%
0 728-967
1 576- 890 613- 836 547- 94.0 535-877 594-908 2 487- 953 566- 821 546- 925 626-804 584-898 3
4
5 6 7 8 9 10
512- 996 522- 900 603- 876 555- 944. 472- 979 493- 960 582- 899 590-1064
567- 814 549- 781 484- 881 517- 789 5 0 6 860 387- 856 276-1024 504- 774
618- 910 580- 920 633- 866 625- 837 517- 891 588- 827 558- 983 531-1009
472-880 492-928 565-887 430-857 539-766 509-860 3 1 7-95 1 406-865
61 5-8 12 596-884 552-915 534-965
1528 J . C. D E F R I E S A N D R . W. T O U C H B E R R Y
that the estimates of the various components, and hence the intervals, are based on fewer observations in the latter generations.
From the magnitude of the intervals presented in Table 6, it is seen that the means of lines selected alike may vary considerably under the conditions of the present study. An analogy may be drawn between selection in a line of Dro- sophila perpetuated by only two parents and selection in a small herd of domestic animals which has only one sire in service at a time. If the variability in response to selection is as high or higher in domestic animals as it is in Drosophila, it may be seen from Table 6 that one could not be certain of much progress from selec- tion in a small herd, even after ten generations. With the extremely small effec- tive number per line and full-sib mating, chance changes in gene frequency are seemingly more important than those brought about by selection. Perhaps one of the greatest advantages of artificial insemination in dairy cattle is the avail- ability of a large effective number of sires for small herds, thus reducing the large chance variation resulting when only one sire is used.
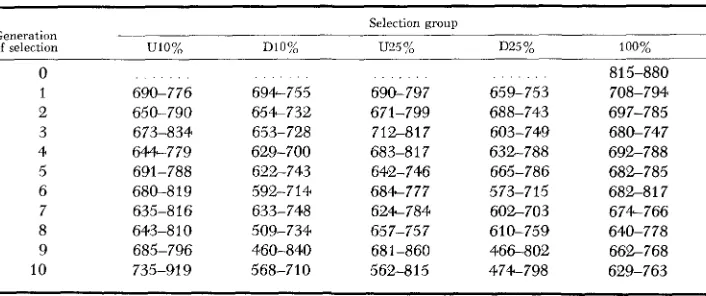
Equation 6 was used to calculate the confidence intervals for the mean of lines selected alike and these intervals are presented in Table 7. A comparison of Table 7 with Table 6 indicates, as would be expected, that the intervals for the mean of lines selected alike are smaller than those for the means of individual lines.
D I S C U S S I O N
Because of the small effective number of parents used to perpetuate each line and because of the culturing methods employed, it was expected that the vari- ability of response to selection would be large. The results of the preceding analysis confirm this expectation; a definite, but highly variable, response to selection was observed.
It should be emphasized that the magnitude of the variation observed in this experiment is not necessarily to be expected in other selection studies. Each line
TABLE 7
Confidence interuals for the mean of lines of Drosophila selected alike ~~~
Selection group
Generation -~
of selection Ul0% D10% U95 D25 % 100%
0 1 2 3 4 5 6 7 8 9 10 690-776 650-790 673-834 644-779 691-788 680-819 635-816 643-8 1 0 685-796 735-91 9 694-755 654-732 653-728 629-700 622-743 633-748 509-734 568-710 592-714 460-840 690-797 671-799 712-817 683-81 7 642-746 684-777 624-784 657-757 681-860 562-815 659-753 688-743 603-749 632-788 665-786 573-715 602-703 610-759 466-802 474-798 815-880 708-794 697-785 680-747 692-788 682-785 682-81 7 674-766
RESPONSE TO SELECTION 1529 was reared in only one vial per generation and this could add to the interline component if intervial differences are important. Also, a decrease in the con- temporaneity among lines in the last few generations may have contributed to the large interline component found in these generations. Thus, because of the small effective number of parents used to perpetuate the lines and because of the culturing methods employed, it is possible that the interline variance com- ponents estimated in this study may approach an upper limit for studies in which all lines of a particular generation are reared contemporaneously.
As mentioned earlier, the expected response to selection may be estimated if
the heritability of the characteristic and the selection differential are known. This expectation, however, does not adequately take into account the random variation involved. It would seem that a more realistic estimate of the expected genetic gain could be obtained by attaching the respective intervals presented in equations 4-6 to the product of the heritability and the selection differential. However, such predictions are valid only when intergeneration differences in variance components, level of environment and effect of inbreeding are accounted for. These conditions were not accounted for in the present study. Such predic- tions could be useful, however, in selection studies in which these conditions are accounted for and in which it is feasible to calculate the interline and intraline components of variance.
It is felt that estimates of the interline and intraline variance components using various effective numbers of parents would be useful in determining the optimum number of replicates to include in a selection experiment and the opti- mum effective number of parents to perpetuate each line. Such a study is cur- rently underway in our laboratory.
In general, it is concluded that the response to selection in this experiment was highly variable; thus, under the conditions of the experiment, random vari- ation is indeed an important source of variation. However, it should be remem- bered that variability in the response to selection should be at a maximum in this experiment where the lines were perpetuated by full-sib matings and an effective population size of two. It would seem that selection studies involving various effective numbers of parents per line, various characteristics and various organisms are necessary to determine the generality of the variability of re- sponse to selection.
SUMMARY
1530 J. C. DEFRIES A N D R. W. TOUCHBERRY
were employed to describe the variability of response to selection and they may be attached to the expected response to selection. (4) Random or chance variation was important under the conditions of the present study. ( 5 ) Experimentation is necessary to determine the generality of the variability of response to selection in different organisms, different characteristics and with different effective num- bers of parents.
LITERATURE CITED
CLAYTON, G. A., J. A. MORRIS, and A. ROBERTSON, 1957
DEFRIES, J. C., and R. W. TOUCHBERRY, 1961
KEMPTHORNE, O., 1957
MARIEN, D., 1958
MARTIN, G. A., 1959
MARTIN, 6. A., and A. E. BELL, 1958
An experimental check on quantitative
A “maternal effect” on body weight in Drosophila.
A n Introduction to Genetic Statistics. John Wiley & Sons, Inc. New
Selection for developmental rate in Drosophila pseudoobscura. Genetics 43 :
Selection f o r body weight in Drosophila melanogaster. Ph.D. Thesis. Purdue University. Lafayette, Indiana.
Response to selection for adult weight and observed changes in reproductive fitness in Drosophila melanogaster. Proc. 10th Intern. Congr. Genet.
2: 180.
An experimental check on the accuracy of prediction of response during selection. Pp. 178-1 87. Biometrical Genetics. Edited by 0. KEMPTHORNE. Pergamon Press. New York. Selection for bristle numbers in some unrelated strains of Drosophila melanogaster. Acta Zool. 36: 1-49.
Selection response and the properties of genetic variation. Cold Spring Harbor Symposia Quant. Biol. 20: 166-177.
genetical theory. I. Short-term responses to selection. J. Genet. 5 5 : 131-151.
Genetics 46: 1261-1266.
York.
3-15.
1960
RASMUSON, M., 1955