ABSTRACT
HUANG, SHUJIN. Study on Flexoelectric Materials, Structures, and Its Applications. (Under the direction of Dr. Xiaoning Jiang).
Flexoelectricity, the linear coupling between the strain gradient and the induced electric polarization, has been widely studied as a substitution for piezoelectricity among dielectric materials. Recently, the experimental demonstration has widely reported in high permittivity ferroelectric materials, and even thin film materials. Its potential in micro/nano-scale sensing has especially gained attention, outweighing the performance of cutting-edge lead-based piezoelectric materials.
To study the thermal dependence of flexoelectricity, the flexoelectric coefficient of lead-free ceramic BaTiO3-0.08Bi(Zn1/2Ti1/2)O3 (BT-8BZT) was investigated in the transverse mode
at temperatures ranging from 25 °C to 200 °C, and the results were compared with those of BaxSr1-xTiO3 (BST) ceramics. The effective μ12 of BT-8BZT at room temperature was ∼25 μC/m
and remained as high as ∼13 μC/m at 200 °C. This result suggests that BT-8BZT can be effectively used for micro/nano-sensing within a broad range of temperatures.
To broad the material selection and extend the enhancement method, the flexoelectricity in a 100 nm-thick BaTiO3 (BTO) thin film based metal/ferroelectric insulator/semiconductor (MFS)
To verify the potential advantages in applications, a novel multi-layer flexoelectric accelerometer was successfully designed, fabricated and tested. The experimental result suggests an improved sensitivity (8.106 ± 0.958 pC/g) comparing to the previous bulk ceramic flexoelectric accelerometer. The epitaxial grown BTO thin film on the Nb:STO substrate has been proved its potential in the enhancement of flexoelectric sensing not only at the room temperature, but also above Curie temperature (120 ˚C).
Study on Flexoelectric Materials, Structures, and Its Applications
by Shujin Huang
A dissertation submitted to the Graduate Faculty of North Carolina State University
in partial fulfillment of the requirements for the degree of
Doctor of Philosophy
Mechanical Engineering
Raleigh, North Carolina 2019
APPROVED BY:
_______________________________ ________________________________
Dr. Franky So Dr. Yong Zhu
________________________________ ________________________________ Dr. Larry Silverberg Dr. Xiaoning Jiang
DEDICATION
To my Dr. parents, my extended family and friends, as well as myself,
BIOGRAPHY
Journal Articles
1) Huang, S., H.M. Yau, H. Yu, L. Qi, F. So, J.Y. Dai, and X. Jiang, “Flexoelectricity in a metal/ferroelectric/semiconductor heterostructure“, AIP Advance, 8, 6, 065321, (2018 Editor’s Pick).
2) Huang, S., L. Qi, W. Huang, L. Shu, S. Zhou, and X. Jiang, “Flexoelectricity in dielectrics: materials, structures and characterizations“, Journal of Advanced Dielectrics, 8, 02, 1830002 (2018).
3) Qi, L., S. Huang, G. Fu, A. Li, S. Zhou, and X. Jiang, “Modelling of the flexoelectric annular microplate based on strain gradient elasticity theory”, Mechanics of Advanced Materials and Structures, 2018.
4) Qi, L., S. Huang, G. Fu, S. Zhou, and X. Jiang, “On the mechanics of curve flexoelectric microbeams”, International Journal of Engineering Science, 2018.
5) Huang, S., T. Kim, D. Hou, D. Cann, J. L. Jones, and X. Jiang, “Flexoelectric characterization of BaTiO3-0.08Bi(Zn1/2Ti1/2)O3“, Applied Physics Letters, 110, 22, (2017).
6) Kim, T., W. Huang, S. Huang, and X. Jiang, “Thermal Gradient Induced Flexoelectric Effects in Bulk Ba0.67Sr0.33TiO3“, Applied Physics Letters, 108, 19, 92902 (2016). 7) Huang, W., W.-Y. Chang, J. Kim, S. Li, S. Huang, and X. Jiang, “A novel laser
ACKNOWLEDGEMENTS
First and foremost, I would like to express my sincere gratitude to my advisor Dr. Xiaoning Jiang for the support and contribution of my Ph.D. study and research, as well as for his passion and immense knowledge. His mentoring has taught me, both consciously and unconsciously, how to be productive and self-motivated. The joy and enthusiasm he devotes for his research field was contagious and motivational for me, especially during the toughest time in the Ph.D. pursuit.
Besides my advisor, I would like to thank the rest of my committee: Dr. Silverberg, Dr. Zhu, and Dr. So, for their insightful comments and encouragement, not only those hard questions which incented me to widen my research from various perspectives, but also those warm greetings in the hall way and at the basketball games.
My research cannot be accomplished without collaborators: Dong, Bebe, Dr. Yu, Lu, Fan, Dr. Jones, Dr. Dai, Dr. So, and Dr. Zhou. All these smart people shared their technical insights and offered great supports during the analysis and experiments.
I gratefully acknowledge the funding sources that made my Ph.D. work possible, which are as following: the U.S. Army Research Laboratory and the U.S. Army Research Office under Grant No. W911NF-11-1-0516; National Institute of Health under Grant No. R01EB015508; U.S. Department of Energy under Grant No. DE-NE0008708. Some fabrication was performed in part at the NCSU Nanofabrication Facility (NNF), a member of the North Carolina Research Triangle Nanotechnology Network (RTNN), which is supported by the National Science Foundation (Grant ECCS-1542015) as part of the National Nanotechnology Coordinated Infrastructure (NNCI).
My time at NC State was made meaningful and enjoyable not only by the research in the lab but also due to many friends that I met in life. I am very grateful for time spent with girls in the gym classes, my trip buddies into the mountains, my sports-specter friends at all football, basketball and baseball watching, people who gathered for potlucks, and all the ladies in MAE department guiding me through administrative errands and purchases. Starting Ph.D. was not a born decision, which I would not even think about it without Ms. Wilson, Shaundi, Ms. Liu, Mr. Fang and Coach Gibson. All these teachers believed in me when I was in high school and college.
stand in my way. Now, after 23 years of school, I am so proud that I have finally met the average education level of my family. Also, I miss the time I would have spent with my grandparents. Growing up, I watched how they cooked and brewed tea, which made me a born foodie. As the only child living in a metropolitan, Beijing, I have made a group of true friends like brothers and sisters, who may not understand any of my research, but warmly listened to my venting, and gave forthright admonition even as we were thousands of miles apart. On the continent of United States, I am not alone either. I have an Extarte in Mississippi, where my homestay family treat me as their oldest child. I have two awesome brothers and two sweet sisters. Last four years I enjoyed the time I was able to spend with them during Thanksgiving and Christmas. And most of all to myself, who did not hesitate a bit to choose this journey, who struggled and procrastinated a lot, who did pillow talks sadly and cheerfully, and who walked through valleys and peaks together, and who made to the finish line together.
Thank you all. I made it.
Shujin (Daisy) Huang
EB3-3418 NC State University
TABLES OF CONTENTS
LIST OF FIGURES ... xii
LIST OF TABLES ... xvi
Chapter 1. Introduction ... 1
1.1. Principles of flexoelectricity ... 1
1.2. Experimental and analytical methods on flexoelectricity ... 3
1.2.1. Direct flexoelectric measurement ... 3
1.2.2. Converse flexoelectric measurement ... 6
1.2.3. Theoretical methods ... 9
1.3. Flexoelectricity materials ... 12
1.3.1. Bulk dielectrics ... 12
1.3.2. Thin films dielectrics ... 14
1.3.3. Two-dimensional crystalline membrane: ... 15
1.3.4. Semiconductors and its flexo-like response ... 16
1.4. Applications ... 17
1.4.1. Structure design ... 17
1.5. Dissertation structure ... 21
Chapter 2. Flexoelectric effect in response of temperature variation ... 23
2.1. Background ... 23
2.2. Unimorph cantilever method ... 25
2.4. Experimental methods ... 26
2.5. Results and discussion ... 28
2.5.1. Dielectric permittivity and piezoelectric coefficient ... 28
2.5.2. Flexoelectric coefficient of BT-8BZT ... 29
2.5.3. Temperature variation of flexoelectric coefficient of BT-8BZT ... 31
2.6. Summary ... 33
Chapter 3. Flexoelectric effect in a multilayer structure... 34
3.1. Background ... 34
3.2. A metal/ferroelectric/semiconductor heterostructure ... 35
3.3. Fabrication of the heterostructure ... 36
3.3.1. Fabrication method ... 36
3.3.2. Material characterization ... 37
3.4. Experimental Method ... 38
3.4.1. Experimental set-up ... 38
3.5. Results and discussion ... 39
3.5.1. Characteristics of MFS heterostructure ... 39
3.5.2. Flexoelectricity ... 40
3.5.3. Capacitance ... 42
3.5.4. Temperature dependence of flexoelectricity ... 43
Chapter 4. Multilayer unimorph vibration sensing ... 45
4.1. Background ... 45
4.1.1. Current MEMS sensor technology ... 45
4.1.2. Advantages of flexoelectric sensors ... 47
4.2. Configuration of the multilayer unimorph ... 48
4.3. Analytical modeling ... 49
4.4. Fabrication of the vibration sensor ... 51
4.5. Experimental setup ... 51
4.6. Results and discussion ... 53
4.6.1. Numerical modeling results ... 53
4.6.2. Experimental results ... 54
4.7. Summary ... 55
Chapter 5. Hybrid bimorph energy harvester ... 57
5.1. Background ... 57
5.1.1. Current technology of piezoelectric energy harvesting ... 58
5.1.2. Current development of flexoelectric energy harvesting ... 60
5.1.3. Motivation of hybrid energy harvesting ... 61
5.2. Bimorph structure ... 62
5.2.1. Quasi-static Analysis ... 63
5.3.1. Fabrication ... 70
5.3.2. Experimental set-up ... 71
5.4. Results and discussion ... 72
5.4.1. Basic properties of materials and scaling effect ... 72
5.4.2. Frequency response ... 73
5.4.3. Electrical load response ... 75
5.4.4. Potential improvement ... 77
5.5. Summary ... 77
Chapter 6. Conclusion and future work ... 79
6.1. Conclusions ... 79
6.2. Future prospects ... 80
6.2.1. Flexoelectric functional materials ... 81
6.2.2. Other future work ... 82
LIST OF FIGURES
Figure 1.1. Flexoelectric effect origin in solids. (a) 2D structure of elementary charges without dipole moment. (b) Under uniformly tensile strain for each unit cell, the tension gradually varies from one cell to another. (c) Under inhomogeneous deformation, A
dipole moment via the flexoelectric effect was induced within the unit cell.[5] ... 2
Figure 1.2. Experimental measurement for (a) 1122 (b) 1111 [10], [15] ... 4
Figure 1.3. Shear mode measurement for PVDF[17] ... 5
Figure 1.4. An optical measurement system based on the scanning Michelson laser beam interferometer. PD: Photodiode; BS: beam splitter. ... 7
Figure 1.5. Schematic for converse flexoelectric measurement for the shear strain along x1 direction generated by the electric file gradient along x3 direction. [26] ... 8
Figure 1.6. Effective flexoelectric behaviour of semiconductive BaTiO3. [52] ... 16
Figure 1.7. Schematic of the flexure composites with geometry varied supporting material. (Reprinted Permission from Ref. 78) ... 19
Figure 1.8. (a) Optical image of an array of SrTiO3 nanocantilevers. (b) Three-dimensional image of one SrTiO3 nanocantilever with colour scale corresponding to the out-of-plane displacement. (c) The digital holographic microscope experiment set-up. ... 21
Figure 2.1. Schematic view of the experimental set-up. ... 27
Figure 2.2. Dielectric properties of BT-8BZT as a function of temperature ... 28
Figure 2.3. Electric polarization in response to mechanical displacement at 10 Hz. ... 29
Figure 2.5. Temperature dependence of the transverse flexoelectric coefficient of BST and
BT-8BZT. ... 31
Figure 2.6. Temperature dependence of the piezoelectric coefficient d33of BT-8BZT. ... 32
Figure 3.1. Schematic illustration of the Pt/BTO/Nb:STO metal/ferroelectric/semiconductor heterostructure ... 36
Figure 3.2. Schematic description of the polarization directions induced by bending the sample or by applying an electric field, and the corresponding band diagrams of the MFS structure. ... 37
Figure 3.3. The experimental set-up for electrical polarization measurement. ... 38
Figure 3.4. Current-voltage characteristics of MFS structure before bending. ... 40
Figure 3.5. Induced polarization as a function of strain gradients ... 41
Figure 3.6. the capacitance for the four different states induced by combining the ferroelectric polarization with the flexoelectric polarization. The error bars in (b) are added under a calculation of capacitance for 4 samples. A, B, C and D indicate four different combination of polarizations in Figure 3.3 accordingly. ... 42
Figure 3.7. Temperature dependence of the transverse flexoelectric coefficient of MFS Structure with two different poling directions. ... 44
Figure 4.1. Basic structures of piezoelectric accelerometers: (a) compression, (b) shear, and (c) bending. ... 46
Figure 4.2. The cross section of the multilayer unimorph. ... 49
Figure 4.3. Experimental set-up of the dynamic vibration testing ... 52
Figure 4.5. Experimental results from the dynamic vibration test of the accelerometer ... 54 Figure 4.6. Temperature dependence of the charge sensitivity of the vibration sensor... 55 Figure 5.1. Structure of piezoelectric energy harvesters: (a) cantilever unimorph (left) and
bimorph (right), (b) cymbal, and (c) stack. Green arrows represent the poling
direction. ... 58 Figure 5.2. Two modes of piezoelectric conversion of input mechanical strain into electrical
energy.[120] ... 58 Figure 5.3. Configuration of flexoelectric cantilever structures ... 60 Figure 5.4. Configuration of poling and wire connection for a bimorph with (a) hybrid (both
piezoelectric and flexoelectric), (b) flexoelectric (Piezoelectricity was cancelled by tail-to-head wire connection) , (c)piezoelectric (Flexoelectricity was cancelled by head-to-head wire connection). ... 62 Figure 5.5. Configuration of a deflected bimorph with displacement in z direction. ... 64 Figure 5.6 The corresponding electrical circuit of the bimorph series cantilever for a resistive
electrical load. ... 68 Figure 5.7. Schematic for the energy harvesting test set-up ... 71 Figure 5.8 .The comparison of voltage output (top) and power density (bottom) of a
piezoelectric and a hybrid energy harvester. ... 74 Figure 5.9. The analytical electrical load response on power density for the hybrid energy
harvester ... 75 Figure 5.10. The power density of the hybrid energy harvester prototype at different
LIST OF TABLES
Table 1.1. Measured flexoelectric coefficient values and the dielectric permittivity of dielectric
materials (at room temperature) ... 13
Table 1.2. Flexoelectric coefficient components of PVDF... 15
Table 2.1. Dielectric constant (εr) and Curie temperature (TC) of reported flexoelectric materials ... 23
Table 2.2. Geometric parameters of BT-8BZT cantilever beam ... 26
Table 3.1. Flexoelectric coefficients of thin films ... 34
Table 4.1. Key features and performance of some reported piezoelectric accelerometers ... 47
Table 4.2. Parameters for assembled parts of the flexoelectric accelerometer ... 51
Table 5.1. Properties of 2.5%Sm-doped PMN-31PT ... 72
Chapter 1.Introduction 1.1.Principles of flexoelectricity
Flexoelectricity is defined as the generation of an electric polarization in response of a mechanical strain gradient, or the mechanical strain induced by an electric field gradient. The former one is called the direct flexoelectric effect, and the later one is called the converse flexoelectric effect. The existence of flexoelectricity in solid symmetric crystalline materials was originally discussed by Kogan in 1964. [1] As strain gradient can break inversion symmetry, flexoelectricity allows the generation of electric polarization from lattice deformations in all dielectric materials. In mathematics, the flexoelectric effect is usually written in the form of
, S
jk jk
dir dir
i ijkl i ijkl
l l
con k con l
ij ijkl ij ijkl
l k
S T
P P f
x x E E T f x x = = = = , (1.1)
where Pi is the induced polarization, Tjk is the stress, Sij is the induced strain and Ek , El is the
electric field, x is the axis of coordinate,ijkl and fijkl are the flexoelectric coefficients caused by
strain gradient and by stress gradient, respectively. Dir and con indicate the direct and converse flexoelectric effect, respectively. The subscripts i,j,k,l indicates the tensor elements in the matrix. The relationship between coefficients ijkl and fijkl can be deducted via the stiffness tensor cijmn:
ijkl cijmn fmnkl
= (1.2)
B-site of the lattice will be deviated from the center position, when the material is under an inhomogeneous strain.[4]
Theoretically, the flexoelectric effect in polymers such as PVDF is similar to that in liquid crystals. However, the flexoelectric effect in polymer films is more complicated than that in solid crystals because both residual piezoelectricity effect and the flexoelectric effect should be considered. Thus, the mechanism of flexoelectric effect in polymers has not been adequately understood so far.
Cation
Anion
Flexoelectric polarization
Resulting negative charge
a
b
c
Figure 1.1. Flexoelectric effect origin in solids. (a) 2D structure of elementary charges without dipole moment. (b) Under uniformly tensile strain for each unit cell, the tension gradually varies
In the nanoelectronics, strong strain gradients are often present, which imply the potential promising applications for flexoelectricity.[6]–[8] Huang et al. showed that the flexoelectricity is a size-dependent effects due to the increasing of strain gradient when the size goes down.[9]
1.2.Experimental and analytical methods on flexoelectricity
To discover the materials with advanced flexoelectricity, it is essential to measure the flexoelectric coefficient of dielectrics ceramics, thin films, and semiconductors. In the last decades, experiments on a series of ferroelectrics have been performed due to their high dielectric constants as suggested by the lattice dynamic theory.[4] For cubic crystals, there are only three non-zero independent components of the flexoelectric coefficient matrix, which are
1122, 1111, 1211
corresponding to the transverse, longitudinal, and shear mode. For thin-film
polymers, whose behaviour is similar to liquid crystals, there are more non-zero components. In this section, we will summarize the experimental studies in two categories: direct flexoelectric measurement, where mechanical input is applied while the electrical polarization output is measured; and converse flexoelectric measurement, where an external electrical voltage is applied to the materials while the mechanical output is monitored.
1.2.1.Direct flexoelectric measurement
Zirconate Titanate (PZT). [10]–[13] Similar method was adopted to study STO by Zubko et al.[14] To eliminate the contribution of longitudinal and shear components, where the sample was constrained to be a slender bar (Length/Width>5). In addition, due to the single layer plate shape, the remnant piezoelectric contribution is symmetrically cancelled.
Specimen
Electrodes F(f)
F(f) F(f)
Electrodes
Electrodes Specimen
Specimen Loading span
Supporting span
a
b
Figure 1.2. Experimental measurement for (a) 1122
(b) 1111 [10], [15]
1111
was studied by compressing a truncated pyramid specimen, shown in Figure 1.2(b).[15]
This truncated pyramid shape was designed to generate longitudinal strain gradient when stress is applied. The average strain gradient in this truncated pyramid can be calculated from Equation (1.3), where ε11 is the strain along the thickness direction, x1 indicate the thickness direction, h is
the thickness displacement.
11 11 11 11
1 1
u l
x x h
−
= =
Other than using continuous stress and strain, many other attempts on measuring the flexoelectric coefficient of ferroelectrics were made. The shock wave method succeeded in measuring the flexoelectric coefficient of bulk barium titanate.[16]
Figure 1.3. Shear mode measurement for PVDF[17]
The shear flexoelectric coefficient (1211) for bulk ceramic material has not been measured until very recently. It has been a technical barrier to generate a shear strain gradient on bulk ceramics. However, it was easy to generate the shear strain gradient on polymers like Polyvinylindene fluoride films (PVDF), for example shown in Figure 1.3. [17] This material has been the one that was measured for the components of its flexoelectric coefficient matrix, including
1211, 3121, 2312, 1123
.[17]–[20]
such as defects, cracks and the interaction between the alpha-phase and the amorphous phase in the film.
1.2.2.Converse flexoelectric measurement
Comparing with the direct flexoelectric measurement, the converse flexoelectric measurement is more difficult to achieve mainly due to two critical issues. One is that the flexoelectric deformations have always been in the pico-meter scale for bulk ceramics, which is too small to detect. The other one is that the simultaneous electrostriction effect. Unlike the piezoelectricity, the electrostriction effect has no constraint of structural symmetry. It’s worth to note that centro-symmetric materials are selected to exclude piezoelectricity but not the electrostriction effect. While the flexoelectric effect is a first-order effect, the electrostriction effect is a quadratic effect. It would suggest that the electrostriction effect should be filtered out with a lock-in filter. However, the experiments in Fu’s initial experiments didn’t suggest so.[24]
To verify the converse flexoelectricity in BST ceramics, both longitudinal model and lateral model were adopted. Fu et al reported a longitudinal model by using an optical system to measurement the displacement with the resolution as small as 10E-5 nm. The optical system was based on the scanning Michelson laser beam interferometer, shown in Figure 1.4.
conducted on the SrTiO3 single crystal,[25] which was structured as a cantilever beam. By applying a high voltage (0-3kV) pulse for 2-3 s, the bending curvature was measurement by the deflection angle of the laser beam reflected from the surface of the unfixed edge. Instead of discussing the electrostriction effect, the temperature dependence of the effect within 77 to 450 K was obtained.
Figure 1.4. An optical measurement system based on the scanning Michelson laser beam interferometer. PD: Photodiode; BS: beam splitter.
the response of both trapezoid and rectangle samples. By assuming all the coefficient in different shapes are the same, a calculated shear flexoelectric coefficient of 124±14 μC/m was reported.
Figure 1.5. Schematic for converse flexoelectric measurement for the shear strain along x1
direction generated by the electric file gradient along x3 direction. [26]
1.2.3.Theoretical methods
For flexoelectric (non-piezoelectric and centrosymmetric) dielectrics, the most general bulk thermodynamic potential density considering both polarization gradient and strain gradient is written as
, , , ,
, ,
1 1 1 1
2 i i 2 ijkl i j k l 2 ijkl ij kl 2 ijklmn ij k lm n
ijkl ij k l ijkl ij l k i i ij kl
U PP b P P c g
h P k P E P
= + + + + + − − (1.4)
where χ is the dielectric susceptibility, cijkl is the elastic constant tensor, bijkl represents the
polarization tensor, hijkl, kijkl are flexoelectric coupling tensors. gijklmn represents the purely
nonlocal elastic effects and relates to the strain gradient elastic theories. Pi, Pi,j denote the
polarization and polarization gradient tensors, respectively. [28]–[31] Ei denotes the electric field
and σij is the stress tensor. εij, εij,k are the strain and strain gradient tensors, respectively, defined
as
, ,
1
( )
2
ij ui j uj i
= + (1.5)
Here, ui represents the displacement vector and the comma in the subscript indicates
differentiation with respect to the spatial variables i.e.
( )
,i = ( )
/xi.In the bulk thermodynamic potential density, the terms 1 , ,
2b P Pijkl i j k l and 12gijklmn ij k, lm n,
(
)
( )
(
)
( )
(
)
( )
, , , , , , , 2 2ijkl ij k l ijkl ij l k
ijkl ijkl ijkl ijkl
ijk l ij l k ij l k
ijkl ijkl ijk l ijkl ij l k
ijkl ijkl ij l k ijkl ij l k
h P k P
h k h k
P P P
h k P k P
k h P h P
+ − + = − + = − +
= − + (1.6)
In each form, the last term will be treated as a surface term because the whole derivative cannot be included in the bulk energy density. These expressions lead to the same governing equations but with different natural boundary conditions.
Applying the Euler equations
(
,)
,/ / i 0
i
H A H A
− = , where A stands for Pi or ij, the
bulk constitutive electromechanical equations will be obtained.
(
)
, ,
i ijkl k lj i kjli kjli jk l
P−b P =E + k −h (1.7)
(
)
, ,ij cijkl kl kijkl hijkl Pl k gijklmn lm nk
= + − − (1.8)
experiment (the characteristic size is tens or hundreds of microns). Thus, substituting Equation (1.7) into Equation (1.5) and neglecting the higher-order effects, we find the most general constitutive equations characterizing the flexoelectric effects
,
,
i i ijkl jk l
ij ijkl kl ljik l k
P E
c E
= +
= + (1.9)
Here,
ijkl =
(
kkjli−hkjli)
is the flexoelectric coefficient. The tensor kkjli −hkjli is called theflexoelectric coupling coefficients that can be represented by an independent tensor fijkl. It is obvious that the flexoelectric coefficient is proportional to the relative dielectric constants and the flexoelectric coupling coefficients, the values of which were theoretically estimated to be around several tens volts for simple ideal ionic solids by Kogan, Tagantsev and Hong. [1], [4], [38], [39] This may be called the intrinsic (or lattice-based) flexoelectric coupling coefficients. However, more and more experimental results showed that the apparent (or effective) flexoelectric coupling coefficients in many dielectrics can reach up to several hundred or even several thousand volts.[9], [11], [40] Therefore, it appears there are other dominant origins contributing to the apparent flexoelectric responses.
mismatch, to be 105-106 m-1.[42] Zubko believed the strain gradient near the defect can be as
large as 107 m-1.[14] The extremely large strain gradients will induce large local polarization and should contribute to the effective flexoelectric responses. Another main origin of the anomalously large effective flexoelectric responses may come from the residual ferroelectricity, of which the polar nano-region is one important source. Jackeline Narvaez et al found that the ferroelastic switching induced by the stress combined with the intrinsic flexoelectric field may pole the relaxor ferroelectrics such as PMN-PT even at the room temperature.[41] Similar enhancement of apparent flexoelectric responses due to the residual ferroelectricity was also found in the BST ceramics by Lauren M. Garten and much recently in PIN-PMN-PT by Shu et. al. [43]–[46]
Due to the complex microscale of nanoscale structures existing in the dielectrics, the effective flexoelectric response may result from mixed effects of many factors. These factors include the surface piezoelectric, intrinsic piezoelectric, residual ferroelectric, defects and still need to be verified in terms of both theory and experiment.
1.3.Flexoelectricity materials 1.3.1.Bulk dielectrics
Instead, the temperature dependence has caught the attention. It has been reported that flexoelectricity is positively correlated with the dielectric constant in solid crystalline materials.[15] The temperature dependence of flexoelectric coefficients has been investigated since the dielectric permittivity has a peak value at the Curie temperature. Furthermore, comparing to the piezoelectric materials, it is expected that flexoelectric materials can work in a broader temperature. It was found in BST that the flexoelectric coefficient approaches its peak at the phase transition point.[15] Later on the temperature dependence of flexoelectricity in BaTiO3 and SrTiO3 perovskite nanostructures were also measured.[49], [50] For BST, BaTiO3 and SrTiO3, the rapid drop in the dielectric permittivity in the paraelectric phase leads to an inconsistent flexoelectricity as temperature increases. The narrow and sharp dielectric peak occurring at the ferroelectric to paraelectric phase transition limits the enhanced flexoelectric effect within a narrow temperature range. All these experiments characterized the flexoelectricity under 70 °C, which are not qualified for the high temperature application.
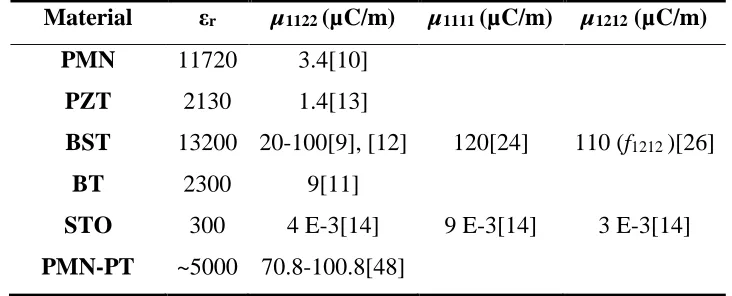
Table 1.1. Measured flexoelectric coefficient values and the dielectric permittivity of dielectric materials (at room temperature)
Material εr µ1122 (µC/m) µ1111 (µC/m) µ1212 (µC/m) PMN 11720 3.4[10]
PZT 2130 1.4[13]
BST 13200 20-100[9], [12] 120[24] 110 (f1212 )[26]
BT 2300 9[11]
Alternatively, a high Curie temperature material can be considered in the flexoelectricity. Very recently, Shu et al have reported the flexoelectric behavior in 0.3Pb(In1/2Nb1/2)O3
-0.35Pb(Mg1/3Nb2/3)O3-0.35PbTiO3 (PIN-PMT-PT) single crystal.[45] The Curie temperature of
PIN-PMT-PT is at 229 °C but the crystal undergoes a macro-domain to micro-domain transformation at 209 °C. The maximum effective flexoelectric coefficient is 125 μC/m measured at 209 °C. But above Curie temperature, it decreases to 27 μC/m.
Although significant advances of flexoelectricity have been made in the past decades, the origin of the enhanced flexoelectricity has not been fully understood. In ceramics, interference factors such as the grain boundary was discussed because of its influence to the flexoelectricity.[51] Single crystals, on the other hand, could minimize such effects. But fewer studies on single crystals were reported. It is still in debate whether flexoelectricity is a bulk effect or a surface effect. Catalan’s recent work on BaTiO3 single crystal emphasized the flexoelectricity with enlarged residual surface piezoelectricity.[52] Shu et al discovered the frequency dispersion phenomenon in PMN-PT at a relative low frequency.[48] This dispersion occurred with a time delay but had a positive relationship with frequency. Thus, it proved the flexoelectric effect acts more like a bulk effect rather than surface effect.
1.3.2.Thin films dielectrics
stronger. Polymer thin films, especially PVDF, have its advantages as for this aspect. All the reported components of the flexoelectric coefficient matrix is list in Table 1.2.
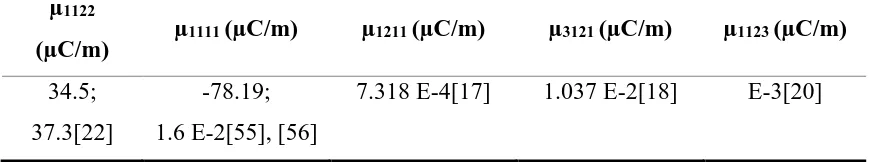
Table 1.2. Flexoelectric coefficient components of PVDF
µ1122
(µC/m) µ1111 (µC/m) µ1211 (µC/m) µ3121 (µC/m) µ1123 (µC/m) 34.5;
37.3[22]
-78.19; 1.6 E-2[55], [56]
7.318 E-4[17] 1.037 E-2[18] E-3[20]
1.3.3.Two-dimensional crystalline membrane:
characterization data of flexoelectricity in these two-dimensional materials are still missing up to now.
Sharma et al have published a thorough review on this topic including the biological membrane recently and focused on mathematical and computational developments. They pointed out the flexoelectricity has a number of implications in biology including ion transport, electromotility, and mammalian hearing mechanism.[60]–[62] They also summarized experimental findings on organic materials such as lipid bilayers.[63]
Figure 1.6. Effective flexoelectric behaviour of semiconductive BaTiO3. [52] 1.3.4.Semiconductors and its flexo-like response
Although the flexoelectricity has always been studied in dielectric insulators, the insulation is not a formal requirement for the property. Theoretically, the polarization induced by strain gradients would be responsible for the redistribution of the free charge in semiconductors.
Catalan et al reported the significantly enhanced flexoelectricity in the vacuum annealed BaTiO3 semiconductor, which was attributed to a barrier layer mechanism.[52] The mechanism
orders of magnitude since all conventional flexoelectric coefficients were reported in the order of μC/m.
Serry and Sakr reported a semiconductor structure with graphene-metal-silicone for multimodal energy conversion.[64] Flexoelectric behaviour can be observed and further modulated in the fabrication of composite structures. During the fabrication, the mismatch in the mechanical and thermal properties happened between different layers. At the same time, the residual stresses exist at the interface of the structural layers induced from the thin-film deposition processes, which was tested through pure bending and thermos-mechanical tests. Therefore mechanical and thermal energy conversions are achieved through both flexoelectric and thermionic effects.
1.4.Applications
Although the studies of flexoelectricity in materials have been proceeding, it is still difficult to make the flexoelectric effect comparable to the piezoelectric effect in existing structures and devices. Designing new flexoelectric materials has become a fundamental issue in this newly arising field. Engineering the current materials to obtain great flexoelectric coefficient has become one trend to satisfy the standard of real application, especially in passive sensing devices. Meanwhile, people started to introduce the flexoelectricity into energy harvesting devices and structural health monitoring (SHM) sensors. In this section, the work in these two branches will be summarized.
1.4.1.Structure design
material has rarely been engineered. Chu et al have demonstrated a material type named as flexoelectric/piezoelectric metamaterials by using NBBT, PZT-51, PZT-81 and BST ceramics.[65]–[68] The fabrication methods was asymmetric reduction, which was adopted from the fabrication of RAINBOW and THUNDER piezoelectric materials. Because of the reduction induced chemical inhomogeneity, the strain gradient was generated so that the apparent electromechanical coupling effect was enhanced. As results, its effective piezoelectric coefficients approached 57 pC/N at the temperature about Curie temperature, where the nominal piezoelectric device would become absent.
Figure 1.7. Schematic of the flexure composites with geometry varied supporting material. (Reprinted Permission from Ref. 78)
Previously, the potential of nano-generators were summarized and discussed in 2013.[71] Since then, there have been some investigations on materials who exhibit high flexoelectric coefficients like we mentioned in previous sections. However, the proper degradation of nano-scale structures is still required for inventing flexoelectric devices. Up to now, flexoelectric devices have been designed mainly in two applying directions, actuators and sensors, like nominal electromechanical converters by piezoelectricity.
flexoelectric beam and their flexoelectric constant were consistent by the open-circuit model. An alternative of dynamic measurements for mechanical structures was provided.
The performance of micro/nano fabricated sensors can also be improved by adopting the flexoelectric effect. Kwon et al. firstly designed and fabricated a high sensitive flexoelectric microphone, which can work at an extremely wide working frequency range based on barium strontium titanate ceramic.[77]
As for energy harvesting, Zhang et al reported a curved resonant flexoelectric actuator fabricated with PVDF.[78] Tzou et al claimed a static nano-control beams.[79] Catalan et al fabricated a pioneer cantilever actuator with strontium titanate integrated on to silicon, shown in Figure 1.8.[80] A figure of merit (curvature divided by electric field) of 3.33 MV-1 was reported to be comparable to that of state-of-the-art piezoelectric bimorph cantilever. Similar structure was also made with PZT which showed the flexoelectricity can either enhance or suppress the piezoelectric response of the cantilever depending on the ferroelectric polarity and lead to a diode asymmetric electromechanically response.
Figure 1.8. (a) Optical image of an array of SrTiO3 nanocantilevers. (b) Three-dimensional image of one SrTiO3 nanocantilever with colour scale corresponding to the out-of-plane
displacement. (c) The digital holographic microscope experiment set-up. [80] 1.5.Dissertation structure
Taking all above knowledges into consideration, the main effort of my research is to investigate the flexoelectricity of the new materials, to test the temperature dependence of their flexoelectricity, as well as to design and fabricate the devices for sensing and energy harvesting. The dissertation is composed in six chapters and references. Each chapter is briefly described as follows.
Chapter 1 reviews the fundamental principles of flexoelectricity, the current characterization method, the various flexoelectric materials, and up to date applications.
Chapter 2 presents the flexoelectricity BT-8BZT with a smoothly declined dielectric permittivity. The measurement of transverse flexoelectric coefficient and the temperature dependence study are covered, including the characterization method, testing method and results.
Chapter 4 investigates a flexoelectric accelerometer using the heterostructure reported in chapter 3. A unimorph type of a flexoelectric accelerometer with a proof mass at the tip was designed, fabricated, and tested at various temperature.
Chapter 5 focuses on energy harvesting by both piezoelectric and flexoelectric effects. The current technology and limitation of MEMS energy harvesting are taken into consideration. With the new material, the hybrid piezoelectric and flexoelectric bimorph energy harvester was analysed, simulated, fabricated, and tested.
Chapter 2.Flexoelectric effect in response of temperature variation 2.1.Background
As mentioned in Chapter 1.3, it has been reported that flexoelectricity is positively correlated with the dielectric constant in solid crystalline materials. Most materials that were studied for its flexoelectricity (listed in Table 1.1) are ferroelectrics, which are characterized with a high dielectric constant. According to the theoretical model raised by Tagantsev, the flexoelectric coefficient is linear proportional to the dielectric constant. [4] Some of the ferroelectric material have shown a dielectric constant of over ten thousand around the phase transition point at the Curie temperature. [10], [12] Thus, there has been an extensive investigation in materials with their high dielectric permittivity, particularly at the Curie temperature (TC) . [13], [14], [53] Table 2.1 have summarized some materials with their dielectric constant, Curie temperature, and flexoelectric coefficients. Some suggested that the large flexoelectric polarization might be caused by reorientation of the preexisting polar clusters in the relaxor ferroelectrics by the elastic strain gradient. The enhancement is more obvious around the phase transition point. [84]
Table 2.1. Dielectric constant (εr) and Curie temperature (TC) of reported flexoelectric materials
Material εr at Tt TC µ1122 (µC/m) Testing
Temperature Tt
PMN 11720 -10 ˚C 3.4[10] 20-25 ˚C
PZT 2130 220 ˚C 1.4[13] 24 ˚C
BST 13200 21 ˚C 20-100[9], [12] 23 ˚C
BT 2300 120 ˚C 9[11] 20-25 ˚C
It is expected that flexoelectric materials work at a broader temperature range than that of piezoelectric materials. [10], [53] Nevertheless, the rapid drop in dielectric permittivity of piezoelectrics (e.g. BST and BT) in their paraelectric cubic phase may lead to a drawback of persistence of flexoelectricity as temperature rises, showing that some of these materials are not suitable for devices at a broad temperature range.
In section 1.3.1, we have mentioned a high Curie temperature material can also be considered in the flexoelectricity, to avoid the drop of the flexoelectric coefficient in the working temperature range. On the other hand, it would be the direction of material hunting to find a material with a smoothly declined dielectric permittivity to the temperature increasing. Recent studies on (1-x)BaTiO3-xBi(Zn1/2Ti1/2)O3 (BT-BZT) perovskite ceramics have shown promising
dielectric properties for high-energy and high-temperature (>300 ºC) applications[85]. When x = 0.08, BT-8BZT has exhibited a Tc of ~25 ºC, with a frequency-dependent permittivity and good thermal resistance in dielectric properties against temperatures up to 200 ºC. Therefore, it would be promising to investigate the flexoelectricity of BT-8BZT at a broad temperature range.
In this chapter, flexoelectric cantilever beams were fabricated with BT-8BZT and BST ceramics. The dielectric permittivity was examined for BT-8BZT. Then at room temperature, the flexoelectricity of BT-8BZT was measured by using a bending method, while piezoelectricity was directly measured. Furthermore, at different temperatures, the flexoelectric transverse coefficients of BT-8BZT were determined and compared with BST ceramics.
Huang, Shujin, Taeyang Kim, Dong Hou, David Cann, Jacob L. Jones, and Xiaoning Jiang. "Flexoelectric characterization of BaTiO3-0.08 Bi (Zn1/2Ti1/2) O3." Applied Physics Letters110, no. 22 (2017): 222904.
2.2.Unimorph cantilever method
For a cubic crystal, the non-zero components of the flexoelectric coefficients ijkl are 1111,
1122
, and 1212 in tensor notation, or 11, 12, and 44, in reduced (matrix) notation. Each
flexoelectric coefficient is associated with a specific mode: 11 for longitudinal, 12 for
transverse, and 44 for shear mode, respectively. Separate experiments have been carried out to determine each component for different materials[15]. Among them, the beam bending method is usually adopted to measure the 12. The induced polarization is in response to the axial normal strain gradient in the thickness direction,
11
3 12
3
P
x
=
(2.1)
where x3 is the normal axis to the electrode surface, and 11is the in-plane mechanical strain.
2.3.Fabrication of unimorphs with BT-8BZT
prepared by the e-beam evaporation (Kurt Lesker Electron Beam Evaporation System, Jefferson Hills, PA).
Table 2.2. Geometric parameters of BT-8BZT cantilever beam
Thickness Length Width
780 µm 6.5 mm 4 mm
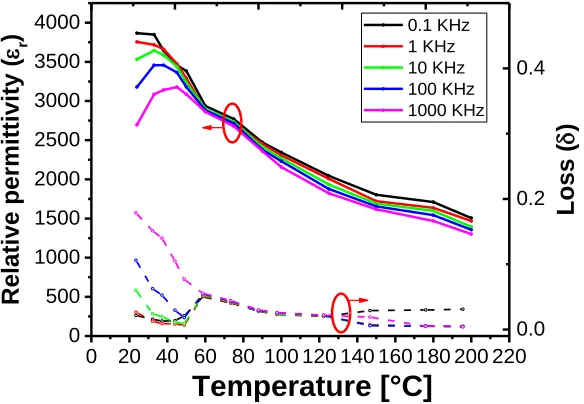
The relative permittivity of the BT-8BZT ceramic was measured at 0.1 kHz, 1 kHz, 10 kHz, 100 kHz, and 1000 kHz, respectively, using an impedance analyzer (Agilent Technologies, 4294 A, Santa Clara, CA). Meanwhile, according to Cann et al. [85], a transition in phase from ferroelectric to paraelectric was noted around 25 ºC. Concerning piezoelectricity in BT-8BZT, when the temperature of BT-8BZT sample is above the Curie temperature (25 ºC), the material should theoretically not exhibit any ferroelectricity. However, when the temperature is close to the Curie temperature, a weak persistence of the macro-ferroelectricity may exist due to local nano-domains[86]. A small displacement was observed even at the curie temperature, 25 °C, which reflected the residual ferroelectricity[11], [41]. So the contribution of piezoelectricity in
33
d mode to the total electric output was verified at room temperature. The 378 V AC electrical signal was applied across the thickness direction of the unpoled ceramics at 10 Hz, and displacement was detected by a laser vibrometer (Polytec, OFV-5000, Irvine, CA) with a resolution of 100 nm/V.
2.4.Experimental methods
deflected at the other end by a piezoelectric actuator, which was driven by a 10 Hz-excitation from a function generator (Tektronix, Model AFG3101, Beaverton, OR) along with a power amplifier (Brüel & Kjær, type 2706, Nærum, Denmark). The laser vibrometer was also used to measure the vibrating displacement (δ). The generated polarization resulted in the current (I), which was amplified by a charge amplifier (Brüel & Kjær, type 2635, Nærum, Denmark) and then monitored by an oscilloscope (Agilent Technologies, DSO7104B, Santa Clara, CA) at a condition of 1GHz, 4GSa/s.
Figure 2.1. Schematic view of the experimental set-up.
According to Euler-Bernoulli beam theory, the strain gradient can be calculated as Eq. (2)
(
)
11
0 2
3 0
3
L x
x L
= −
(2.2)
The measured current, I, can be derived from the induced polarization P3.
3
2
I = fAP (2.3)
3 0 12
0
2
3 ( )
IL
fA L x
=
− (2.4)
where I is the current, f is the frequency, δ is the tip displacement, A is the electrode area, L0 is
the cantilever length, and x is the distance between the electrode and the clamped end.
In addition to the room temperature set-up, an extra thermal chamber built with a ceramic fiber blanket was included for flexoelectric measurements at elevated temperatures, as shown in Figure 2.1. Both the thermal couple (TC) and the infrared thermal meter (TM) were used to monitor the temperature inside the chamber. Hot air generated by a heat gun (Proheat, PH-1300, LaGrange, KY) was blown into the chamber for temperature control.
2.5.Results and discussion
2.5.1.Dielectric permittivity and piezoelectric coefficient
0 20 40 60 80 100 120 140 160 180 200 220 0 500 1000 1500 2000 2500 3000 3500 4000 Relative permit tivity ( r )
Temperature [°C]
0.1 KHz 1 KHz 10 KHz 100 KHz 1000 KHz 0.0 0.2 0.4 Loss ( )The temperature dependence of the dielectric permittivity is shown in Figure 2.2. The gradual decline in relative permittivity with respect to the temperature was observed, which corresponds with a previous report[85]. A derivation from classic Curie-Weiss behavior was noticed, which is mainly caused by the diffuse nature of the phase transition due to the addition of BZT[48], [85].
The measured d33 was about 39 pm/V, which reflects the residual ferroelectricity. (This value will be discussed later, along with the flexoelectric characterization at room temperature.) However, the piezoelectric contribution to the total electric output were further suppressed at the paraelectric phase as the temperature increased (~200 ºC), suggesting that the polarization output from the bending test described below would be dominated by the flexoelectric effect.
2.5.2.Flexoelectric coefficient of BT-8BZT
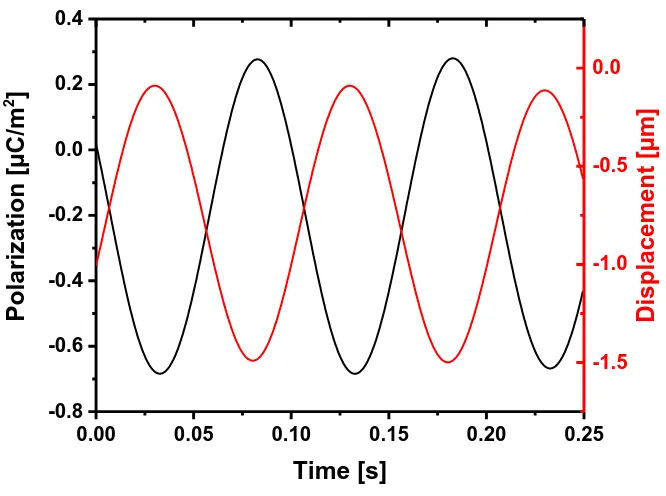
Figure 2.3. Electric polarization in response to mechanical displacement at 10 Hz.
0.00 0.05 0.10 0.15 0.20 0.25
-0.8 -0.6 -0.4 -0.2 0.0 0.2 0.4
Pol
arizat
ion
[µC/m
2 ]
Time [s]
-1.5 -1.0 -0.5 0.0
Disp
lace
men
t [
Figure 2.3 shows the real time charge output of BT-8BZT under a sinusoidal load with a peak-to-peak value of 1.5 µm at 10 Hz. It can be observed that the charge output is out-of-phase with the applied load. This is because the beam was bent downward, causing the strain gradient direction of the BT-8BZT to be opposite to the electrode connection polarity. The noise was eliminated by a bandpass filter (5~15Hz) in signal processing. At the same time, compared to piezoelectricity and flexoelectricity, the associated electrostrictive effect is of the quadratic dependence of the field, which is featured with a higher frequency (2f), 20 Hz in this case, than the exciting signal (f), which is 10 Hz, so that it would not interfere with the flexoelectric signal.
0.01 0.02 0.03 0.04 0.05 0.8
1.0 1.2 1.4 1.6 1.8 2.0 2.2 2.4 2.6
Strain gradient [m
-1]
Polariza
tion
[µC/m
2
]
Figure 2.4. Flexoelectric polarization as a function of applied strain gradient at room temperature
effective d33 is converted from 12 to be ~67 pm/V[9]. Because the Curie temperature of BT-8BZT is close to the room temperature, there is still the remnant piezoelectric contribution. Compared to d33 value (39 pm/V) from the direct measurement mentioned earlier, the flexoelectric contribution to the effective mechanical-electrical coupling d33 is comparable to
the part from remnant piezoelectricity at room temperature.
2.5.3.Temperature variation of flexoelectric coefficient of BT-8BZT
Figure 2.5. Temperature dependence of the transverse flexoelectric coefficient of BST and BT-8BZT.
Both BST and BT-8BZT cantilever beams were tested at temperatures ranged from room temperature to 200 ºC, where both materials were in the paraelectric phase. The calculated 12 of BST and BT-8BZT are plotted in Figure 2.5. Both BST and BT-8BZT have high flexoelectric coefficients, 25 µC/m and 22 µC/m at 25 ºC, respectively. In BST, an increase in temperature brings the flexoelectricity down rapidly, while the flexoelectric coefficient of BT-8BZT changes
20 40 60 80 100 120 140 160 180 200 220 -5
0 5 10 15 20 25 30
Temperature [°C]
BT-8BZT
BST
µ 12
[µC/m
more gradually. As the result, the flexoelectric coefficient 12 of BT-8BZT remains around 12 µC/m at 200 ºC, while 12 of BST is less than 3 µC/m at 200 ºC. Since the temperature range is above the Curie temperature, weak macro-ferroelectric regions may exist due to the presence of local nano-domains which gradually disappear as the temperature is increased.
20 40 60 80 100 120 140 160 180 200 220
0 10 20 30 40
d
33
[pm/V]
Temperature [°C]
Figure 2.6. Temperature dependence of the piezoelectric coefficient d33of BT-8BZT.
To verify the disappearance of this residual ferroelectricity, the direct piezoelectric response of BT-8BZT was measured over the same temperature range and the data is shown in Figure 2.6. As indicated in the figure, the piezoelectric coefficient d33 decayed rapidly, which indicates that the piezoelectric effect eventually disappears in the paraelectric phase. Thus, the flexoelectric contribution at high temperatures dominates the mechanical-electrical coupling.
flexoelectric coefficient of BT-8BZT is attractive at both room temperature and elevated temperatures (e.g. 200 ºC).
Our experimental results showed there is relatively less variation of 12 in BT-8BZT compared with that of BST, which is known with the highest 12 among all reported ferroelectric materials. This finding is believed to correspond with the broad dielectric maximum associated with the diffuse phase transition exhibited by BT-8BZT[85]. Hence, the thermal dependence of flexoelectricity in BT-8BZT is much more stable than in BST. The previous work by Cross’s group[11] showed the flexoelectric coefficient exactly follows the temperature dependent dielectric properties. Our work with BT-8BZT again proved its flexoelectric ability and its dielectric permittivity are correlated in such materials. The broaden ferroelectric-paraelectric peak of BT-8BZT have enhanced the flexoelectric response with good temperature stability[87]. Furthermore, the thermal stability of enhanced flexoelectric response in BT-8BZT would provide a potential candidate for sensing and detecting under high temperatures.
2.6.Summary
The gradual decline of flexoelectric coefficient 12 with increasing temperature in BT-8BZT was reported in this chapter, confirming the advantage of a high dielectric permittivity of BT-8BZT in paraelectric phase. The measured flexoelectric coefficient 12 of BT-8BZT is 25 µC/m at 25 ºC and can remain above 12 µC/m at temperatures up to 200 ºC, which suggests potential applications for high temperature micro/nano-sensing. Other compositions in the BiMeO3
-BaTiO3 system exhibit temperature stable permittivity over a much wider range.[88] These
Chapter 3.Flexoelectric effect in a multilayer structure 3.1.Background
Flexoelectricity has been mostly reported for insulating ferroelectric materials such as BaTiO3, SrTiO3, BST, BT-8BST, SrTiO3, PMN-PT and polyvinylidene fluoride (PVDF).[11]– [13], [18], [22], [52], [71], [80], [89], [90] However, recently, it was found that some semiconducting materials can also yield polarization upon strain gradients, like the oxygen depleted BaTiO3 (BTO-δ), whose flexoelectric coefficient can reach up to 1 mC/m.[52] In Section 1.3.4, we discussed this research with Error! Reference source not found.. Due to the o xygen depletion process, BaTiO3 (BTO) became an n-type semiconductor where the surface was fully oxidized and capped by the thin insulating layer. The enhanced flexoelectricity was induced by the surface reduced layer, where the strong electric field was generated in the semiconducting BTO-δ under strain gradients.
Table 3.1. Flexoelectric coefficients of thin films Material µ1122 (µC/m) Substrate Thickness
PVDF 34.5;37.3 N/A 13.5 µm
BST 24.5 Si 130 nm
PbTiO3 ~0.2 DyScO3 30 nm
substrate. More recently, extremely thin flexoelectric films have been explored showing promising flexoelectricity.[91]
In this chapter, an experimental study on the flexoelectricity in Pt/BTO/Nb-doped SrTiO3 (MFS) heterojunctions is presented. A layer of 100 nm-thick BTO epitaxial thin film deposited on Nb 0.7wt% doped SrTiO3 (Nb:STO) substrate was prepared for the MFS heterojunction and
the flexoelectric coefficient of the BTO thin film was then extracted . A ferroelectric tunnel junction (FTJ) was formed by poling the BTO layer, resulting in a resistive switching memory. The flexoelectricity in the BTO thin film harnessed with the ferroelectricity was then studied to control multi-level polarization of the BTO thin film.
This chapter has some of previously published material authored by S.Huang as shown below. All previously published material was reprinted with permission from the publishers:
Huang, Shujin, Hei-Man Yau, Hyeonggeun Yu, Lu Qi, Franky So, Ji-Yan Dai, and Xiaoning Jiang. "Flexoelectricity in a metal/ferroelectric/semiconductor heterostructure." AIP advances 8, no. 6 (2018): 065321.
3.2.A metal/ferroelectric/semiconductor heterostructure
clear whether flexoelectricity played a role in the mechanism of resistive switching memory or not. It is worth to mention that the theoretical mechanism of flexoelectric impacts on ferroelectric switching was predicted using the Landau–Ginsburg–Devonshire phenomenological approach.[99], [100] When the external electrical field applied on the bending beam, the energy profile of the BTO thin film (20 nm) can be recovered. Thus, Zhou et al. predicted the switching mechanism in the epitaxial grown ferroelectric thin film[].
3.3.Fabrication of the heterostructure 3.3.1.Fabrication method
Pure Nb:STO
MFS heterostructure
BTO Pt In Nb:STO Au
Figure 3.1. Schematic illustration of the Pt/BTO/Nb:STO metal/ferroelectric/semiconductor heterostructure
heterostructure. Besides, indium electrode and Au electrode were pressed and sputtered to the structure, respectively, to ensure an ohmic contact formed with Nb:STO. The electrical output induced by mechanical bending within the MFS was monitored through a pair of wires connected to the Pt electrode and the Indium ohmic contact pad on the Nb:STO substrate.
Another pair of wire connections were made between the indium ohmic contact and the evaporated Au electrode on the bottom side of Nb:STO substrate, which will be used to monitor the electrical response induced purely from the Nb:STO substrate upon mechanical bending.
3.3.2.Material characterization
Figure 3.2. Schematic description of the polarization directions induced by bending the sample or by applying an electric field, and the corresponding band diagrams of the MFS structure.
is poled as low resistance state by applying a positive voltage (8 V) to the Pt electrode; (C) & (D) represent the ferroelectric layer is poled as high resistance state by applying a negative voltage (-10 V). The mechanical bending direction is shown as the beam deformation. The blue, red, and green arrows denote the flexoelectric, ferroelectric and piezoelectric polarization direction, respectively. A rectangular barrier in the band diagram, denoted by the dashed and solid lines, is assumed before and after the ferroelectric layer is poled, respectively. The arrow in the barrier indicates the dipole induced by ferroelectric (red), flexoelectric (blue), piezoelectric (green), respectively. Therefore, four different polarization states are demonstrated by combining ferroelectric, piezoelectric and flexoelectric polarization as shown in Figure 3.2.
3.4.Experimental Method 3.4.1.Experimental set-up
Figure 3.3. The experimental set-up for electrical polarization measurement.
an excitation frequency of 10 Hz along with a power amplifier (Brüel & Kjær, type 2706, Nærum, Denmark). The displacement of the deflected end was measured using a laser vibrometer (Polytec, OFV-5000), which was connected to an oscilloscope (Agilent model DSO7104B). For a simple cantilever, the induced electrical polarization is represented by:
3 12 31
xx
xx s z
P d P
x
= + +
(3.1)
where the first term is the flexoelectric polarization, the second term is the piezoelectric polarization and the last term is the ferroelectric polarization. To achieve the controllably bending in two opposite directions, the same displacement of the deflected end was reached by monitoring through the laser vibrometer.
A lock-in amplifier (Stanford Research System Model SR830) was used to record the electrical polarization current induced by bending, for both sets of electrodes. A semiconductor characterization system (Keneith model 4200-SCS) was used to record the capacitance change of the MFS structure upon bending. Similar tests were also conducted at elevated temperatures using a set-up described in our previous work.[50] The temperature range was set to be between 70 ºC and 160 ºC.
3.5.Results and discussion
3.5.1.Characteristics of MFS heterostructure
To determine the ferroelectric polarization of the MFS structure, the resistance switching effect was tested by measuring current change when external pulsed-train writing voltages were used in the sequence illustrated with a step of 0.2 V, and the read voltage remained unchanged as Vread of 0.5 V. The positive voltage pulse drives the BTO polarization pointing to NSTO
the bottom electrode is grounded). The Pt/BTO/NSTO device is set to the OFF state by applying a negative pulse, which switches the polarization towards the Pt electrode.
0 2 4 6 8 10
1 2 3 4 5 6 7 8 9 10
Vwrite = -10V Vwrite = 8V
Curr
ent
(n
A)
Trials
Figure 3.4. Current-voltage characteristics of MFS structure before bending.
The results, as shown in Figure 3.4, suggest that the resistance can be varied by applying an external electric field. By sweeping the writing voltage from 8 V to -10 V, two resistance states are obtained. A low resistance state (LRS) is obtained when a positive voltage (8 V) is applied to the Pt electrode while a high resistance state (HRS) is achieved when -10 V is applied. Figure 3.4 shows the two distinct current states obtained at 0.5 V after poling the ferroelectric layer at positive (red) and negative (black) voltages, which confirms the non-volatile resistance switching of the MFS heterojunction.[98]
3.5.2.Flexoelectricity
Apart from the ferroelectric effect, the piezoelectric response was checked by measuring the
d33 value via the piezoelectric d33 meter (Institute of Acoustics Academia Sinica, Model ZJ-3D).
d31. The d31 is proportional to the effective d33 with the square of the length-to-thickness ratio.
Since the length-to-thickness ratio of the BTO thin film is in the order of 105, the transverse piezoelectric coefficient d31 is extremely small (ten orders smaller than the effective d33).[9] Thus,
the piezoelectric polarization was neglected throughout the experiment.
0.020 0.025 0.030 0.035 0.040 0.045 0.050 5
10 15 20
Pola
rization (
C/m
2 )
Strain Gradients (m-1)
A 385 C/m B 418 C/m C 339 C/m D 287 C/m
Figure 3.5. Induced polarization as a function of strain gradients
set at LRS and HRS, respectively. Even though the mechanical bending direction is the same, the flexoelectric coefficients were different due to the ferroelectric polarization from a capacitor.
3.5.3.Capacitance
To understand the different polarization states and interpret the variation of flexoelectric coefficients, the capacitance of the MFS structure for the four different cases (A, B, C, and D) was measured under an accumulation mode (positive bias applied to the Pt electrode) as shown in Figure 3.6.
A B C D
0.0 0.5 1.0 1.5 2.0 2.5 3.0 3.5
Capa
citance (nF)
Left Bar: No bent Right Bar: Bent
Figure 3.6. the capacitance for the four different states induced by combining the ferroelectric polarization with the flexoelectric polarization. The error bars in (b) are added under a calculation of capacitance for 4 samples. A, B, C and D indicate four different combination of
polarizations in Figure 3.3 accordingly.


![Figure 1.3. Shear mode measurement for PVDF[17]](https://thumb-us.123doks.com/thumbv2/123dok_us/1734412.1221653/24.612.138.476.161.397/figure-shear-mode-measurement-for-pvdf.webp)