Vol. 4, Issue 3, March 2015
Multi-Input Multi-Channel Analyzer
(MIMCA) Using Universal FPGA Board
Hery Andrianiaina1*, Heinz Rongen2, Raoelina Andriambololona3, Gérard Rambolamanana4, Jean-Baptiste Ratongasoandrazana5
P.G. Student, Department of Maintenance and Instrumentation, INSTN-Madagascar, Antananarivo, Madagascar 1* Dr, Zentralinstitut für ElektronikInstitut (ZEL), Forschungszentrum Jülich, 52425 Jülich Germany 2 Full Professor, Department of Theoretical Physics, INSTN-Madagascar, B.P.4279, Antananarivo, Madagascar 3 Full Professor,Institut Observatoire et Géophysique d’Antananarivo (IOGA), University of Antananarivo, Madagascar4
P.G. Student, Department of Maintenance and Instrumentation, INSTN-Madagascar, Antananarivo, Madagascar 5 *Corresponding author
ABSTRACT: Instrumentation for nuclear applications is developing very fast, due to fast changing of technology in electronics in connection to Moore’s Prediction (“doubling of transistor density integration on an IC for every two years”). The maintenance concept has changed accordingly and moved from repairing at electronic component level to software solving approach, which leads to customize application to fit the local needs. Therefore, Madagascar-INSTN has developed some R&D projects in instrumentation to support and fit to the local needs: one example is the FPGA-based Multi-Input Multi-Channel Analyzer using the UNIO52 standard board from Jülich, which could be used to strengthen the capability and speed-up the routine for radionuclide measurement and analysis of samples. The test results of the MIMCA performance (Linearity, Count-rate accuracy tests) show that the configurable digital system can be used as an alternative issue compared to branded acquisition equipments, which are very expensive and limited technical support from supplier.
KEYWORDS:Pulse Height Analysis, ADC, Multi-Channel Analyzer, FPGA, MIMCA.
I. INTRODUCTION
According to the By-law n° 3961/93, all foodstuffs must be controlled by the Madagascar-INSTN, and must have a non-radioactive certificate, prior to the selling. In that case, the level of radioactivity, especially for artificial radionuclide, must be below the legally accepted values. The INSTN has set up an agreement with the Trade Ministry, from January 1997 regarding the implementation of the regulation.
Mainly the rate of radioactive contaminating element is very low; therefore the sample analysis needs a long time for measurement. As a matter of business, customers need to have their certificate to be delivered as rapid as possible, to allow fast clearance of their goods. Using a multiple set of equipments would need more investment and would cost a lot in case of dedicated and branded instruments (Germanium detector with thick lead shield coupled with MCA). This paper shows the use of a low-cost universal acquisition board to build a Multi-Channel Analyzer with multi-inputs to monitor in parallel up to four samples
II. RELATED WORK
Vol. 4, Issue 3, March 2015
In the meantime associated electronics used for gamma spectrometry system have been gradually improved from simple counter, to single channel analyser (SCA), and to multichannel analyser (MCA).
The MCA has also been improved throughout the years, from the conventional single-package MCA to the computer-controlled MCA. Most of the MCA systems today use computers to control the spectroscopy hardware and to emulate the functions of the MCAs [2].
EG&G Ortec introduce in late 1996 a digital gamma-ray spectrometer (DSPec) which uses digital technology to process with the pulses from preamplifier and become the way of future gamma-ray spectroscopy.
The energy resolution with DSPec has been shown to be about the same as that using analog processing technology with the NIM system [3]. The resolution and throughput performance of the three DSP systems are much better than those of the analog NIM system [4]
Any DSP system is associated with one FPGA family, such as from Xilinx. The UNIO52 board is using Xilinx XC2S150 as FPGA chip, MCA implementation and performance of which were studied and are shown in this paper.
III.FPGA-BASED MULTI-CHANNEL ANALYZER
1. Multi-Channel Analyzer (MCA)
There are various methods of measuring amplitude of pulses depending of the application, but single channel analysis (SCA) and multi-channel analysis (MCA) methods are mostly used.
Single Channel Analyzer (SCA) is used for counting the number of incoming radiation at selected energy range [5], with two adjustable levels. Only pulses with amplitude falling in between the two levels are counted. Input pulses are observed by two discriminators set at LL (Lower Level) and UL (Upper Level) respectively. MCA method has to be used to have the distribution of pulse heights.
Due to the rapid development and integration, applied in electronic technology, FPGAs (Field Programmable Gate Array) are utilized in many applications to control or to process signals, and are nowadays used in most of nuclear instruments. FPGAs are semiconductor devices containing programmable logic and programmable interconnects.
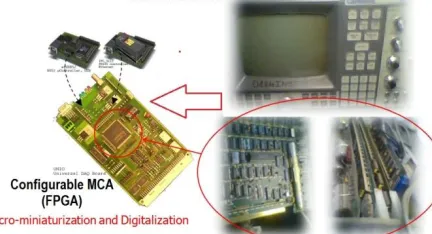
Fig. 1: Miniaturization and Digitization of MCA Canberra series 35 plus electronics
Fig.1 shows an example of refurbishing (miniaturization and digitization) older MCA system with many discrete components and boards, using tiny board with single FPGA, which is integrating all needed hardware to emulate the MCA function.
2. FPGA-based Pulse Height Analysis (PHA) system
Vol. 4, Issue 3, March 2015
Fig. 2: Pulse Height Detection State Machine
The sampling of input data signal is continuing until the signals goes lower than Lowest Lower Level reference value (sMcaLLL) or the number of sampled points is more than sMaxPulsLen [6]. During the pulse sampling, the FPGA always compares the current value (sMcaPeak) against the last value and holds in a register the maximum of the values (sMcaPeakMax). So after the signal goes lower than Lowest Lower Level this register holds the Pulse maximum. The registered pulse maximum is now compared with Upper Level (sMcaUL). In the case the pulse maximum is greater than Upper Level or the registered pulse length exceeds the maximum length, the pulse will be discarded; if not, an Interrupt for the microcontroller is generated so that the µC can readout the Event-Maximum.
IV.THE MULTI-INPUT MULTI-CHANNEL ANALYZER
The system is based on the universal data-acquisition board UNIO52 and LabVIEW graphical programming language for the programming of the application software.
A. Configuration of MIMCA onto UNIO52 FPGA board
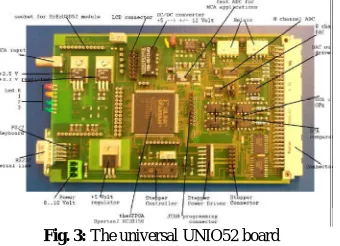
The UnIO52 board (see Fig.3) was developed as a universal data-acquisition and processing board and can be used in nuclear instrumentation applications.
Fig. 3: The universal UNIO52 board
Vol. 4, Issue 3, March 2015
Fig. 4: UNIO52 and USB controller block diagram
All these components are programmable by the user. Therefore this is an ideal platform for the development of a dedicated instrument.
Logic blocks have also been configured to perform drift control due to voltage or temperature shifting and other complex digital functions such as a peak finder (needed in nuclear instruments) and mathematical functions.
B. The MIMCA complete system
The firmware application code for the ezUSB controller board was developed with Keil C-compiler. The host PC software was designed in the sense that there is a central control for the 4 MCA channel for setting the threshold levels, starting, stopping, clearing the MCA, etc.
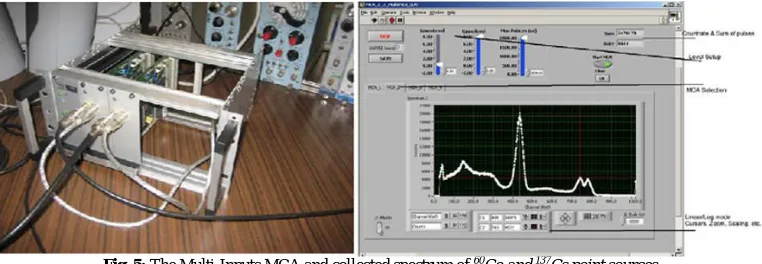
Configured UNIO52 boards are assembled in a small 19” Rack, together with 5Volt power supply. In Fig.5, one can see both USB cables which are fed via a USB hub as one single connection to the PC. The two analog inputs are connected by BNC cables. In the background the nuclear test pulser and a detector system can be seen.
Fig. 5: The Multi-Inputs MCA and collected spectrum of 60Co and 137Cs point sources
The 4 spectra’s are shown in 4 graphs which placed in a tab control. By clicking on the “MCA Selection” one of the 4 tabs are selected to show the spectra of the according MCA channel. The MCA’s have a resolution of 1024 channels which were tested with a nuclear pulser. Collected data can be stored to hard disc and can be read by other computing or visualization software such as Matlab and Excel.
V. EXPERIMENTAL RESULTS
Vol. 4, Issue 3, March 2015
A. Automatic Peak Search
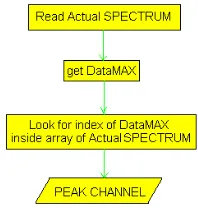
An algorithm to latch “Previous integral spectrum” and subtract it from the “new integral spectrum” is implemented with the analyzing software tools. This is to isolate “actual spectrum” from the “integral spectrum”, and will give information about peak channel shifting depending on the amplitude of the analog input signal, according to the algorithm in Fig.6.
Figure 6: Automatic Peak Search algorithm
This “Automatic Peak Search” function is useful for linearity testing and resolution measurement of the system.
B. Linearity and Accuracy
The main part of a Multi-Channel Analyzer system (MCA), which makes possible the dialogue between the real world of analog quantities (charges released by detector) and digital electronic system is the ADC. The analog-to-digital conversion (ADC) consists of subdividing the input signal range (between
V
MINandV
MAX) intoN
equal parts (idealADC), and assigning the input signal amplitude
V
i to a channel.1. Linearity
a) Integral Non-Linearity (INL)
With MCA system, precise energy calibration of a spectrum depends on the linearity of the system. For further data processing in the ideal case the linearity should be as a straight line. Set of pulses with defined amplitudes has been fed to the input of the MIMCA.
The Integral Non-Linearity is given as the maximum channel deviation from the estimated linear regression approximation
CH
MAXexpressed in percent of the total number of channelN
[7]:100
(%)
N
CH
INL
MaxFig. 7: Set-up for INL Test
Vol. 4, Issue 3, March 2015
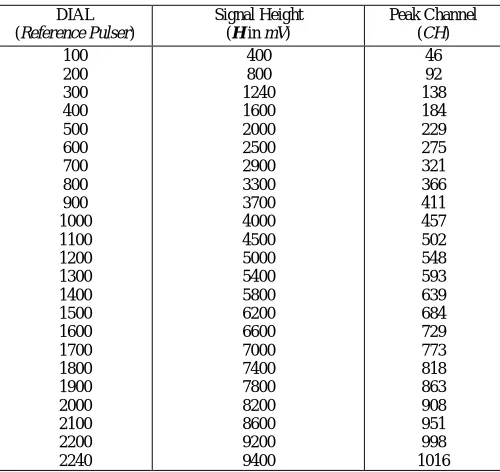
Table 1: Peak Height Channel Distribution of MIMCA
DIAL (Reference Pulser)
Signal Height (H in mV)
Peak Channel (CH) 100 200 300 400 500 600 700 800 900 1000 1100 1200 1300 1400 1500 1600 1700 1800 1900 2000 2100 2200 2240 400 800 1240 1600 2000 2500 2900 3300 3700 4000 4500 5000 5400 5800 6200 6600 7000 7400 7800 8200 8600 9200 9400 46 92 138 184 229 275 321 366 411 457 502 548 593 639 684 729 773 818 863 908 951 998 1016
For linear regression approximation of the above collected data (channel [CH] function of signal height [H]), the estimated curve equation is the following:
4389
.
7
]
[
1089
.
0
]
[
CH
H
The calculated integral non-linearity values (10% to 90% of full range) are then +0.7% and -0.6% [6].
b) Differential Non-Linearity (DNL)
For ideal system, each channel should have exactly the same width, and will reproduce the amplitude of the incoming signal in an accurate manner. DNL test has been performed using input signal from "sweeping pulser" (precision pulse modulated by triangular signal).
Fig. 8: Hardware set-up for DNL test
The hardware setting up for DNL testing is shown in Fig.8, and configured as follows:
Period of ramp generator set to 50sec
Pulse generator switched to external reference source, repetition rate to 10kHz
Vol. 4, Issue 3, March 2015
Collecting counts over a long period of time (sufficient so that statistical fluctuation can be neglected to the measurement of channel profile), would result uniform and flat distribution of counts in all channels for linear system. Deviation from that uniformity, measures the DNL (expressed in percent) of the MIMCA:
100
(%)
C
DNL
C
: Mean value of counts
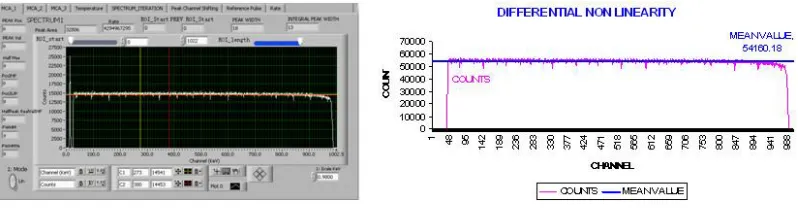
: Standard deviationFig.9 shows the result for an overnight measurement (according to the IEC standard 659), which gives a mean value of
54160 counts for each channel. The standard deviation from the mean is 1236 counts, and the calculated DNL is then
+/-2.3%.
Fig. 9: Displayed DNL test result
2. Count-rate and Peak Resolution Performance a) Count-rate performance:
For an ideal MCA, all pulses with the same amplitude are stored in one channel, and independent of the count rate. Fig.10 shows the set-up configuration for testing of the count-rate performance, where the output of a Random Pulse Generator is connected to the spectroscopy amplifier (CANBERRA model 2020), which feed the MIMCA system.
Fig. 10: Test set-up for count-rate performance
The Trigger output of the Random Pulse Generator is also connected to a Counter/Timer (CANBERRA model 1776) to serve as reference.
Vol. 4, Issue 3, March 2015
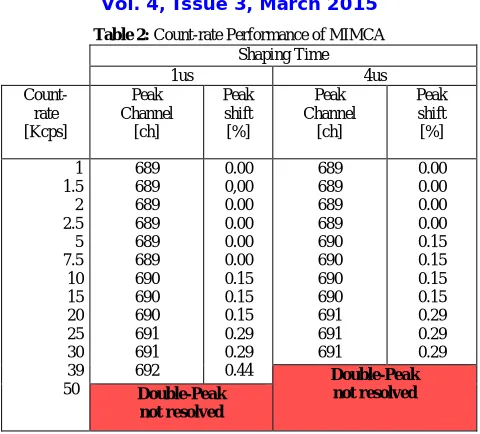
Table 2: Count-rate Performance of MIMCA Shaping Time
1us 4us
Count- rate [Kcps] Peak Channel [ch] Peak shift [%] Peak Channel [ch] Peak shift [%] 1 1.5 2 2.5 5 7.5 10 15 20 25 30 39 50 689 689 689 689 689 689 690 690 690 691 691 692 0.00 0,00 0.00 0.00 0.00 0.00 0.15 0.15 0.15 0.29 0.29 0.44 689 689 689 689 690 690 690 690 691 691 691 0.00 0.00 0.00 0.00 0.15 0.15 0.15 0.15 0.29 0.29 0.29 Double-Peak not resolved Double-Peak not resolved
Fig.11 shows the effect of the count-rate to the resolution of the peak by the system, for an input reference signal of
4volts height and with 1μs and 4μs shaping time.
Fig. 11: Resolved Peak channel vs. count-rate and shaping of input signal
b) Peak resolution
The FWHM resolution of the 137Cs peak, from collected spectrum within the MIMCA shown in Fig.12 is 21.38%.For comparison, typical FWHM for a MCA35+ CANBERRA system is around 7%.
One of the reason of such difference may be due to the memory limitation made available within the UNIO52 board, which allow only 1K MCA channel resolution
Vol. 4, Issue 3, March 2015
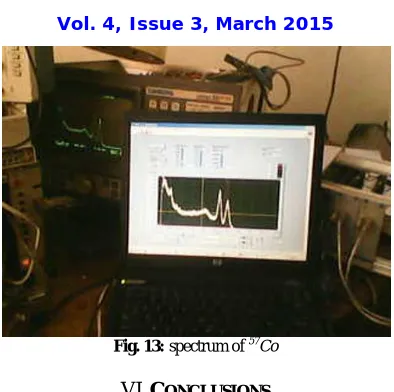
Fig. 13: spectrum of 57Co
VI.CONCLUSIONS
The performance test results show that the built MIMCA (Multi-input MCA) system can used to replace and refurbish dedicated, but expensive Multi-Channel Analyzer.
The peak resolution within the MIMCA system (21.38% for 137Cs peak) seems to be worse if compared of those of CANBERRA’s (typical FWHM for a MCA35+ CANBERRA system is around 7 %). But the system performance is very sufficient for qualitative analysis of sample.
Some blocks are still needed to be configured into the UNIO52 board to get full functions of a MCA (Pile-up rejection and dead time correction). Other research projects are scheduled to be done in order to use the development system in nuclear instrumentation improvement (FWHM with low cost spectrometry system).
VII. ACKNOWLEDGEMENT
Authors wish to extend their great appreciation to:
The INSTN-Madagascar for setting up the program on refurbishment of scientific equipments, and which gives results to the present work,
The International Atomic Energy Agency (IAEA-Vienna) for the technical assistance offered through the project MAG/4/004, and supporting with equipments, kits, fellowships and expert missions.
REFERENCES
[1] D.C. Brock, G. E. Moore, “Understanding Moore’s Law: Four Decades of Innovation”, Chemical Heritage Foundation, 2006.
[2] D.T. Vo, “Evaluating the Commercial Spectrometer Systems for Safeguards Applications Using Germanium Detectors”, Los Alamos National Laboratory, NM 87545.
[3] D.T. Vo, P.A. Russo, and T.E. Sampson, “Comparisons Between Digital Gamma-Ray Spectrometer (DSPEC) and Standard Nuclear Instrumentation Methods (NIM) Systems”, Los Alamos National Laboratory report LA-13393-MS, March 1998.
[4] D.T. Vo, P.A. Russo, “Comparisons of the Portable Digital Spectrometer Systems”, Los Alamos National Lab (LA-13895-MS, Issued Feb. 2002).
[5] IAEA-TECDOC 426, "Troubleshooting in Nuclear Instruments", 1987.
[6] H.Andrianiaina, Raoelina Andriambololona, J.Rajaobelison, G.Rambolamanana, H.Rongen “FPGA-based technology for Pulse Height Analysis in nuclear spectrometry system” In Proceedings of the HEPMAD’09 Conference in Antananarivo, 22-28 August 2009 (SLAC).
Vol. 4, Issue 3, March 2015
BIOGRAPHY
Hery Andrianiaina: received the B.S. and M.S. degrees in Nuclear and Applied Physics from the University of Toliara in 1986 and the University of Antananarivo with collaboration of INSTN-Madagascar in 1999, respectively. Since 1994 up to now, he is the Head of the Maintenance and Instrumentation Department at INSTN-Madagascar, and involved on Research and Development activities in nuclear instrumentation.
Dr. Heinz Röngen: belongs to the “Systeme der Elektronik (ZEA-2)” research group at the Forschungszentrum Jülich. He is working in many projects on Sensor and signal processing systems, and Earth's observation systems (such as the GLObal Limb Radiance Imager of the Atmosphere or GLORIA project, the KOMPSat-3 which is a lightweight Earth observation satellite). He is an owner of some patents on electronic device for measuring biomedical data, and author of many scientific papers.
Prof. Raoelina Andriambololona: Full Professor, Founder and Director General of INSTN-Madagascar. He is fellow of many learned scientific societies and academics, The World Academy of Sciences for Developing Countries (TWAS), African Academy of Sciences (AAS), New York Academy, Malagasy Academy, American Physical Society, etc.. He is the author of many, about 250, scientific papers and of 2 university books in Mathematics and Quantum Mechanics. He has served as expert of IAEA, UNESCO, and OAU.
Prof. Gérard Rambolamanana: Full Professor of Geophysics, Seismology, Acoustics and Electronics at the University of Antananarivo, Madagascar. He is the Head of the Laboratory of Seismology and Infrasound at the Institute Observatory of Geophysics of Antananarivo (IOGA), at the University of Antananarivo, and has been the Director of the IOGA since 2009. He has been involved in the Square Kilometer Array (SKA) in South Africa since 2009, and worked with the CTBTO since 2011. From 1992 to 2008 he was a Regular Associate then a Senior Associate at the International Centre for Theoretical Physics in Trieste, Italy. He is the author and co-author of several scientific papers related to seismology and infrasound in Madagascar.