Copyright1999 by the Genetics Society of America
Molecular Evolution of Two Linked Genes,
Est-6
and
Sod
,
in
Drosophila melanogaster
Evgeniy S. Balakirev,*
,†,‡Elena I. Balakirev,* Francisco Rodrı´guez-Trelles*
,§and Francisco J. Ayala*
*Department of Ecology and Evolutionary Biology, University of California, Irvine, California 92697-2525,†Institute of Marine Biology, Vladivostok 690041, Russia,‡Department of General Biology, Ecology and Soils, Far Eastern State University, Vladivostok 690600, Russia
and§Departament de Gene´tica, Universitat Auto´noma de Barcelona, 08193 Bellaterra (Barcelona), Spain Manuscript received June 7, 1999
Accepted for publication July 22, 1999
ABSTRACT
We have obtained 15 sequences of Est-6 from a natural population of Drosophila melanogaster to test whether linkage disequilibrium exists between Est-6 and the closely linked Sod, and whether natural selection may be involved. An early experiment with allozymes had shown linkage disequilibrium between these two loci, while none was detected between other gene pairs. The Sod sequences for the same 15 haplotypes were obtained previously. The two genes exhibit similar levels of nucleotide polymorphism, but the patterns are different. In Est-6, there are nine amino acid replacement polymorphisms, one of which accounts for the S-F allozyme polymorphism. In Sod, there is only one replacement polymorphism, which corresponds to the S-F allozyme polymorphism. The transversion/transition ratio is more than five times larger in Sod than in Est-6. At the nucleotide level, the S and F alleles of Est-6 make up two allele families that are quite different from each other, while there is relatively little variation within each of them. There are also two families of alleles in Sod, one consisting of a subset of F alleles, and the other consisting of another subset of F alleles, designed F(A), plus all the S alleles. The Sod F(A) and S alleles are completely or nearly identical in nucleotide sequence, except for the replacement mutation that accounts for the allozyme difference. The two allele families have independent evolutionary histories in the two genes. There are traces of statistically significant linkage disequilibrium between the two genes that, we suggest, may have arisen as a consequence of selection favoring one particular sequence at each locus.
T
HE understanding of the genome as an aggregate The evidence for linkage disequilibrium between indi-of relatively independent genes (bean-bag genetics) vidual loci remains scarce, except when genes are very was a feature of the classical period of genetics. Gene closely linked or associated with chromosomal inver-interaction (epistasis) played a primary role in the the- sions (reviewed byLangley1977;Hedricket al. 1978;ory of evolution starting in the 1920s (Wright 1931; Barker1979;KrimbasandPowell1993). In the cases Dobzhansky 1937; Schmalhausen 1946; Mather when significant associations have been detected, it is 1953;Waddington1957;Mayr1963). Linkage disequi- often far from clear whether they are caused by nonran-librium and nonrandom associations between alleles or dom haplotype sampling, random genetic drift, or natu-groups of nucleotides may indicate epistatic relation- ral selection (Mukaiet al. 1974; Mukaiand Voelker ships, and much empirical work has been devoted over 1977). Significant disequilibrium can indeed arise with-several decades to demonstrate that linkage disequilib- out epistasis as a result of random genetic drift within rium occurs between nonallelic genes. The issue of gene a given population (HillandRobertson1968;Ohta interaction is also important in connection with the andKimura 1969a,b;Hill1975, 1976), in subdivided long-lasting neutralist-selectionist controversy that has populations (NeiandLi1973;LiandNei1974; Feld-generated much research in population genetics for man andChristiansen1975; Ohta1982a,b), and by nearly 30 years (Kimura1968, 1983;KimuraandOhta founder effects (AveryandHill1979).
1971;Ayalaet al. 1971, 1972a,b; Lewontin1974; and Numerous examples of significant linkage disequilib-many others). Linkage disequilibrium is often consid- rium have been discovered in Drosophila between spe-ered strong evidence supporting the selectionist posi- cific allozymes and chromosomal inversions, which have tion, especially if its pattern is consistent between popu- been interpreted as reflecting selection for favored lations (Lewontin1974). multilocus allele combinations (Prakashand Lewon-tin 1968;Prakash 1974;Zouros1976;Voelkeret al.
1978). Ishiiand Charlesworth(1977) and Neiand
Corresponding author: Francisco J. Ayala, Department of Ecology and
Li(1980) have, however, shown that nonrandom associ-Evolutionary Biology, 321 Steinhaus Hall, University of California,
Irvine, CA 92697-2525. E-mail: [email protected] ations between allozymes and inversions can be
plained by absence or limited recombination without a set of 15 haplotypes from a natural population in California.
selection (as a consequence of chance and insufficient time for associations generated by mutation to decay by recombination and gene conversion). The inference
MATERIALS AND METHODS from the allozyme studies is, therefore, that linkage
disequilibrium is mostly associated with closely linked Drosophila strains:The 15 D. melanogaster strains were de-rived from wild flies collected by F. J. Ayala (October 1991) genes, but may involve distantly linked genes when
spe-in El Rio Vspe-ineyard (Acampo, CA). The straspe-ins were made fully cial cytological mechanisms (polymorphic inversions)
homozygous for the third chromosome by means of crosses allow it to exist. Allozyme loci that can recombine freely
with balancer stocks, as described by Seager and Ayala
exhibit little, if any, linkage disequilibrium. Failure to (1982). The homozygous strains were named in accordance detect disequilibrium may, of course, be a consequence with the Cu,Zn superoxide dismutase (SOD) electrophoretic allele they carry, Fast (F) or Slow (S), as follows: 255S, 438S, of the limited statistical power of the tests to detect it
510S, 521S, 94F, 174F, 377F, 483F, 498F, 521F, 565F, 581F, (Brown 1975), which might be overcome by using
968F, 517S, and 357F. The Sod gene sequence of these strains larger sample sizes and combining probabilities from
has been investigated previously in our laboratory (Hudson
independent tests (Brown1975;ZapataandAlvarez et al. 1994, 1997).
1992, 1993). Allozyme electrophoresis:Twenty flies from each D. melano-gaster strain were homogenized in 20ml 0.1mTris-HCl buffer, The introduction of DNA sequencing and other
molecu-pH 8.0. The homogenates were electrophoresed for 8–9 hr lar techniques in population studies makes it possible to
using a Tris-borate-EDTA continuous buffer system, pH 8.6 gain considerable information about linkage
disequilib-(Markertand Faulhaber1965) at 100 V in a 11% starch rium. Nonrandom associations have been detected be- gel. The gels were stained for esterase-6 (EST-6) activity ac-tween polymorphic sites of Adh, Adh-Dup (Schaeffer cording to standard procedures (Manchenko 1994). See
Ayalaet al. (1972b) for additional details. andMiller1993), and Est-5B (VeuilleandKing1995)
DNA extraction, amplification, and sequencing:Total geno-in Drosophila pseudoobscura; vermilion (Begunand
Aqua-mic DNA was extracted using the procedure described by dro1995) and G6pd (Eaneset al. 1996) in D. simulans;
Palumbiet al. (1991).
and the following in D. melanogaster : Adh and Adh-Dup We used the Est-6 sequence, previously published byCollet (KreitmanandHudson 1991), vermilion (Begunand et al. (1990), for designing PCR and sequence primers. The amplified fragments (2017 bp long) included 56 bp of the 59 -Aquadro1995), Pgd (BegunandAquadro1994), white
flanking region, the Est-6 gene, the intergenic region, and 82 (Kirbyand Stephan 1995, 1996), G6pd (Eanes et al.
bp of thecEst-6 gene (Figure 1). ThecEst-6 gene has been 1996), dpp (Richteret al. 1997), Acp70A (Cireraand
referred to in the literature as Est-P, but the evidence indicates Aguade´1997), period (Rosatoet al. 1997), and Acp26Aa that it is a pseudogene (BalakirevandAyala1996).
and Acp26Ab (Aguade´ 1998). But, as in the case with The two primers used for the PCR amplification reactions (1 and 2, Figure 1) were 59-gcaattgccgcatctcaagatagt-39(forward allozymes, a positive correlation between the presence
primer) and 59-caacaatcaagggatcagcttcag-39(reverse primer). of chromosome inversions and the extent of linkage
All PCR reactions were carried out, as described by
Kwiatow-disequilibrium is often the case (Aquadro 1993, and
skiet al. (1991), in final volumes of 100ml containing 40mm references therein). Nevertheless, DNA linkage disequi- each of dNTP, 2.5 units of AmpliTaq DNA Polymerase (Perkin librium between nucleotide sites is well established in Elmer, Norwalk, CT), 0.2 mm each of forward and reverse primers, buffer (Perkin Elmer) at a final concentration of 10 some cases, as well as the fact that it reflects epistatic
mmTris-HCl (pH 8.3), 50 mmKCl, 1.5 mmMgCl2, andz50 ng relationships (Kirby et al. 1995; Kirby and Stephan
of template (total genomic) DNA. The mixtures were overlaid 1996), although the nature of the epistatic interactions
with mineral oil, placed in a DNA thermal cycler (Perkin between genes remains enigmatic. Elmer), incubated 5 min at 958, and subjected to multiple In this article, we investigate the nucleotide polymor- cycles of denaturation, annealing, and extension under the following conditions: 958 for 1 min, 568 for 1 min, and 728 phisms in the Est-6 and Sod genes of D. melanogaster and
for 2 min (for the first cycle and progressively adding 3 sec compare them in the two genes, seeking to identify
at 728 for every subsequent cycle). After 30 cycles, a final processes that contribute to the polymorphisms. We
7-min extension period at 728concluded each amplification test whether linkage disequilibrium may occur between reaction. Samples were stored at 48 for several hours or at these two fairly closely linked genes, as has been inti- 2208for up to 2 wk.
One-tenth of each reaction volume was assayed on a 0.8% mated by the results ofSmit-McBrideet al. (1988), who
agarose gel. If the desired PCR product was detected, the investigated natural and laboratory populations and
de-remainder volume of the reaction was purified with the Wizard tected linkage disequilibrium between the allozyme
PCR preps DNA purification system (Promega, Madison, WI). polymorphisms of Sod and Est-6, but not between any The purified PCR product was directly sequenced by the di-other gene pairs.Hudsonet al. (1994, 1997) have, more- deoxy chain termination technique (Sangeret al. 1977) using
Dye Terminator chemistry and separated with the ABI PRISM over, shown that a selective sweep has recently occurred
377 automated DNA sequencer (Perkin Elmer). For each line, involving a many-kilobases-long region that includes the
the sequences of both strands were determined. Eight internal
Sod gene. Est-6 and Sod are closely linked on the left
catcggatg-39, (d) 59-gatcttcatcgcaaatatgg-39, (a9) 59-tcacgcat may be considered as randomly selected with respect cacgttctcgtgtcc-39, (b9) 59-gcgtctggagcatccgatggctcc-39, (c9) 59- to their Est-6 alleles. Electrophoretic analysis reveals two tcgaatatcaaaaagtagtcgtc-39, and (d9) 59
-aaattccacatgctgcctattct-common EST-6 allozymes: Fast (357F and 517S strains) 39. The Est-6 sequences reported in this article have been
and Slow (255S, 438S, 510S, 521S, 94F, 174F, 377F, 483F, deposited in the GenBank sequence database library under
accession nos. AF147095–AF147102. 498F, 521F, 565F, 581F, and 968F strains). (The S or F For the Sod gene, we analyzed a region (1408 bp long) that in each strain’s designation refers to the SOD allele it included 43 bp of exon I, the intron (725 bp), exon II (396 bp), carries; seematerials and methods.)
and 244 bp of the 39flanking region. The DNA preparation,
Nucleotide polymorphism: The organization of the amplification, cloning, and sequencing procedures for the Sod
Est-6 gene is outlined in Figure 1. The sequenced region
gene are described byHudsonet al. (1994, 1997).
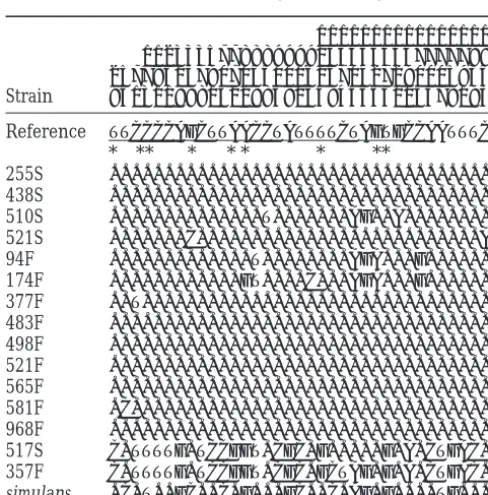
DNA sequence analysis: All primers were designed using is 1879 bp long, comprising the Est-6 gene and the 193 the computer program DNASIS for Windows (1994, Hitachi bp of the intergenic region between Est-6 andcEst-6. Software Engineering), which allows one to check the second- Table 1 displays the Est-6 polymorphisms observed in ary structure of primers. Multiple alignment was carried out
the 15 D. melanogaster strains. There are 35 nucleotide manually, using the program DARWIN (elaborated by Robert
polymorphic sites, 9 of which yield amino acid replace-Tyler from our laboratory), and automatically, using the
pro-gram CLUSTAL W (Thompson et al. 1994). Two DNA se- ments.
quences were obtained from the GenBank database: D. melano- Table 2 gives the values ofpandufor the two genes, gaster, Est-6 (accession no. M33780), and D. simulans, Sod Est-6 and Sod. The data for Sod are obtained from Hud-(accession no. X15685). The maximum parsimony analysis of
son et al. (1997). The overall nucleotide diversity is
the Est-6 and Sod sequences was performed with the computer
somewhat larger for Sod. However, the diversity is about program PAUP (Swofford 1993). The computer program
DNASP (RozasandRozas1997) was used to analyze the data the same for the coding or the noncoding regions con-by means of a “sliding window” (HudsonandKaplan1988) sidered separately (Sod has greater overall diversity be-and was used for most intraspecific analyses. cause the noncoding region is larger). The diversity, as
Linkage disequilibrium analysis: Linkage disequilibrium
expected, is much greater in the noncoding than in within and between Est-6 and Sod was evaluated using Fisher’s
the coding regions, reflecting the usual higher level of exact test and chi-square test for independence between sites.
Singleton polymorphisms (mutations appearing in only one functional constraint in the coding regions of genes. sampled allele) were omitted. Lewontin’s sign test, elaborated The distribution of polymorphic sites among the Sod especially for molecular sequence data (Lewontin1995), was haplotypes is extremely nonuniform: 69.6% of the Sod also used to test the significance of linkage disequilibrium
polymorphic sites are introduced by just two haplotypes between Est-6 and Sod, including singletons.Lewontin(1995)
(498F and 968F; see Hudson et al. 1994, 1997). It is
has shown that Fisher’s exact test is not sensitive in cases with
also quite polarized in the case of Est-6, with 62.9% of very asymmetrical distribution of allele frequencies, a situation
that is commonly observed in molecular sequence data, includ- the polymorphic sites resulting from two haplotypes, ing our data. In such a situation, there is, for numerical rea- 517S and 357F, which are the only two Est-6 F alleles in sons, very low probability of obtaining a significant test by
the sample (shown at the bottom of Table 1). When means of the usual two-by-two contingency tables (Fisher’s
these two pairs of sequences are removed, thepandu exact test or chi-square test). To overcome this problem,
Lew-values considerably decrease for both genes; but in the
ontin’s (1995) test is based on the distribution of the
disequi-librium sign (“sign” test), which allows the analysis of asymmet- coding region, the decrease is somewhat greater for rical allele frequency data to make inferences about overall Est-6 (Table 2). This difference may be due to different linkage disequilibrium. The procedure involves examining the selective constraints in the two genes, but it may also number of positive and negative D values for each polymorphic
reflect the different histories of the particular sets of site within and between all types of pairwise comparisons
(sin-alleles included in our analysis (seediscussion). gletons vs. singletons, singletons vs. doublets, doublets vs.
dou-blets, and so on; Lewontin 1995). The observed value, There are 26 polymorphic nucleotide sites (1.6%) in summed for a particular type of pairwise comparison, is com- the coding region of Est-6, but only 5 (1.1%) in Sod. pared with the expected value using a goodness-of-fit test (the In Est-6, the transversion/transition (Tv/Ts) ratio is likelihood ratio statistic, G-test).
3/2350.130, much lower than expected from random mutation, reflecting the usual selection effect against Tv. The Tv/Ts ratio for Sod is significantly higher than RESULTS
for Est-6 (2/3 5 0.667). The ratio of replacement to The genes Est-6 and Sod are on the left arm of chromo- synonymous segregating sites is lower for Sod (1/45 some 3 of D. melanogaster, genetically mapped at 35.9 0.250) than for Est-6 (9/1750.529). The Sod data of and 32.5 and located at 69A1-A5 and 68A8-A9 on the our study do not come from a random sample, since polytene chromosomes, respectively (Heinoet al. 1994). the number of S alleles was made intentionally larger Allozyme polymorphism: We have analyzed Est-6 in (33%) in the sample than would be expected in a ran-15 D. melanogaster strains, fully homozygous for the third dom sample (frequency of S in the natural population chromosome, derived from flies collected in the El Rio isz5–15%; seeHudsonet al. 1994, 1997). Thus, in our
Figure1.—Schematic repre-sentation of the D. melanogaster
b-esterase gene cluster. This cluster consists of functional gene Est-6 and pseudogene
cEst-6 (often called Est-P, but see Balakirev and Ayala
1996). Exons are indicated by open boxes marked by Roman numerals (I and II). The 59and 39 untranslated regions, in-trons, and intergenic region are shown by thin lines. Lengths (in base pairs) are given above the figure for exons, and below the figure for introns and the intergenic region. The horizontal arrows indicate the location and direction of the PCR amplification primers (1 and 2) and the sequencing primers (a–d and a9–d9).
nearly) identical in sequence, reflecting their recent with two other Drosophila species, D. simulans (11.6%) and D. pseudoobscura (16.9%).
origin (Hudsonet al. 1994, 1997). In the case of Est-6,
For Est-6, the A→G replacement substitution (nucle-Karotamet al. (1993, 1995) observed a relatively high
otide site 772, Table 1) results in a charge-altering Rep:Syn ratio in D. melanogaster, D. simulans, and D.
amino acid replacement (Asn→Asp, amino acid
posi-mauritiana.MoriyamaandPowell(1996) indicate that
tion 258), which was first detected byCookeand
Oake-D. melanogaster tends to have the highest incidence of
shott(1989).CookeandOakeshott(1989) have sug-replacement polymorphisms (26.4%) when compared
gested that another replacement substitution (G→ A, at nucleotide site 802, resulting in Ala→Thr at amino acid site 268) might also contribute to the selective TABLE 1
differences observed between the two Est-6 allozymes. DNA polymorphism in theEst-6gene ofD. melanogaster
They have proposed that one or both of the polymor-phisms at 258 and 268 are the primary target for the 1111111111111111
selection underlying the F-S latitudinal clines. We have 11233357788899992334455667777788
found, however, that the Ala→Thr replacement at 268 25778315790704500162670427290005934
Strain 94131189815229869065845663013478193 is not diagnostic for the observed F/S Est-6 polymor-phism but rather occurs in both F and S Est-6 strains (see Reference TTCCCCAGCTTAACCTATTTTCTAGTGCCAATTTC
Table 1, site 802).HassonandEanes(1996) found, like
* ** * * * * **
us, that the F/S allozyme difference can be attributed
255S ...
to the single-amino-acid polymorphism at site 258
(nu-438S ...
510S ...T...AG..A... cleotide site 772), which is diagnostic for the Est-6
allo-521S ...C...A zyme lineages.
94F ...T...AGA...G... Haplotype structure: Figure 2 represents the
maxi-174F ...GT....C...AGA...G...
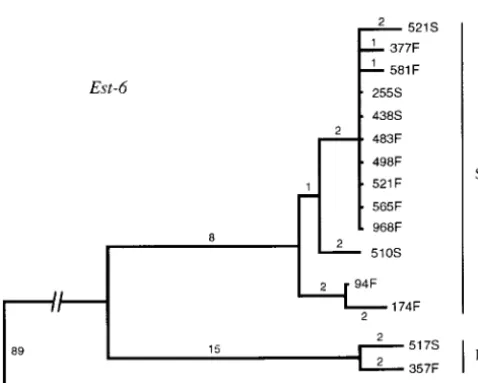
mum parsimony tree of the Est-6 haplotypes. The
distri-377F ..T...
bution of the pairwise differences is bimodal, owing to
483F ...
haplotypes 517S and 357F, which are largely different
498F ...
from the rest, although quite similar to each other.
521F ...
565F ... These two haplotypes code for the Est-6 Fast allozyme
581F .C... and will be denoted as the Est-6 F allelic lineage, whereas
968F ... the other 13 haplotypes will be denoted as the Est-6 S
517S C.TTTTG.TCCGGT.CGC.G...G.A.CTGAC.
allelic lineage. The great divergence between the two
357F C.TTTTG.TCCGGT.CGC.GCTAG.G.A.CTGAC.
lineages indicates that this S-F enzyme polymorphism simulans .C.T..GC..C.G...GC..C.AG.G....TG...
is ancient, at least relative to the allelic diversity within The reference sequence is fromColletet al. (1990). The each of the two lineages.
15 D. melanogaster haplotypes are designed according to the In D. melanogaster, the Est-6 S → F (asparagine → Sod strain from which they originate. The numbers above
aspartic acid) replacement is associated with site 772 the sequences represent the positions of segregating sites.
(A → G). D. simulans has an A at position 772, which Nucleotides are numbered from the initiation codon. The
coding regions (exon I and exon II) are underlined below the suggests that in D. melanogaster, the S allozyme may have reference sequence. Amino acid replacement polymorphisms been the ancient condition from which the F allelic are marked with asterisks. The S-F allozyme polymorphism is lineage derived. However, Cooke and Oakeshott determined by site 772, where S has A (asparagine) and F has
(1989) andHassonandEanes(1996) suggest that the G (aspartic acid). The nucleotides in the D. simulans sequence
F lineage is ancestral on the grounds that the overall are shown at the bottom; only those sites that are polymorphic
TABLE 2
Nucleotide diversity ofSodandEst-6in 15 strains ofD. melanogaster
Full sequence Coding regions Noncoding regions
Gene n p u n p u n p u
All 15 haplotypes
Est-6 1879 4.50 5.73 1635 3.77 4.89 244 9.37 11.34
(1.63) (0.97) (1.38) (0.96) (3.32) (3.78)
Sod 1408 6.67 9.45 439 3.34 3.50 969 8.20 12.16
(2.58) (1.44) (0.76) (1.57) (3.48) (1.97)
Excluding the 2 F haplotypes
Est-6 1879 1.51 2.23 1635 1.24 1.97 244 3.36 3.96
(0.46) (0.62) (0.38) (0.62) (1.11) (2.29)
Sod 1408 2.17 3.43 439 2.16 2.20 969 2.17 3.99
(0.69) (0.89) (0.45) (1.27) (1.02) (1.15)
pis the average number of nucleotide differences per site among all pairs of sequences (Nei1987, p. 256).
uis the average number of segregating nucleotide sites among all sequences, based on the expected distribution of neutral variants in a panmictic population at equilibrium (Watterson1975). Standard deviations (SD) are given in parentheses below the parameter values. Allp,u, and SD values are multiplied by 103. Values for all 15 haplotypes are on top. Below are the values obtained after excluding the two F alleles for Est-6 (strains 357F and 517S) and the 498F and 968F strains for Sod.
F than among S alleles. The two Est-6 allelic lineages (F by 4 synonymous substitutions, but no replacements, and S) are about equally different from D. simulans whereas there are 4 polymorphic replacement sites (90–98 nucleotide substitutions per sequence), much among the 13 S haplotypes, 1 of which (at 1526) is more so than they are from each other (22–29 substi- shared by 2 haplotypes (94F and 174F), for a total of 5 tutions per sequence), which indicates that the F-S replacement polymorphisms among the 13 S haplo-polymorphism originated well after the divergence of types.
the two species. The haplotypes have accumulated a Figure 3 represents the maximum parsimony tree for number of substitutions after the divergence between the Sod haplotypes. The contrasts with Est-6 are notable. the F and S allelic lineages: the two F strains differ There is only one replacement polymorphism (F→ S allozyme) in Sod. Two F haplotypes (498F and 968F) are very different from all others, whereas the eight other F haplotypes are much more similar to the S haplotypes than they are to 498F and 968F.
Linkage disequilibrium: Within Est-6, 262 out of 351 pairwise comparisons (74.6%) between nonsingleton pairs of polymorphisms show statistically significant link-age disequilibrium by the chi-square test; with the Bon-ferroni correction for multiple comparisons, there are 192 (54.7%) significant associations. The distribution of significant associations is fairly uniform across the
Est-6 sequence; linkage disequilibrium does not decline
as distance between polymorphic sites increases. We have also found an excess of nonrandom associa-tions within Sod: 211 out of 325 pairwise comparisons (64.9%) are significant, and 191 (58.8%) are significant with the Bonferroni correction. The significant associa-tions do not form any obvious cluster, nor is the strength of linkage disequilibrium related to the distance
be-Figure2.—Unrooted maximum-parsimony tree of the Est-6
tween polymorphic sites. haplotypes of D. melanogaster. The haplotypes are designated
according to the Sod strain from which they originate. Along We have first evaluated linkage disequilibrium be-the branches are be-the numbers of mutational steps. The 15 tween the Sod and Est-6 genes using Fisher’s exact test Est-6 haplotypes group into 2 lineages, designated S and F on
and the chi-square test, which fail to detect any signifi-the right. The analysis is based on 1879 bp comprising signifi-the
cant interlocus association, as might be expected owing whole sequenced region of Est-6. D. simulans is used as an
the F/S polymorphism at each locus (i.e., exon I of Est-6 and exon II of Sod: G5 6.52, d.f. 51, P ,0.05); no association can be detected between exon II of Est-6 and exon II of Sod (G51.41, d.f.51, P. 0.05). The observed pattern of linkage disequilibrium between the two genes remains unchanged when singletons are ex-cluded.
Test of neutrality:We have applied the HKA ( Hud-sonet al. 1987),Tajima(1989),McDonaldand Kreit-man(1991), andFuandLi(1993) tests of neutral equi-librium to our sequence data. We have first examined the intergenic region between Est-6 and cEst-6 vs. the
coding sequence of Est-6 without observing any signifi-cant departures from neutral expectations within D.
melanogaster relative to the differences between D.
mela-Figure3.—Unrooted maximum-parsimony tree of the Sod nogaster and D. simulans (x2 5 1.24, P . 0.05). The haplotypes of D. melanogaster, based on 1408 bp that include
same result was obtained byKarotamet al. (1995), who
the whole sequenced region of Sod. The 15 Sod haplotypes
used various upstream sequences of Est-6 and Adh as group into two lineages designated F and F(A)S. D. simulans
neutral reference sequences and various pairs of D. mela-is used as an outgroup.
nogaster and D. simulans Est-6 alleles. Moriyama and Powell(1996) found significant deviation from neutral expectations in the comparison of the intraspecific poly-see materials and methods). We have also used the
“sign” method (Lewontin1995), which is based on the morphism of Est-6 with the interspecific divergence be-tween Est-6 and Pgd. However, nucleotide variation at distribution of the disequilibrium sign, which is sensitive
to asymmetrical allele frequencies and efficiently oper- Pgd is highly unusual because most HKA tests that
in-clude this locus (whether as the reference or test locus) ates with singleton polymorphisms, which are not
infor-mative when Fisher’s exact test is used. show significant deviations from neutrality (Moriyama andPowell1996). We have applied theTajima(1989) The sign method involves examining the number of
positive and negative D values for each polymorphic site andFuandLi(1993) tests separately to different parts of Est-6 and to the whole gene. These tests do not reveal within and between all types of pairwise comparisons
(singletons vs. singletons, singletons vs. doublets, dou- any significant deviation from neutrality. However, the Tajima(1989) test applied to our data (exon I), com-blets vs. doucom-blets, and so on). The observed negative
value summed for a particular type of pairwise compari- bined with previously published Est-6 sequences (Cooke and Oakeshott 1989; Hasson and Eanes 1996), re-son is compared with the expected value using a
good-ness-of-fit test (the likelihood ratio statistic, G-test, was veals significant deviation from neutrality expectations for the S alleles (D 5 21.864, P, 0.05), but not for recommended byLewontin1995). We have calculated
the D values for all pairwise comparisons between sites the F alleles (D5 20.181, P.0.10). Also, the McDon-aldandKreitman (1991) test applied to four D. sim-in Sod and Est-6 (Table 3). The observed total number
of negative associations is 1551 vs. the expected number ulans (fromKarotamet al. 1995) and 15 D. melanogaster Est-6 coding sequences reveals significant deviation from
of 1248.27 (G5459.60, d.f.51, P,0.001;Sokaland
Rohlf 1981, pp. 695–707), manifesting a significant neutrality (G57.07, d.f.51, P,0.01, Table 4). The ratio of replacement to silent polymorphism within spe-excess of negative associations; i.e., less frequent alleles
at different loci are predominantly in the repulsion cies is lower than the ratio of fixed replacement to silent differences between them.
phase (the result remains the same after applying
Wil-liams’ correction: G*5 459.45, d.f.5 1, P, 0.001). We have applied all the neutrality tests mentioned above to the Sod data fromHudson et al. (1997) and,
Seeking to localize the nonrandom associations, we
have applied the Lewontin test separately to different using the Tajima test (D 5 21.873, P , 0.05), found significant departure from neutrality only for the 39 -regions. There are very significant associations between
the Est-6 coding region and the Sod intron (G5277.36, flanking region.
Sliding window analysis:We have analyzed separately d.f.51, P,0.001) and between the Est-6 coding region
and the 39-flanking region of Sod (G553.11, d.f.51, different regions of Est-6 and Sod with the sliding window method (Hudson andKaplan 1988). Figure 4 shows
P,0.001). There are associations between the coding
regions of the two genes that are less pronounced, but the sliding window plots of exon I of Est-6 for all se-quences (Figure 4A) and for the S allelic lineage only still statistically significant (G 5 6.12, d.f. 5 1, P ,
0.05). It is interesting that in this last comparison, the (Figure 4B). In both cases, there is a distinct peak of increased variation in the region surrounding the re-significant disequilibrium occurs between the regions
allo-TABLE 3
Linkage associations for pairs of biallelic sites at theEst-6gene
D1 D2
k m Observed Expected Observed Expected G G*
1 1 6 8.576 122 119.424 0.933 0.929
1 2 6 74.480 554 485.520 115.968 115.865
1 3 5 11.200 51 44.800 5.157 5.111
1 4 3 12.816 45 35.184 13.434 13.296
1 5 4 2.664 4 5.336 0.947 0.891
2 2 2 147.004 570 424.996 317.465 317.188
2 3 2 43.778 116 74.222 91.251 90.866
2 4 3 37.128 75 40.872 75.962 75.478
2 5 20 12.562 2 9.438 12.396 12.121
3 3 3 3.096 3 2.904 0.007 0.006
3 4 3 5.733 6 3.267 3.409 3.230
3 5 2 1.472 0 0.528 1.226 0.981
4 5 0 1.221 3 1.779 3.135 2.687
k is the number of copies of the rarer allele at a biallelic site; m is the number of copies of the rarer allele at another biallelic site for m$k. D1and D2refer to positive and negative associations, respectively.
zyme polymorphism; the peak becomes more apparent have occurredz666,000 years ago—assuming that Est-6 is a good molecular clock. The divergence between the when only the S allelic lineage is considered (Figure
4B). The same peak is also clearly distinguishable for two F alleles occurredz105,000 years ago and between S allelesz73,000 years ago.
the data ofCookeandOakeshott(1989) andHasson
and Eanes (1996) (Figure 5, A and B). For the Sod The Sod average distance between D. melanogaster and
D. simulans is 73.1, while between the two main allelic
gene, a distinct peak appears within the intron (Figure
6A) and toward the end of the 39-flanking region (Fig- lineages [F vs. F(A)S] it is 29.3, which corresponds to z962,000 years, while the divergence between the two ure 6B). These two peaks coincide with areas of
signifi-cantly high values, according to Tajima’s D-test. F alleles occurredz427,000 years ago. The average dis-tance among all F(A) and S alleles (excluding 581F, Overall, the sliding window analysis and the neutrality
tests (Tajima’s and McDonald and Kreitman’s) suggest which is probably a recombinant) is 2.4, corresponding to 79,000 years ago; the average distance among the S that the polymorphism distribution in the Est-6 and Sod
genes significantly deviates from the expectations of alleles is 0.8 orz26,000 years ago.
We have calculated the time of divergence between neutrality.
Interspecific comparisons and divergence time:The and within the allelic lineages for both genes following theHudsonet al. (1997) approach, using all sequences Est-6 average distance (nucleotide differences) between
D. simulans and D. melanogaster is 91.9 (see Table 4). or their homogeneous subsets [seeHudsonet al. (1997)
for details]. For the Est-6, the expected time of diver-The average distance between the two main (F and S)
allelic lineages of D. melanogaster is 25.5. If we assume gence between the F and S allelic lineages isz223,000 years [m 3 t 3 15 (1879 2 0.75 3 1635) 5 35; t 5 that the divergence between the species occurred 2.3–
2.5 mya (PowellandDeSalle1995;Russoet al. 1995), 223413.8], wheremis the neutral mutation rate at non-coding and silent sites, assumed to be 16 3 1029 per the divergence of the two D. melanogaster lineages would
TABLE 4
McDonald-Kreitman test of neutrality for theEst-6gene
Polymorphisms
Fixed differences D. melanogaster D. simulansa Totalb
Replacement 19 9 11 18
Silent 25 17 54 69
aCalculated fromKarotamet al. (1995).
bSites that are polymorphic in both species are counted only once. For the two-tailed Fisher’s exact test,
site per year. For the Sod F(A)S and F allelic lineages, whereas in Est-6, additional rare amino acid replace-ments are found.
the divergence time is z178,000 years [m 3 t 3 15
(14082 0.753 439)5 46; t 5 177633.6]. The diver- Natural selection:The Cu,Zn SOD is involved in pro-tecting the cell against the toxicity of oxygen radicals by gence time within the Est-6 S allelic lineage is 96,000
years [m 3 t 3 13 (1879 2 0.75 3 1635) 5 13; t 5 scavenging superoxide radicals and dismutating them to hydrogen peroxide and molecular oxygen (Fridovich 95748.8], considering all polymorphic sites, and 59,000
years [m 3t313 (187920.7531635)58; t558922.3], 1986). The Sod F-S polymorphism is of recent evolution-ary origin, as shown by the virtually complete absence of if we exclude putative recombinant sites. The expected
time of divergence within the Sod F(A)S allelic lineage silent variation among S alleles collected in populations that are geographically very distant, from China and isz45,000 years [m 3t 313 (1408 2 0.753 439)5
10; t544556.9] and 27,000 years [m 3t313 (14082 Europe to the United States (Hudsonet al. 1994, 1997).
S alleles have not been found in South America, nor in 0.75 3439) 5 6; t5 26734.1], excluding the putative
recombinant sites. Africa, whence D. melanogaster spread throughout the world, probably in recent millennia. In the United States, the frequency of S has been found to range from 0 to 0.15 in different populations, and can vary from DISCUSSION
year to year in a given population from 0.05 to 0.15 The Est-6 and Sod genes of D. melanogaster are closely (
Hudsonet al. 1994, 1997). The S alleles are completely
linked on the left arm of chromosome 3, separated by or very nearly identical in nucleotide sequence to a set 3.4 cM, or 1 Mb. Both genes are characterized in natural
of F alleles denominated F(A). The F(A) alleles have populations by a polymorphism with two common
allo-not been found in Africa, but are present in Europe, zymes, S and F, which differ by a single-nucleotide
substi-the United States, and South America, where substi-they often tution and a corresponding amino acid replacement.
account forz50% of all F alleles in a population ( Hud-In Sod, the S-F replacement is the only amino acid
poly-sonet al. 1994, 1997).
morphism commonly found in natural populations,
Figure5.—Sliding window plot of exon I polymorphism (p) in the Est-6 gene of D. melanogaster. (A) Data ofCookeand
Figure4.—Sliding window plot of exon I polymorphism
(p) in the Est-6 gene of D. melanogaster. (A) All data. (B) Oakeshott(1989). (B) Data ofHassonandEanes(1996). Window size is 100 nucleotides, with one-nucleotide incre-Excluding the F allelic lineage. Window size is 100 nucleotides,
populations (Penget al. 1991) or in those selected for
reproduction at an advanced age (Tyleret al. 1993).
Detecting selection is handicapped in our sample be-cause we have studied only 15 sequences (Hanfstingl
et al. 1994; Simonsen et al. 1995; Hasson and Eanes 1996;Richteret al. 1997). Nevertheless, we have found
evidence of natural selection within the 39-flanking re-gion of Sod with Tajima’s (1989) test. Moreover, the sliding window method ofHudsonandKaplan(1988) manifests a distinct peak in the 39-flanking region as well as within the intron of Sod; these peaks are expected as a consequence of balancing selection (Strobeck 1983; Hudson and Kaplan 1988). Selective effects within introns have been recognized previously.Berry andKreitman(1993) have shown that an intron poly-morphism at Adh in D. melanogaster exhibits a more pronounced cline than the F-S allozyme polymorphism that is generally attributed to selection at that locus. KirbyandStephan(1995) have proposed that positive selection accounts for intron polymorphism also at the
white locus of D. melanogaster. This may be because
in-trons may include regulatory sequences (Binghamet al.
1988;Aronowet al. 1989;Gaschet al. 1989;Huanget al. 1993; Pogulis and Freytag 1993). There is also other evidence for selective constraints and epistatic selection on the nucleotide sequence evolution of in-trons (Learnet al. 1992;Leichtet al. 1993, 1995;
Ste-Figure 6.—Sliding window plot of noncoding polymor- phanandKirby1993;Kirbyet al. 1995).
phism (p) in the Sod gene of D. melanogaster. (A) Intron. (B) The Est-6 protein is transferred by males to females The 39-flanking region. Window size is 100 nucleotides, with
in the semen fluid during copulation in D. melanogaster one-nucleotide increments.
(Richmondet al. 1980; RichmondandSenior1981), and it affects the female’s consequent behavior and mating proclivity (Gromko et al. 1984; Scott 1986). A hypothesis of the geographic evolution of the Sod
alleles consistent with the information just summarized The Est-6 coding sequence is selectively constrained (Cooke and Oakeshott 1989; Karotam et al. 1993,
is as follows. The F(A) mutation arose in a D. melanogaster
population outside Africaz5000 years ago (Hudsonet 1995), although presumably to a lesser extent than Sod, which exhibits only one polymorphic amino acid site
al. 1997) and rapidly spread throughout other
conti-nents, impelled by natural selection (Hudson et al. in our sample vs. the nine polymorphic sites present in
Est-6. The Est-6 59-flanking region contains positive cis-1994). The rapidity of the F(A) world expansion is
evi-denced by the virtually complete absence of silent substi- regulatory elements controlling the expression of Est-6 and may contain binding sites for regulatory protein tutions throughout a fragment.10 kb that includes Sod
(Hudson et al. 1997). The S allele arose by a single- factors involved in tissue-specific transcription control. The evidence indicates that the 59-flanking region is nucleotide replacement from F(A), either in Europe or
the United States, and spread from one to the other evolving under greater selective constraints than the coding region (Karotamet al. 1993, 1995; Odgerset
continent, but never reached South America or Africa.
The nucleotide identity of S alleles from widely distant al. 1995). The occurrence of parallel latitudinal clines
of the Est-6 F-S polymorphism in Europe, North Amer-continents (and the nucleotide identity of a fragment
.10 kb that includes Sod S) favors the interpretation ica, and Australia, the pattern of temporal variation, and other lines of evidence all indicate that the Est-6 that the F(A)→ S mutation occurred only once. The
rapid expansion of S in Europe and the United States F-S polymorphism is subject to balancing selection (Oakeshott et al. 1989, 1993, 1995; Richmond et al.
must have been impelled by natural selection. It is
un-certain, however, whether the selective advantage is the 1990). The peak around the S-F amino acid polymor-phism we have observed (Figure 4) is also evidence of same favoring F(A) over other F alleles, or whether the
S replacement is also favored. The S and F enzymes balancing selection impacting the Est-6 S-F polymor-phism in our sample. The detected tendency cannot be differ in such biochemical properties as thermostability
shott1989;HassonandEanes1996). TheMcDonald has been strong. The two strains 517S and 357F [which have F(A) and S alleles, respectively, at Sod, but the Est-6 andKreitman (1991) test applied to the Est-6 coding
region also reveals significant deviation from neutrality. F allele] would have arisen by a recombination event between Sod and Est-6. The fact that the two Sod F alleles The Est-6 and Sod loci are enclosed within the
cosmo-politan inversion In(3L)Payne, which ranges globally that are not F(A) occur in haplotypes with Est-6 S alleles is not surprising because the Est-6 S allozyme is the most from 0 to 40% (Voelker et al. 1978; Lemeunierand
Aulard 1992). Selection at the two loci might simply ancient and common.
An alternative historical scenario that might account be a consequence of distinctive associations between
alleles and chromosomal arrangements. Hasson and for the presence of the two largely divergent sets of alleles that we observe at each locus is population subdi-Eanes(1996) have shown, however, that the In(3L)Payne
inversion suppresses recombination in regions proximal vision with subsequent admixture. D. melanogaster may have been geographically split into two populations that to the chromosome breakpoints, but does not affect
the central region, where Est-6 and Sod are located. remained separate for a time long enough to accumu-late a number of nucleotide substitutions within each Moreover, there is no association between Est-6
se-quence variation and arrangement type, consistent with gene. The substitutions would have accumulated inde-pendently in the two populations. Recent admixture of the extensive genetic exchange observed between
stan-dard (ST) and inverted [In(3L)Payne] third chromo- the two populations would have brought together the two sets of alleles, as we find them in the El Rio popula-somes of D. melanogaster (HassonandEanes1996). In
any case, there are no third chromosome inversions tion, where our strains were collected. According to this scenario, however, the two sets of alleles at the two loci segregating in the El Rio population (Smit-McBrideet
al. 1988). would be associated in the same haplotypes. This is not the case. As shown in Figures 2 and 3, the strains with History of the allelic lineages: Figures 2 and 3 are
maximum-parsimony trees of the Est-6 and Sod alleles. the two Est-6 F alleles (517S and 357F) are different from the strains carrying the two Sod F alleles (377F and It is apparent that the phylogeny of the electrophoretic
alleles is different in the two genes. The two Est-6 F 581F).
Linkage disequilibrium: Sod and Est-6 are 3.4 cM apart alleles are quite similar to each other, but they are in
haplotypes that carry an F(A) Sod allele in one case and in the recombination map (3–32.5 and 3–35.9;Heino
et al. 1994), separated by 983 kb in the genomic map
an S Sod allele in the other case. The 13 Est-6 S alleles
are associated with S or F Sod alleles, and the Sod F (A. Long,personal communication). Yet the nucleotide polymorphisms are negatively associated between the alleles include closely related F(A) alleles as well as the
other distant F alleles. The F(A) and S alleles of Sod two loci (Table 3, P!0.001); that is, minority nucleotide substitutions (present in one to five strains) at one locus have diverged very recently (Hudsonet al. 1994, 1997),
which is also apparent in Figure 3 and our extensive are negatively associated with minority nucleotide sub-stitutions at the other locus. A selection account of this unpublished data (we reckon that the exceptional Sod
allele 581F represents a case of intragenic recombina- observation implies that mutations occurring at one lo-cus are selected against if nucleotide substitutions are tion). We did not, however, expect that the two Est-6 F
alleles would be closely related to one another, and present in the other locus, but not if the other locus exhibits the consensus sequence.
even less so that the 13 Est-6 S alleles would have quite
similar (and even identical) nucleotide sequences. There is an extensive genetic literature advancing the notion that the unit of evolution is not the single gene, Rather, we would have expected that the Est-6 S alleles,
which may represent the ancestral electrophoretic state, but rather, interacting gene complexes (Wright1931; Dobzhansky 1937; Schmalhausen 1946; Mather would consist of alleles quite heterogeneous in
nucleo-tide sequence. Such is, indeed, the case for the Sod F 1953; Waddington 1957; Mayr 1963; Franklinand Lewontin1970). There also are traditional arguments alleles, which, if we exclude the F(A) set, are extremely
heterogeneous in nucleotide sequence (Hudsonet al. propounding that sets of genes for quantitative traits are built up in an alternated arrangement of plus and 1994;F. J. Ayala, unpublished data). A reasonable
ac-count of the observations is to assume that the Sod F(A) minus alleles on chromosomes, so that selection mini-mizes actual variation for such traits, but maximini-mizes mutation occurred in a haplotype carrying an Est-6 S
allele, and that the rapid world expansion of the Sod potential variability, which is released by recombination. This1/2alternating arrangement explains why popu-F(A) and S alleles greatly enhanced the frequency of
that particular Est-6 S allele. The Sod F(A) mutation is lations rapidly respond to varying environmental chal-lenges, as well as the success of artificial selection fa-estimated to have occurredz5000 years ago or
some-what earlier (Hudson et al. 1997). The 5000 years of voring extreme values of the traits (Mather 1953; Thodayet al. 1964). However, even if we accept such
the world expansion of the Sod F(A) and S alleles would
allow for only limited recombination between Sod and theoretical constructs and their evidential support, it remains obscure why the plus/minus compensatory
ar-Est-6. This scenario is consistent with the interpretation
unlikely to share distinctive functional interactions, and LITERATURE CITED
between nucleotide substitutions that are in most cases Aguade´, M.,1998 Different forces drive the evolution of the Acp26Aa and Acp26Ab accessory gland genes in the Drosophila melanogaster synonymous.
species complex. Genetics 150: 1079–1089. It seems more likely that linkage disequilibrium has
Aquadro, C. F.,1993 Molecular population genetics of Drosophila, arisen as a consequence of selection strongly favoring pp. 222–266 in Molecular Approaches to Fundamental and Applied
Entomology, edited byJ. OakeshottandM. J. Whitten. Springer-one particular sequence at a locus, such as seems to
Verlag, New York. have occurred at Sod, where the F(A) alleles (and the
Aronow, B., D. Lattler, R. Silbiger, M. Dusing, J. Huttonet al.,
derivative S alleles) rapidly increased in frequency. Rare 1989 Evidence for a complex regulatory array in the first intron of the human adenosine deaminase gene. Genes Dev. 3: 1384– substitutions present in Est-6 would have hitchhiked
1400. along with Sod F(A) without allowing enough time for
Avery, P. J.,andW. G. Hill,1979 Distribution of linkage disequilib-their elimination by purifying selection with or without rium with selection and finite population size. Genet. Res. 33:
29–48. recombination between the two loci. The reciprocal
Ayala, F. J., J. R. Powelland Th. Dobzhansky, 1971 Enzyme situation would have also occurred, in which common
variability in the Drosophila willistoni group. II. Polymorphisms in
Est-6 alleles are favored by selection and low-frequency continental and island populations of Drosophila willistoni. Proc.
Natl. Acad. Sci. USA 68: 2480–2483.
Sod substitutions are hitchhiking along. As noted earlier,
Ayala, F. J., J. R. Powell, M. L. Tracey, C. A. Moura˜oandS.
Pe´rez-there is evidence of positive selection in favor of Sod
Salas, 1972a Enzyme variability in the Drosophila willistoni F(A); in the case of Est-6, the evidence favors balancing group. IV. Genic variation in natural populations of Drosophila
willistoni. Genetics 70: 113–139.
selection between the two common allozymes, S and F.
Ayala, F. J., J. R. PowellandM. L. Tracey,1972b Enzyme variabil-In a study of two wild samples and four experimental
ity in the Drosophila willistoni group. V. Genetic variability in natu-populations, Smit-McBride et al. (1988) did not ob- ral populations of Drosophila equinoxialis. Genet. Res. 20: 19–42.
Balakirev, E. S.,andF. J. Ayala,1996 Is esterase-P encoded by serve linkage disequilibrium between Est-6 and Sod in
a cryptic pseudogene in Drosophila melanogaster? Genetics 144: the large wild samples, but linkage disequilibrium
ap-1511–1518.
peared after 8–30 generations in three of the four exper- Barker, J. A. F.,1979 Inter-locus interactions: a review of experimen-tal evidence. Theor. Popul. Biol. 16: 323–346.
imental populations derived from the wild samples.
Pop-Begun, D. J.,andC. F. Aquadro,1994 Evolutionary inferences from ulation bottlenecks and other factors were excluded.
DNA variation at the 6-phosphogluconate dehydrogenase locus Smit-McBrideet al. (1988) noted that natural selection in natural populations of Drosophila: selection and geographic
differentiation. Genetics 136: 155–171. acting on the allozymes, or on loci very tightly linked
Begun, D. J.,andC. F. Aquadro,1995 Molecular variation at the to them, was the most likely explanation for the
disequi-vermilion locus in geographically diverse populations of Drosophila
librium. melanogaster and D. simulans. Genetics 140: 1019–1032. Hudson et al. (1997) have estimated that the time Berry, A.,andM. Kreitman, 1993 Molecular analysis of an
allo-zyme cline: alcohol dehydrogenase in Drosophila melanogaster on since the selective sweep for Sod F(A)S isz5000 years
the east coast of North America. Genetics 134: 869–893. or more, but not likely more than 30,000–40,000 years. Bingham, P. M., T.-B. Chou, I. MimsandZ. Zachar,1988 On-off Assuming a molecular (neutral) clock, the age of this regulation of gene expression at the level of splicing. Trends
Genet. 4: 134–138. lineage is estimated at 79,000 years. Similarly, the time
Brown, A. D. H.,1975 Sample sizes required to detect linkage dis-of divergence between the two main Sod allelic lineages equilibrium between two or three loci. Theor. Popul. Biol. 8: is 178,000 years with the method of Hudson et al. 184–201.
Cirera, S.,andM. Aguade´,1997 Evolutionary history of the sex-(1997), but five times greater, 962,000 years, under the
peptide (Acp70A) gene region in Drosophila melanogaster. Genetics molecular clock assumption. These discrepancies can 147:189–197.
be accounted for by natural selection accelerating the Collet, C., K. M. Nielsen, R. J. Russell, M. Karl, J. G. Oakeshott
et al., 1990 Molecular analysis of duplicated esterase genes in evolution of the selectively favored F(A)S alleles.
Hud-Drosophila melanogaster. Mol. Biol. Evol. 7: 9–28.
sonet al. (1997) argue that the selection is strong (s. Cooke, P. H.,andJ. G. Oakeshott, 1989 Amino acid
polymor-0.01). Parallel differences occur for Est-6, but the differ- phisms for esterase-6 in Drosophila melanogaster. Proc. Natl. Acad. Sci. USA 86: 1426–1430.
ences between the estimates obtained by the two
meth-Dobzhansky, Th.,1937 Genetics and the Origin of Species. Columbia
ods are smaller. Thus, the age of the Est-6 S allelic University Press, New York.
lineage is 60,000–95,000 vs. 73,000 years, and the diver- Eanes, W. F., M. Kirchner, J. Yoon, C. Ch. Biermann, I.-N. Wang
et al., 1996 Historical selection, amino acid polymorphism and gence between the S-F lineages is 220,000 vs. 666,000
lineage-specific divergence at the G6pd locus in Drosophila melano-years, corresponding to the method of Hudson et al. gaster and D. simulans. Genetics 144: 1027–1041.
(1997) vs. the clock method. This is consistent with the Feldman, M. W.,andF. B. Christiansen,1975 The effect of popula-tion subdivision on two loci without selecpopula-tion. Genet. Res. 24: hypothesis that the divergence between the two Est-6
151–162. allelic lineages has been impelled by natural selection,
Franklin, I.,andR. C. Lewontin,1970 Is the gene the unit of but with lesser strength than in the case of Sod. selection? Genetics 65: 707–734.
Fridovich, I., 1986 Superoxide dismutases. Adv. Enzymol. 58: We thank several members of our laboratory: Kevin Bailey, Heather
62–97.
Carstens, Victor DeFilippis, Alberto Garcı´a Sa´ez, Jan Kwiatowski, Car- Fu, Y. X.,andW.-H. Li,1993 Statistical tests of neutrality of muta-los Machado, Stephen Rich, Douglas Skarecky, and Andrei Tatarenkov tions. Genetics 133: 693–709.
for encouragement and help. Walter M. Fitch, Brandon Gaut, Richard Gasch, A., U. HinzandR. Renkawitz-Pohl,1989 Intron and up-R. Hudson, and Anthony Long read the manuscript and offered stream sequences regulate expression of the Drosophila beta valuable comments. This work is supported by National Institutes of 3-tubulin gene in the visceral and somatic musculature,
Gromko, M. H., D. F. GilbertandR. C. Richmond,1984 Sperm Langley, C.,1977 Nonrandom associations between allozymes in transfer and use in the multiple mating system of Drosophila, natural populations of Drosophila melanogaster, pp. 265–273 in pp. 371–426 in Sperm Competition and the Evolution of Animal Mating Measuring Selection in Natural Populations, Vol. 19, edited byF. B.
Systems, edited byR. L. Smith.Academic Press, New York. Christiansen and T. M. Fenchel. Lect. Notes Biomath.,
Hanfstingl, U., A. Berry, E. A. Kellogg, J. T. Costa III, W. Ru¨ diger Springer-Verlag, New York.
et al., 1994 Haplotypic divergence coupled with lack of diversity Learn, G. H., J. S. Shore, G. R. Furnier, G. ZurawskiandM. T.
at the Arabidopsis thaliana alcohol dehydrogenase locus: roles for Clegg,1992 Constraints on the evolution of plastid introns: both balancing and directional selection? Genetics 138: 811–828. the group II intron in the gene encoding tRNA-val (UAC). Mol.
Hartl, D. L.,andE. R. Lozovskaya,1995 The Drosophila Genome Biol. Evol. 9: 856–871.
Map: A Practical Guide. R. G. Landes, Austin, TX. Lee, Y. M., H. P. MisraandF. J. Ayala,1981 Superoxide dismutase
Hasson, E.,andW. F. Eanes,1996 Contrasting histories of three in Drosophila melanogaster : biochemical and structural character-gene regions associated with In(3L)Payne of Drosophila melanogas- ization of allozyme variants. Proc. Natl. Acad. Sci. USA 78: 7052–
ter. Genetics 144: 1565–1575. 7055.
Hedrick, P. W., S. JainandL. Holden,1978 Multilocus systems in Leicht, B. G., E. M. S. Lyckegaard, C. M. Benedict andA. G.
evolution. Evol. Biol. 11: 101–182. Clark,1993 Conservation of alternative splicing and genomic
Heino, T. I., A. O. SauraandV. Sorsa,1994 Maps of the salivary organization of the myosin alkali light chain (Mlc1) gene among gland chromosomes of Drosophila melanogaster. Dros. Inf. Serv. 73: Drosophila species. Mol. Biol. Evol. 10: 769–790.
621–738. Leicht, B. G., S. V. Muse, M. HanczycandA. G. Clark,1995
Con-Hill, W. G.,1975 Linkage disequilibrium among multiple neutral straints on intron evolution in the gene encoding the myosin alleles produced by mutation in a finite population. Theor. Popul. alkali light chain in Drosophila. Genetics 139: 299–308. Biol. 8: 117–126. Lemeunier, F., andS. Aulard, 1992 Inversion polymorphism in
Hill, W. G.,1976 Non-random association of neutral linked genes in Drosophila melanogaster, pp. 339–405 in Drosophila Inversion Polymor-finite populations, pp. 339–376 in Population Genetics and Ecology, phism, edited byC. B. KrimbasandJ. R. Powell.CRC Press, edited byS. KarlinandE. Nevo.Academic Press, New York. Cleveland.
Hill, W. G.,andA. Robertson,1968 Linkage disequilibrium in Lewontin, R. C.,1974 The Genetic Basis of Evolutionary Change. Co-finite populations. Theor. Appl. Genet. 38: 226–231. lumbia University Press, New York.
Huang, J. D., D. H. Schwyter, J. M. ShirokawaandA. J. Courey, Lewontin, R. C.,1995 The detection of linkage disequilibrium in
1993 The interplay between multiple enhancer and silencer molecular sequence data. Genetics 140: 377–388.
elements defines the pattern of decapentaplegic expression. Li, W.-H.,andM. Nei,1974 Stable linkage disequilibrium without Genes Dev. 7: 694–704. epistasis in subdivided populations. Theor. Popul. Biol. 6: 173–
Hudson, R. R., andN. Kaplan, 1988 The coalescent process in 183.
models with selection and recombination. Genetics 120: 831–840. Manchenko, G. P.,1994 Handbook of Detection of Enzymes on
Electropho-Hudson, R. R., M. KreitmanandM. Aguade´,1987 A test of neutral retic Gels. CRC Press, Boca Raton, FL.
molecular evolution based on nucleotide data. Genetics 116: Markert, C. L.,andI. Faulhaber,1965 Lactate dehydrogenase
153–159. isozyme patterns in fish. J. Exp. Zool. 159: 319–325.
Hudson, R. R., K. Bailey, D. Skarecky, J. KwiatowskiandF. J. Mather, K.,1953 The genetical structure of populations. Symp. Ayala,1994 Evidence for positive selection in the superoxide Soc. Exp. Biol. 7: 66–95.
dismutase (Sod) region of Drosophila melanogaster. Genetics 136: Mayr, E.,1963 Animal Species and Evolution. Belknap, Cambridge.
1329–1340. McDonald, J. H.,andM. Kreitman,1991 Adaptive protein
evolu-Hudson, R. R., A. G. Sa´ezandF. J. Ayala,1997 DNA variation at tion at the Adh locus in Drosophila. Nature 351: 652–654. the Sod locus of Drosophila melanogaster : an unfolding story of Moriyama, E. N.,andJ. R. Powell,1996 Intraspecific nuclear DNA natural selection. Proc. Natl. Acad. Sci. USA 94: 7725–7729. variation in Drosophila. Mol. Biol. Evol. 13: 261–277.
Ishii, K.,andB. Charlesworth,1977 Associations between allo- Mukai, T.,andR. A. Voelker,1977 The genetic structure of natural zyme loci and gene arrangements due to hitch-hiking effects of
populations of Drosophila melanogaster. XIII. Further studies on new inversions. Genet. Res. 30: 93–106. linkage disequilibrium. Genetics 86: 175–185.
Karotam, J., A. C. DelvesandJ. G. Oakeshott,1993 Conservation
Mukai, T., T. K. WatanabeandO. Yamaguchi,1974 The genetic and change in structural and 59flanking sequences of esterase structure of natural populations of Drosophila melanogaster. XII. 6 in sibling Drosophila species. Genetics 88: 11–28.
Linkage disequilibrium in a large local population. Genetics 77:
Karotam, J., T. M. BoyceandJ. G. Oakeshott,1995 Nucleotide
771–793. variation at the hypervariable esterase 6 isozyme locus of
Drosoph-Nei, M.,1987 Molecular Evolutionary Genetics. Columbia University ila simulans. Mol. Biol. Evol. 12: 113–122.
Press, New York.
Kimura, M.,1968 Evolutionary rate at the molecular level. Nature
Nei, M.,andW.-H. Li,1973 Linkage disequilibrium in subdivided 217:624–626.
populations. Genetics 75: 213–219.
Kimura, M.,1983 The Neutral Theory of Molecular Evolution.
Cam-Nei, M.,andW.-H. Li,1980 Non-random association between elec-bridge University Press, Camelec-bridge.
tromorphs and inversion chromosomes in finite populations.
Kimura, M.,andT. Ohta,1971 Protein polymorphism as a phase
Genet. Res. 35: 65–83. of molecular evolution. Nature 229: 467–469.
Oakeshott, J. G., P. H. Cooke, R. C. Richmond, A. Bortoli, A. Y. Kirby, D. A.,andW. Stephan,1995 Haplotype test reveals departure
Gameet al., 1989 Molecular population genetics of structural from neutrality in a segment of the white gene of Drosophila
melano-variance of esterase-6 in Drosophila melanogaster. Genome 31: 788–
gaster. Genetics 141: 1483–1490.
796.
Kirby, D. A.,andW. Stephan,1996 Multi-locus selection and the
Oakeshott, J. G., E. A. van Papenrecht, T. M. Boyce, M. J. Healy
structure of variation at the white gene of Drosophila melanogaster.
andR. J. Russell,1993 Evolutionary genetics of Drosophila Genetics 144: 635–645.
esterases. Genetica 90: 239–268.
Kirby, D. A., S. V. MuseandW. Stephan,1995 Maintenance of
Oakeshott, J. G., T. M. Boyce, R. J. RussellandM. J. Healy,1995 pre-mRNA secondary structure by epistatic selection. Proc. Natl.
Molecular insights into the evolution of an enzyme: esterase 6 Acad. Sci. USA 92: 9047–9051.
in Drosophila. TREE 10: 103–110.
Kreitman, M.,andR. R. Hudson,1991 Inferring the evolutionary
Odgers, W. A., M. J. HealyandJ. G. Oakeshott,1995 Nucleotide histories of the Adh and Adh-dup loci in Drosophila melanogaster
polymorphism in the 59promoter region of esterase 6 in Drosoph-from patterns of polymorphism and divergence. Genetics 127:
ila melanogaster and its relationship to enzyme activity variation.
565–582.
Genetics 141: 215–222.
Krimbas, C. B.,andJ. R. Powell,1993 Introduction, pp. 1–52 in
Ohta, T.,1982a Linkage disequilibrium due to random genetic
Inversion Polymorphism in Drosophila, edited byC. B. Krimbasand
drift in finite subdivided populations. Proc. Natl. Acad. Sci. USA
J. R. Powell.CRC Press, Boca Raton, FL.
79:1940–1944.
Kwiatowski, J., D. Skarecky, S. Hernandez, D. Pham, F. Quijaset
Ohta, T.,1982b Linkage disequilibrium with the island model.
Ge-al., 1991 High fidelity of the polymerase chain reaction. Mol.