Transactions, SMiRT-25 Charlotte, NC, USA, August 4-9, 2019
Division V
STRUCTURE AND DAMAGE EVALUATION OF RC MEMBERS
USING ADVANCED MEASUREMENT TECHNOLOGY
Yusuke Tanabe1,Toshinobu Maenaka2, Hiroshi Hashimoto2
,
Natsuya Iwashima3, Yasuo Okouchi3, and Shinya Ishikawa3
1Takenaka Corporation, R&D Institute, Inzai-shi, Chiba, JPN ([email protected])
2Takenaka Corporation,Power Engineering Department, Koto-ku, Tokyo, JPN
3Chubu Electric Power Co., Inc, Higashi-ku, Nagoya, JPN
ABSTRACT
Many nuclear power plant facilities are constructed by reinforced concrete (RC) walls. Structural performance and damage evaluation of RC walls are very important matters for constructing and
maintaining nuclear power plants. In order to conduct these evaluations, many experiments have been
carried out for a long time. And based on the obtained experimental results, current design methods for the evaluation of leak-proof function, shielding function, supporting function, etc., of nuclear power plants, have been established.
Meanwhile in recent years development of measurement technology has progressed. As representative examples, image measurement and new strain measurement by optical fiber gauges are cited, but they are not applied extensively for evaluating RC walls. Therefore, we try to use these new measuring methods in order to obtain detailed data of RC walls. These data were re-evaluated by linking them to their respective elements’ load - deformation relationships and crack conditions. The purposes of this research is to associate FE analysis with damageability, where a comparison between experimental results and FE
analysis resultswas carried out, and contribute in the advancement of those evaluation methods.
STUDY PLAN
When buildings aredesigned using FE analysis, a design method may be considered in which the strain
Table 1: Advanced measurement technologies and purposes
Advanced measurement technology Purpose
Crack distribution by image Grasping detailed crack pattern
Digital image correlate method Grasping strain distribution of concrete surface
Optical fiber gauge Grasping strain distribution of steel bar
Acrylic plate gauge Grasping inner strain distribution of concrete wall
ELEMENTAL EXPERIMENTS
Acrylic Plate Gauge
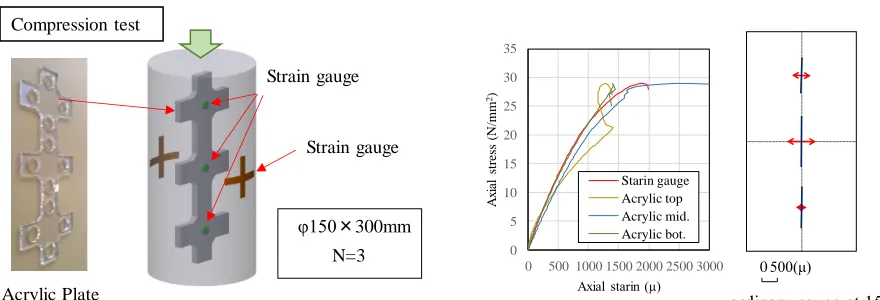
An attempt was made to measure the inner strain of a concrete wall by attaching strain gauges to an acrylic
plate with low stiffness and embedding it in concrete [1]. Figure 1 shows the characteristics of the acrylic
plate gauge, and the result of the experiment. In the experiment, compression tests of concrete specimens with an embedded acrylic plate gauge was conducted to verify the measurement method. A specimen of
φ150 × 300 mm cylinder was used, and, for comparison, ordinarygauges were alsoattached to the surface
of the concrete.
The principal strain diagram (right side of Figure 1(b)) shows the strain state of the acrylic plate
gauge when the axial strain of thesurface gauge reached1500μ. The measured strains of theacrylic plate
gauge (left side of Figure 1(b)) were in good agreement with those of the surface gauge up to about 1/3 of
the measured maximum stress level. The stresses after that levelwere about 10% different from those of
the surface gauge. Looking at the principal strain diagram(right side of Figure 1(b)), the radial strain was
larger at the mid-height of the specimen. This was consistent with the strain tendency commonly assumed in such specimens.
(a) Setting outlineof acrylic plate gauge (b) Result of tests
Figure 1. Element tests of acrylic plate gauge Acrylic Plate
φ150×300mm
N=3 Strain gauge Compression test
Strain gauge
0 500(μ) 0
5 10 15 20 25 30 35
0 500 1000 1500 2000 2500 3000
A
xi
al
stre
ss
(N/mm
2)
Axial starin (μ) Starin gauge Acrylic top Acrylic mid. Acrylic bot.
Optical Fiber Gauge
So far, the measured strain of a steel bar is the measured value at the point where the strain gauge is attached,
whereas the strain value elsewherebetween gauges has been linearly complemented. On the contrary,an
optical fiber can measure strains at any location along its longitudinal direction [2]. This time, it was verified
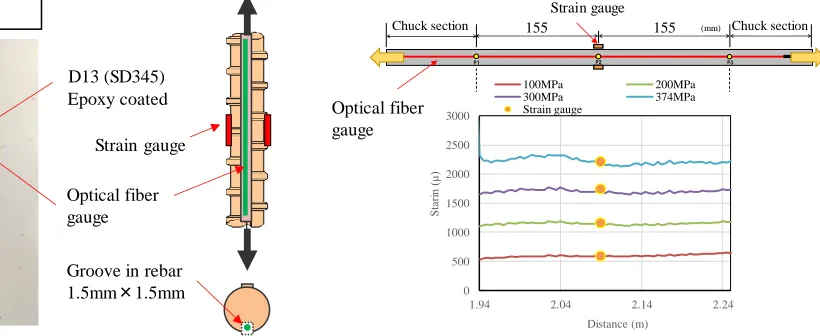
whether an optical fiber gauge couldor could not capturethe linear strain of a steel bar. In the experiment,
a simple tensile test of steel bars with attached optical fiber was conducted. Figure 2 shows the
characteristics of the optical fiber gauge and result of experiment. A groove (size: 1.5mm × 1.5mm) was
made along eachsteel bar and an optical fiber was installed inside it. D13 (SD 345: specified yield strength
345N/mm2) steel bars were used. For comparison, an ordinary strain gauge was attached at the mid-length
of each steel bar.
The result of the experiment (figure 2(b)) shows the strain distribution alongthe optical fiber gauge
when the strain of the ordinarygauge reached stress levels multiple of100 MPa. A comparison of the optical
fiber gauge and ordinarygauge values shows that it is possible to measure strains using an optical fiber
gauge with the same accuracy as the ordinary strain gauge. In addition, we could measure the strain distribution along the steel bar.
(a) Setting outlineof acrylic plate gauge (b) Result of test
Figure 2. Element test of acrylic plate gauge
EXPERIMENT OF SEICMIC SHEAR WALL
Experimental plan
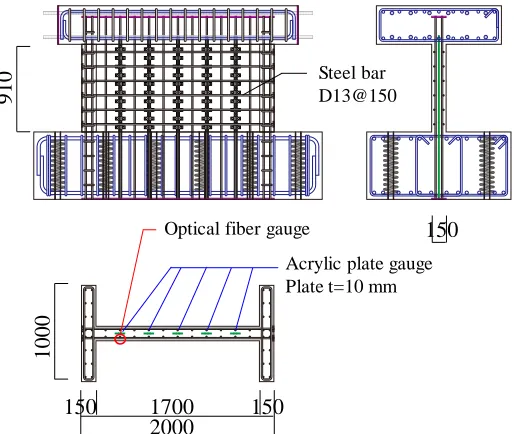
Figure 3 shows the elevation and cross sections of a specimen in which we tried the previous advanced
measurement methods used for elemental tests. The test specimen had a wall thickness of 150 mm, a total wall length of 2000 mm, a flange wall width of 1000 mm, and an M / QD of 0.6. 2-D13 (SD345) steel bars
were used with 150 mm spacing (ps = 1.16%). The concrete used for the wall was of class Fc24, and the
coarse aggregates had a maximum diameter of 20 mm. Table 2 and 3 show the material test results of the
concrete and steel bar used. As to theadvanced measurement methods, acrylic plate gauges were installed
at a 300 mm pitch on the web wall. An optical fiber gauge was installed in the grove of avertical steel bar
of the web wall edge. In addition, the concrete surface strain of the web wall was measured by the DIC method during the test. Figure 4 shows the experimental test setup. The test specimen’s lower stub was
Groove in rebar
1.5mm×1.5mm
Optical fiber gauge Epoxy coated D13 (SD345) Tensile test
Optical fiber gauge
P2 P1
95mm 95mm
P3
155mm 155mm
つかみ部 つかみ部間 つかみ部
試験機下側 試験機上側
Strain gauge
155 155
Chuck section (mm) Chuck section
0 500 1000 1500 2000 2500 3000
1.94 2.04 2.14 2.24
Sta
ri
n
(μ
)
Distance (m)
100MPa 200MPa 300MPa 374MPa Strain gauge
fixed to the reaction floor, and loaded laterally in the positive and negative directions by applying forces at the upper stub. Lateral loading was controlled by displacement, and by shear strain which was obtained by subtracting the flexure deformation from the total deformation.
Figure 3. Elevation and cross sections of specimen (Unit: mm)
Table 2: Characteristics of concrete.
Compressive Strength [N/mm2]
Young’s Modulus [×103N/mm2]
Strain [μ]
Tensile Strength [N/mm2]
26.8 27.5 1932 2.9
Table 3: Characteristics of steel bar
Steel Bar Type Young’s Modulus [×105N/mm2]
Yield Stress [N/mm2]
Tensile Strength [N/mm2]
Elongation [%]
D13 (SD345) 1.85 384 557 21
Figure 4. Experimental test setup (Unit: mm) 1700
150 150
150
Steel bar D13@150
2000
910
Optical fiber gauge
Acrylic plate gauge Plate t=10 mm
1000
Oil Jack Load Cell
Load Cell
Oil Jack
PC Rod 2500
3000
1810
700
910
200
EXPERIMENTAL RESULT
Fracture process and shear force-shear deformation angle relationship
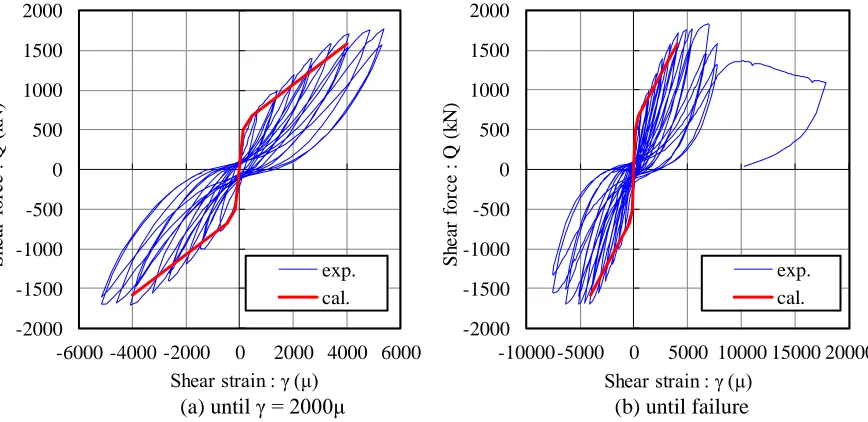
Figure 5 shows the crack pattern at the shear strain γ = 2000 μ, and the damage at fracture. Figure 6 shows
the shear force - shear strain relationship up to γ = 5000μ and at failure. For thefailure process, at first two
shear cracks occurred in the web wall at the shear strain γ = 500μ, andat the same time bending cracks
occurred in the flange wall. At theshear strain γ = 1000μ, the number of shear cracks increased to four and
the cracks lengthened. At the shear strain γ = 2000μ, cracking occurred on the entire wall surface. When the shear strain was larger than γ = 3000μ, the number of cracks did not increase, but the crack width. The
maximum strength was obtained at the shear strain γ = 6000 μ. After that, thecracks were connected at the
mid-height of the wall due to thepositive and negative alternating cyclic loading, and eventually shear slip
failure was reached. Figure 6 also shows the calculation results of the shear skeleton by JEAC 4601[3]. The
calculated results agreed well with the experimental results in terms of the initial stiffness, crack point and maximum strength.
(a) Cracks pattern(γ = 2000μ) (b) Damage at fracture (γ = 15000μ) Figure 5. Fracture process of specimen
(a) until γ = 2000μ (b) until failure
Figure 6. Shear force - Shear strain relationship
A 面 D 面
B 面 F 面
C 面 D 面 E 面 東
南
北 西
B C D E F
B C D E F
A 面 D 面
B 面 F 面
C 面 D 面 E 面 東
南
北 西
B C D E F
B C D E F
-2000 -1500 -1000 -500 0 500 1000 1500 2000
-6000 -4000 -2000 0 2000 4000 6000
S
h
ea
r
for
ce
:
Q
(
k
N
)
Shear strain : γ (μ) exp. cal.
-2000 -1500 -1000 -500 0 500 1000 1500 2000
-10000 -5000 0 5000 10000 15000 20000
S
h
ea
r
for
ce
:
Q
(
k
N
)
Strain distribution along steel bar by optical fiber gauge
Figure 7 shows the strain distributionalong the steel bar of the wall measured by the optical fiber gauge.
The figure also shows the values measured by ordinarystrain gauges installed on the same steel bar for
comparison. It was found that the values measured by the optical fiber gauge correspond to the values of the ordinary strain gauge, and it was possible to measure the strain distribution along the height of the wall by the optical fiber gauge. Strain distribution along the vertical bars, presented uneven peaks and valleys. In particular, the strain decreased at the crossing points with the horizontal bars and tended to increase at the location of the cracks.
Figure 7. Strain distribution by optical fiber gauge at different shear strain levels
Concrete crack and strain distribution
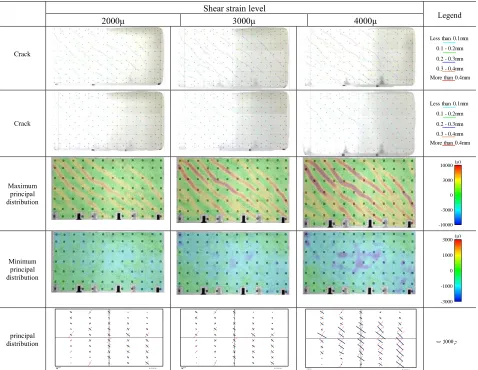
Figure 8 shows the results by the other advanced measurement methods, to name, the crack distribution by image, maximum and minimum principal strains’ distributions by the DIC method, and concrete strain inside the wall measured by the acrylic plate gauge. Looking at the crack distribution, it was found that the crack width at the wall compressive strut portion and at the wall top tended to increase. The crack width at
unloadingwas about 20% of the crack width at peaks of loading cycles. The crack spacing was about the
wall steel bars’ pitch (150 mm). This was the same trend as previous research results [4]. Looking at the
maximum principal strain distribution of concreteby the DIC method, the maximum principal strain can
easily confirmed at the crack location shown by the red color region. The average concretestrain in the
peripheral region was about 1.0%. The minimum principal strain was large at the compression struts. At shear strain γ = 2000μ, the minimum principal strain of concrete was about 1000μ, and at shear strain γ = 3000μ, the minimum principal strain of concrete was about 2000μ. Looking at the distribution of the principal strain of concrete inside the wall using an acrylic plate gauge, it was possible to measure the tendency of the principal strain, becoming larger at the part corresponding to the compression strut in accordance with the DIC method.
4
0 1000 2000 3000
壁高さ
(m
)
ひずみ (μ)
fiber V1-4
V1-3 V1-2
V1-1
4
0 1000 2000 3000 4000
壁高さ
(m
)
ひずみ (μ)
fiber V1-4
V1-3 V1-2
V1-1
4
0 1000 2000 3000
壁高さ
(m
)
ひずみ (μ)
fiber V1-4
V1-3 V1-2
V1-1
0 1000 2000 3000 4000 5000
鉄筋ひずみ(μ)
実験 解析
0 1000 2000 3000 4000 5000
鉄筋ひずみ(μ)
実験 解析
0 1000 2000 3000 4000 5000
鉄筋ひずみ(μ)
実験 解析
CL 光ファイバー
γ=2000μ γ=3000μ γ=4000μ
Optical fiber
γ=2000μ γ=4000μ
Strain Strain
γ=3000μ
Strain
Shear strain level
Legend
2000μ 3000μ 4000μ
Crack
Crack
Maximum principal distribution
Minimum principal distribution
principal distribution
Figure 8. Result of advanced measurement by DIC method
FE ANALYSIS
FE model
The simulation analysis was carried out by an elastic-plastic three-dimensional FE analysis for the shear
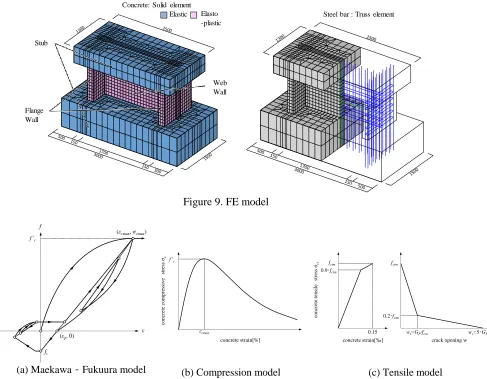
wall test using the softwareDIANA Ver.10.2. Figure 9 shows theFE model. Concrete was modelled by
solid elements and steel bars by truss elements. The upper and lower stubs are considered elastic, whereas the flange wall and the web wall are considered elasto-plastic.
As shown in Figure 10, Maekawa-Fukuura model which is a multi-directional crack model was
adopted to model the cyclic behaviour of concrete [5]. The compression characteristics in this model are
represented by an elasto-plastic fracture model before cracking, and by ahysteresis law after cracking. The
compressive strength was taken as 27.5 N / mm2 using an average value based on the material test results.
The strain at the time of compressive strength was calculated according to the formula proposed by Noguchi et al.[6] and was set to ε c
max = 2074μ. The tensile softening characteristics of the concrete on the tension
side are those given by “fib Model Code for Concrete Structures 2010” [7]. The tensile strength was taken
as 2.94 N / mm2 using an average value based on the material test results. The fracture energy was evaluated
0.1mm未満
0.1~0.2mm
0.2~0.3mm
0.3~0.4mm
0.4mm以上 Less than 0.1mm
0.1 - 0.2mm
0.2 - 0.3mm
0.3 - 0.4mm
More than 0.4mm
0.1mm未満
0.1~0.2mm
0.2~0.3mm
0.3~0.4mm
0.4mm以上 Less than 0.1mm
0.1 - 0.2mm
0.2 - 0.3mm
0.3 - 0.4mm
More than 0.4mm
10000
3000
0
-3000
-10000 (μ)
3000
1000
0
-1000
-3000 (μ)
R=2×10⁻³rad
0 500(μ) 0 500(μ) R=2×10⁻³rad
by the formula proposed by Ooka et al. [8]
.
The shear stiffness reduction rate followed the Al-Mahaidi model[9]. The compressive strength reduction of cracked concrete was set in reference to the Japan Society of
Civil Engineers [10]. The behaviour of the steel bars was assumed completely elasto-plastic, the yield
strength was 345 N / mm2, and the Young's modulus was taken as 1.849 × 10⁵ N / mm2 which was an
average value based on the material test. Since this analysis considered the alternating positive and negative loading, the kinematic behaviour is applied to the hardening rule.
For the boundary conditions, the translational degree of freedom of the lower end of the lower stub were constrained. The load application point was at the center of the upper stub. The loading was displacement controlled, and the displacement measured at the upper center position of the web wall in the experiment was used in the analysis. However, only one loading cycle for each shear strain amplitude is considered in order to reduce the analysis cost.
Figure 9. FE model
Figure 10. Concrete model
Result of FE Analysis
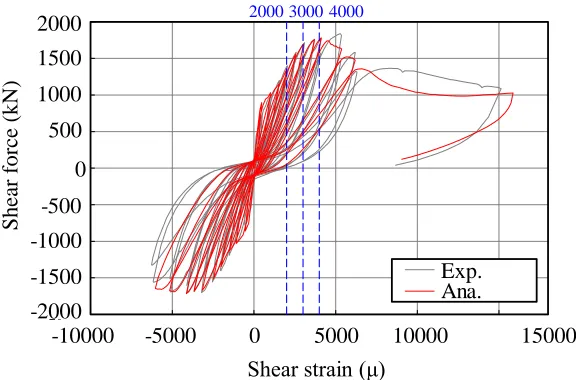
Figure 11 shows the shear force - shear strain relationships from test and analysis. While the analysis almost reproduced the test results until the shear strain 4000μ including the maximum strength level, the
X Y Z
スタブ
フランジ壁
ウェブ壁
弾性体 弾塑性体
X Y Z
Elasto -plastic Elastic
Stub
Flange Wall
Web Wall
Steel bar : Truss element Concrete: Solid element
f’c
f
ε
ft
(εp, 0)
(εcmax,σcmax)
εcmax
f’c
conc
ret
e
compress
ive
stress
σc
concrete strain[%] concrete strain[‰] fctm
0.15 0.9・fctm
conc
re
te
t
ensi
le
str
ess
σct
crack opening w fctm
wt=GF/fcm
0.2・fctm
wt=5・GF/fcm
post peak part was underestimated. Although the experimental result shows the maximum stress at the positive cycle of 5000μ, it is 4000μ in the analysis. On the other hand, it is thought that the peak of 5000μ (positive side) in the experiment may be caused by some unique factors, since the maximum strength on the negative side is almost the same for both the experiment and analysis.
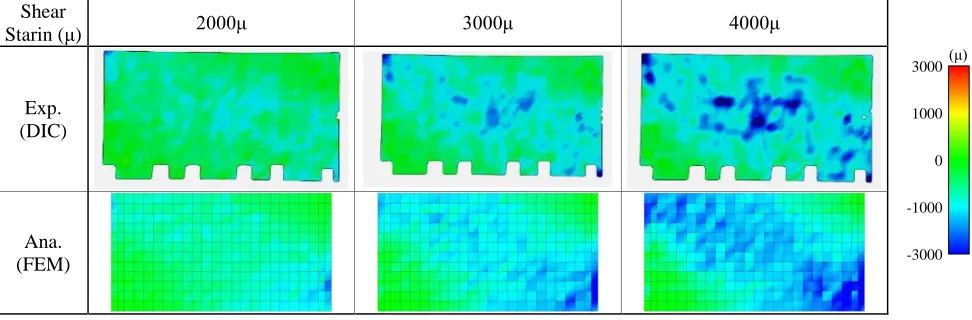
Figure 12 and 13 compare the principal strain distribution of the concrete surface at the shear strains 2000μ, 3000μ and 4000μ in the experiment and analysis. In Figure 12, while the principal strain contour of the experiment becomes prominent at the crack position, the contour of the analysis has a distribution such that it spreads over the entire surface on average. This tendency was similarly observed with the maximum principal strain and minimum principal strain. This is because the analysis uses a distributed crack model based on the assumption that cracks are uniformly distributed in the element. As described above, although the local strain generated at the crack location was slightly different, the analysis reproduced the behaviour of the experiment with sufficient accuracy.
Figure 11. Comparison of Shear force- Shear strain relationships by Experiment and Analysis
Shear
Strain (μ) 2000μ 3000μ 4000μ
Exp. (DIC)
Ana. (FEM)
Figure 12. Comparison of maximum principal stress distributions by Experiment and Analysis
-2000 -1500 -1000 -500 0 500 1000 1500 2000
-10000 -5000 0 5000 10000 15000
水平力
(kN
)
せん断ひずみ (μ)
実験結果 解析(繰返し)
Shear strain (μ)
She
ar
fo
rc
e (
k
N
)
-10000 -5000 0 5000 10000 15000
2000
1500
1000
500
0
-500
-1000
-1500
-2000
Exp. Ana. 2000 3000 4000
10000
3000
0
-3000
Shear
Starin (μ) 2000μ 3000μ 4000μ
Exp. (DIC)
Ana. (FEM)
Figure 13. Comparison of minimum principal stress distributions by Experiment and Analysis
CONCLUSION
By applying advanced measurement technologies to the shear wall test, the tendency of crack occurrence under earthquake-like loading was confirmed. Such measurement technologies allows the verification of the crack distribution by image, the surface strain distribution of concrete by DIC method, the strain distribution of concrete inside the wall by acrylic plate gauge, as well as the steel bar strain by optical fiber gauge along steel bars. By the simulation of the experiment carried out by the 3D FE analysis and the comparison to test results in terms of the shear strain, the principal strain distribution of the web wall surface, and the strain of the steel bars, it was confirmed that the test and analytical results correspond very well in the region up to the shear strain γ = 4000μ of the shear wall. In the future, we will investigate the relationship between the damage status and advanced measurement results. In addition, we plan to carry out a study using FE analysis and the correspondence between FE analysis and damage.
ACKNOWLEDGMENT
This research was carried out as part of "Study on Advanced Methods of Seismic Design and Seismic Performance Evaluation for Nuclear Facilities (Phase 2)". I would like to express my gratitude to all those concerned, as noted here.
REFERENCES
[1] Naoshi, U.et.al (2014). Study on evaluation of damage region and failure criterion of RC member failed in shear compression by means of strain index, JSCE Vol.70 No.1, 1-1
[2] Clemens, Horch et.al (2015). Distributed Fiber Optical Sensing Inside the Foundation Slab of a High-Rise Building, AMA Conferences 2015 - SENSOR 2015, pp.531 – 535
[3] The Japan Electric Association (2015). Technical guidelines for a seismic design of nuclear power plants JEAC4601
[4] Yauso, I. et.al (1988),. Shear Cracking Characteristics of Heavily Reinforced Concrete Shear Walls, JCI 10(3), 385-390
[5] Maekawa, K., and Fukuura, N. Nonlinear Modeling of 3D Structural Reinforced Concrete and Seismic Performance Assessment. In Infrastructure Systems for Nuclear Energy, T. T. C. Hsu, C. L. Wu, and J. L. Lin, Eds. John Wiley & Sons Ltd., 2014, ch. 11, pp. 153–184 [6] Amemiya, A and Noguchi, H, "Development of Finite Element Analytical Program for High Strength Reinforced Concrete Members; Part 1:
Development of Concrete Model," Summaries of technical papers of Annual Meeting, Architectural Institute of Japan, Structure II, pp. 639–640.
[7] fib. "fib Model Code for Concrete Structures 2010", 1st ed. f´ed´eration internationale du b´eton/International Federation for Structural Concrete, 2013.
[8] Tokunao, OH-OKA, Yoshinori KITSUTAKA, Ken WATANABE, INFLUENCE OF SHORT CUT FIBER MIXING AND CURING TIME ON THE FRACTURE PARAMETERS OF CONCRETE Journal of Structural and Construction Engineering (Transactions of AIJ) / Vol.65 No.529, pp.1-6, 2000.3
[9] Al-Mahaidi,R.S.H.:Nonlinear Finite Element Analysis of Reinforced Concrete Deep Members, Report 79-1,Dep. of Structural Engineering, Cornell Univ.,Jan.1979
[10] JSCE. Standard Specifications for Concrete Structures - 2012 ”Design”. Tech. rep., Japan Society of Civil Engineers, 2012
3000
1000
0
-1000