Copright 0 1995 by the Genetics Society of America
Interval Mapping of
high
growth
( h g ) , a Major Locus
That Increases Weight Gain
in
Mice
Simon Horvat
and
Juan F. Medrano
Department of Animal Science, University of California, Davis, California 95616-8521 Manuscript received June 20, 1994
Accepted for publication December 20, 1994
ABSTRACT
The high growth locus ( hg) causes a major increase in weight gain and body size in mice. As a first step to map-based cloning of hg, we developed a genetic map of the hgcontaining region using interval mapping of 403 F2 from a C57BL/GJ-hghg X CAST/EiJ cross. The maximum likelihood position of hg was at the chromosome 10 marker DlOMit41 (LOD = 24.8) in the F2 females and 1.5 cM distal to D10Mit41 (LOD = 9.56) in the F2 males with corresponding LOD 2 support intervals of 3.7 and 5.4 cM, respectively. The peak LOD scores were significantly higher than the estimated empirical threshold LOD values. The localization of hg by interval mapping was supported by a test cross of F2 mice recombi- nant between the LOD 2 support interval and the flanking marker. The interval mapping and test-cross results indicate that hg is not allelic with candidate genes Igfl or decon'n (Dcn) , a gene that was mapped close to hg in this study. The hg inheritance was recessive in females, although we could not reject recessive or additive inheritance in males. Possible causes for sex differences in peak LOD scores and for the distortion of transmission ratios observed in F2 males are discussed. The genetic map of the hg region will facilitate further fine mapping and cloning of hg, and allow searches for a homologous quantitative trait locus affecting growth in humans and domestic animals.
T
HE high growth locus (hg) is a major locus that increases weight gain and mature body size of mice by 30-50% and was originally described as a reces- sive gene with nearly complete penetrance (BRADFORD and FAMULA 1984). There is now evidence that hgcan be partially expressed in male heterozygotes ( MEDRANO et al. 1992). The hg locus increases the efficiency of growth by influencing energy metabolism ( CALVERT et al. 1986) without altering overall body composition( CALVERT et al. 1985). Cloning of the hg locus would permit functional characterization of hg and enable studies of homologous loci in humans and domestic animal species. In the latter, this may lead to identifica- tion of a quantitative trait locus (QTL) for rapid and efficient growth, a trait of significant economic impor- tance in the livestock industry.
Previous genetic analyses ( MEDRANO et al. 1992) es- tablished linkages between hg and insulin-lih growth fac- tor-1 ( Igfl) and Steel ( SI) , two loci on mouse chromo- some 10. A concurrent physiological study ( MEDRANO et al. 1991 ) determined that the inheritance of hg is associated with elevated circulating levels of IGF1, a finding that suggested Igfl as a candidate gene for hg. To test the hypothesis that hgis allelic with Igfl and as a prerequisite for physical cloning of hg, a finer genetic map of the hgcontaining region was needed.
One approach for improving the map resolution of a
Corresponding author: J. F. Medrano, Department of Animal Science, University of California, Davis, CA 95616-8521.
E-mail: [email protected]
Genetics 139: 1737-1748 (April, 1995)
locus affecting a quantitative trait is by interval mapping (LANDER and BOTSTEIN 1989) in larger crosses between genetically distant inbred lines using dense molecular genetic maps. This approach has been used to identify map locations of QTLs in plants ( PATERSON et al. 1988, 1991; STUBER et al. 1992) and in mammals (JACOB et al. 1991).
This study was designed to develop a genetic map of the region around hgand to characterize hginheri- tance and phenotypic effects using interval mapping in a large F2 cross between C57BL/ 6J-hghg (Mus musculus domesticus) and CAST/ EiJ mice ( M. musculus casta- neus)
.
In a search for other potential candidates from the homologous region in humans, we developed and mapped a genetic marker for the murine decon'n (Dcn) gene. A test cross of selected F2 recombinant mice was performed to verify the localization of hg determined by interval mapping, a n d / o r to test for allelism be- tween hgand lgfl and between hgand Dcn.MATERIALS AND METHODS
Mapping population: A thorough description of the discov- ery of hgis presented in BRADFORD and FAMULA ( 1984). The hglocus has since been introgressed into the C57BL/ 6J back- ground by nine backcrosses to create congenic mice C57BL/ 6J-hghg. In this experiment, animals from the sixth generation of inbreeding C57BL/ 6J-hghgmice ( HG) were used. To initi- ate our mapping cross, eight HG females were crossed to two CAST males (CAST/ EiJ line; Jackson Laboratory, Bar Harbor, M E ) . A total of 62 F1 mice were produced. The F2
generation (403 mice) was generated by 42 brother-sister F1
1738 S. H o n u t a n d J . F. Medrano
and third parity matings, respectively. The F2 mice were weighed weekly from 14 t o (53 days of age.
Genotyping: A l l the mice from the parental, F, antl F., gen- erations were genotyped for nine microsatellite markers; I)lOMi/9, I ) I O M i / l O , l ) l O M i / l 2 , I ) l O M i / 1 4 , I)IOA4i/.31, I)IOMi/41, I)IOiMi142 ( D I I X K K X I rl (11. 1992), I1IO,Vrls2 (<:OK- NAI.I. PI ( I / . 1 9 9 1 ) and I , l ( MI<I~RAXO rf rtl. 1992)
.
F., genotype data ( n = 403) was submitted to Mouse Genomr 1)atahase (accesion number MGD-CREX"LJ4).
I d 1 microsatellite primers used were lGF3 ( 5 '-A(;TC(;AG(X;A?TT(;AATGAC~ATCAT) and IGF8 ( 5 '-T<;T(~A(:<:TC<:T<;(;A(;(~C~~G(;) .
Markers 1~1OMi19, I)IOMi/lO, I~lOMi112, I~IOMi114, DlOkii142 and lqfl were assayed using a polymerase chain reaction (PCR) essentially a s described in DIHKK:II rl 01. ( 199'2) ; for DIOMi/42 the annealing temperature was increased to 60"
and the number o f cycles to 40. Primers were obtained from Research Genctics (Hrlntsville, AL)
.
PCR reactions were run in flexible, 96 U-bottom well plates (FALCON 391 1, Rccton Dickinson, Oxnartl, CA) on Thermal Cycler PTC96 (M,J Re- search, Watertown, MA). To increase the efficiency o f gentr typing, some markers were amplified in the same PCR reac- tion (multiplexed) and/or loaded together on the same 7% denaturing polyacrylamide gel as follows: a multiplex PCR reaction of DIOMi/9, IlIOMi/lO, I)l01bfill4 was analyzed onthe same gel; a multiplex PCR rcaction of I1lf)A4i/l2 and IgJ 1
was loaded together w i t h Dl01bfi142. Markers DIO.Ws2, I)IOMi/?1 and I)lOMi141 were amplified following the condi- tions described for DIONds2 ( COKN,\I.I. rl nl. 1 9 9 1 ) and PCR products were analyzed on 2.5% agarose gels (IBI, New Ha- ven, CT)
.
Autoradiograms antl pictures o f agarose gels were independently scored twice by h v o people. Markers l ) l O M i / 4 2 , I~IOMil9, I)IOMillO, IlIOMi141, DlOMi112 and l ) l O . V d ~ 2 were chosen to cover the genomic region between IgJI and S/wl( S I ) , which was consiclcrerl a candidate region for hg from previous mapping studies ( MI<I)IL\SO rl nl. 1992)
.
The proxi- mal marker I)lOMi/3I was included because of its linkage t o oncogenes ( r g . , k:yn, I - h s l ) antl a crll division qclr 2 homlog ( G l c 2 n ) , genes involved in the control of cell differentiation and growth. The distal marker, DlOMil14, was studied becauseof its linkage to j q p n y (j>g) , a locus w i t h a known mutation affecting body size (M,zcAKnIllK 1944).
Generation of a PCR-based marker for the murine D m
gene and genetic mapping: We searched for polymorphisms between HG and GZST DNAs in intron 4 o f the murine I)cn gene. The intron 4 sequences were first amplified with prim- ers in exon 4 (DCNE4.P.5 = 5'-TGTCCATGAGAAT<;A(;AT-
C A C X A ) and in exon .5 (DCNE5.P3 = 5'-(;CCTTC<AGGGA- CTGAAGAGTCT)
.
These two primers were designed on the basis of a mouse cDNA decorin sequence (EMBL accession No. X53929) and generated a 1.1-kb PCK product. The DCNE4.P5/ DCNE5.M PCR product was sequenced from both ends using an Jmol-Cycle Sequencing Kit (Promega, Madison, WI).
Upon identification of a7p
polymorphic site 8.5 bp downstream of exon 4, another primer was designed in intron 4 (DCNI4.PS = .5'-CTGGCACAAG(:AC<:TTC;T<:AC).Primers DCNE4.P5 and DCNI4.P3 amplified a 240-bp frag- ment (GenBank accession No. L38611) spanning the 77/1
polymorphic site. I n the HG DNA, two
7p
sites in the DCNE4.P5/ DCN14.P3 PCR product produced fragments of 25, 84 and 131 bp; in the CAST DNA, one7p
site produced two fragments of 131 and 109 bp (Figure 1 ) . The PCR-ampli- fication components for DCNE4.P5/ DCNI4.1'3 product were 40 ng DNA, 0.3 pi4 o f each primer, 1 X PCR buffer ( 5 0 milKCI, 10 mM Tris-HCI, pH = 9.0, 0.1% Triton X-100, Pro- mega), 1.50 PLY each of dNTPs and 2 m%I MgCL, 0 . 5 units o f Tnq DNA polymerase ( Promega) in a final volume of 20 pl.
The amplification profile was 30 cycles at 94" (15 sec), 60" ( 1 min) and 72" ( 1 m i n ) ; in the first cycle the denaturation
4
0
0
e 3 0 0
e200
240+
131+
109+
84-.
e l 0 0
50
FI(;twI.: 1 .--X '/)l IYX-I<FI,l' nx~rkcr i n thr murine rlrcofin ( I k n ) gene w i t h fragment sizrs ( i n 1x1s~ pairs) displayed o n the left side; L.ane I , undigrsted PCK product; lane 2, HG ((37BI./(jJ-hghg) DNA; lanr 3, CAST (CAST/EiJ) DNA; lane 4, F, ; lane M, DN.4 size marker (.X)- t o 2000-bp size marker, BIO-RAD, (:A) with sizes displayed o n the right side. Standard inbred strains (:.57BL./(jJ, I)BA/2J, A/.] and CSH/HeJ show pattern of lane 2, while AKR/.j and SPRET/Eil that of
lane 3.
step was 97" ( 2 min) and i n the last cycle, the extension time a t 7'2" was incrcasetl t o .5 min. PCR products were digested for 4 hr at 65" by directly adding to the PCR reaction (under o i l ) a premix containing 1 unit 731 (New England Riolabs, Reverly, M A ) , 3.0 pl of IOX buffer 3 and 6.5 pl sterile water. Digests were analyzed by electrophoresis in 3% 0.5X TBE- agarose. The Dcn marker w a s first mapped to the interval between I)IOMi/41 and I)IOMi112using a subset of informative recornbinant F2 mice. The genetic distances from I k n to
IIlOMi/41 and Dl01bfill2 we~-e then tleterminetl using 28 F? mice ( 17 females, 11 males) , that were recombinant for the 1)10Mi/41 to I)IOMi/12 intel-val. We a l s o tested this marker in six standard inbred strains. Strains A/J, C.i7RL/GJ, DBA/2J
antl C3H / HeJ protluccd a p t t e r n obsenred in HG mice and strains AKR/.j and SPRET/ElJ produced a pattern of CAST. Test cross: The test cross involved matings between F2 and HG mice. Mice were weighed at 21 and 42 days o f age.
To test for allelism between hgand I g f l , live types ol'crosses were performed (Tables 1 antl 2 ) . A first control cross in-
Mapping the high growth Locus
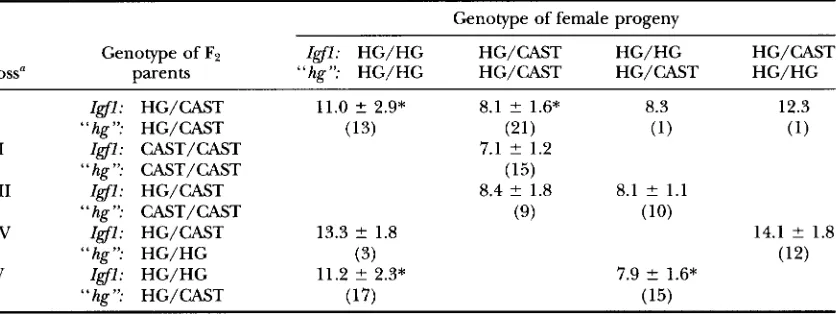
TABLE I
Test of allelism between Zgfl and hg: female progeny from a F2 X HG test cross
1739
Genotype of female progeny
Genotype of F2 Igfl: HG/HG HG/CAST HG/HG HG/CAST
Cross“ parents “hg”: HG/HG HG/CAST HG/CAST HG/HG
I Igfl: HG/CAST 11.0 ? 2.9* 8.1 ? 1.6* 8.3 12.3
I1 Igfl: CAST/CAST 7.1 ? 1.2
I11 Igfl: HG/CAST 8.4 ? 1.8 8.1 ? 1.1
Iv
Igfl: HG/CAST 13.3 ? 1.8 14.1 ? 1.8V Zgfl: HG/HG 11.2 ? 2.3* 7.9 ? 1.6*
“ hg ”: HG/CAST (13) (21) (1) (1)
“hg”: CAST/CAST (15)
“hg”: CAST/CAST (9) (10)
“hg”: HG/HG (3) (12)
“hg”: HG/CAST (17) (15)
Mean of weight gain from 21 to 42 days of age (g) ? SD (number of animals in parentheses). Means of progeny from a particular cross (i.e., within a row) marked with
* differ significantly (t-test,
P < 0.01). HG, C57BL/6J-hghg alleles; CAST, CAST/EiJ alleles; “ h i ’ , markers defining the hg LOD 2 support interval (DlOMit9, DlOMitlO, DlOMit41, DIOMitl2).a In each cross, progeny were pooled from several test crossed F2 mice (see MATERIALS AND METHODS).
D l OMit41 and homozygous for HG alleles at D m . This female produced a total of 35 progeny in four parities. Progeny were typed for DlOMit4l and D m .
Data analyses: Weight gain from 14 to 63 days of age in F2 mice was analyzed by least-squares using procedure GLM of SAS (1985), with a model incorporating an overall mean, fixed effects of sex, litter size, parity, all two- and three-way interactions and a random residual error. Only the main ef- fect of sex was found to be significant ( P
<
0.001 ) . Therefore, the interval mapping and all other analyses were done, on unadjusted data, separately for each sex. Although we could have made statistical adjustment for the effect of sex and pooled the female and male data sets, analyses separated by sex were more conservative and revealed new information that could have been hidden in pooled data. For example, interval analysis showed that the mode of inheritance of hg and the magnitude of peak LOD scores differed between thesexes, and transmission distortion of chromosome 10 markers was uncovered in F2 males.
Linkage analyses were performed on PC using MAP- MAKER/EXP 3.0 software (LANDER et al. 1987; LINCOLN et al. 1992a)
.
The map position of hgwas determined by interval mapping (LANDER and BOTSTEIN 1989) using MAPMAKER/ QTL 1.1 software ( PATERSON et al. 1988; LINCOLN at al. 1992b). To correct for nonnormality of the distribution of the weight gain variable, we used a logarithmic transformation of weight gain from 14 to 63 days of age in the MAPMAKER/QTL analysis. The inheritance of hg was examined by com- parisons of the peak LOD scores obtained by unconstrained, recessive ( d = -a), additive ( d = 0 ) and dominant ( d = a) F2 trait models. Detailed explanations of F2 trait models can be found in LINCOLN et al. (1992b) and PATERSON et al. (1991). If the peak LOD scores computed under the reces- sive, additive and dominant models deviated from the uncon-
TABLE 2
Test of allelism between Zgfl and hg: male progeny from a F2 X HG test cross
Genotype of male progeny
Genotype of F B Igfl: HG/HG HG/CAST HG/HG HG/CAST
Cross“ parents “hg”: HG/HG HG/CAST HG/CAST HG/HG
I IjJl: HG/CAST 18.0 2 2.8* 13.3 ? 2.6” 12.3 18.3
I1 Igfl: CAST/CAST 12.4 ? 1.9
I11 I@: HG/CAST 12.9 ? 2.5 11.6 ? 2.8
Iv
Igfl: HG/CAST 22.6 2 2.1 24.3 ? 2.6V Igfl: HG/HG 19.4 ? 4.0* 13.4 ? 3.2*
“hg”: HG/CAST (20) (22) (1) (1)
“hg”: CAST/CAST (17)
“hg’: CAST/CAST (20) (22)
“hg”: HG/HG (4) (3)
“hg”: HG/CAST (18) (24)
Mean of weight gain from 21 to 42 days of age (g) ? SD (number of animals in parentheses). Means of progeny from a particular cross (i.e., within a row) marked with
* differ significantly (t-test,
P < 0.01). HG, C57BL/6J-hghg alleles; CAST, CAST/EiJ alleles; “hg”, markers defining the hg LOD 2 support interval (DIOMit9, DlOMitlO, DlOMit41, DlOMitl2).1740 S. Horvat and J. F. Medrano
strained model by more than two LOD score units, which corresponds to at least a 100-fold reduction in the likelihood ratio, the model was not considered as a likely inheritance model for hg. Similarly, regions outside the hgLOD 2 support interval ( i e . , regions that yielded LOD scores lower by at least two units compared with the LOD score at the hg maximum likelihood position) were not considered as regions likely to contain hg. SAS software ( SAS 1985) was used to compute frequencies and probabilities of the chi-square values in the marker segregation analyses, and to compare means (t-test) between genotypic classes in F, and test-cross progeny.
Because the peak LOD scores at the hg maximum likeli- hood location were lower in F P males (LOD = 9.56) than F2
females (LOD = 24.8), we examined whether the effects of hg between the sexes could account for the peak LOD scores differences. The difference between the mean weight gain from 14 to 63 days of age of HG/ HG and CAST/ CAST genotypes at DlOMit41 (marker closest to the hg maximum likelihood location) were 5.2 g and 4.5 g in FY females and males, respectively. The means of the HG/CAST and CAST/ CAST genotypes differed by 0.8 g and 1.5 g in F P females and males, respectively. On the basis of these differences, we adjusted the weight gain from 14 to 63 days of age in the male data to the magnitude of the effect in F2 females, by increasing the weight gain in HG/HG males by 0.7 g and decreasing it in HG/CAST males by 0.7 g. The modified male data set was then analyzed using MAPMAKER/ QTL 1.1 software package as described above (see DISCUSSION)
.
Estimation of empirical LOD score threshold values: Emp- irical threshold values were estimated for the F, females and males as described by CHURCHILL and DOERGE (1994). The original set of trait values (logarithm of weight gain from 14 to 63 days of age) was randomly permuted (shuffled) to generate 1000 shuffled data sets. A shuffled data set was gener- ated by indexing the original set of trait values, assigning a random number to this trait-index, and sorting the traits by random numbers. This procedure was repeated 1000 times. The shuffled data sets along with the original (unshuffled) set were then analyzed by MAPMAKER/ QTL software version 0.9 for VAX/VMS. The experimentwise critical value was ob- tained by ordering the maximum LOD scores from each of the 1000 analyses of shuffled data sets and locating their 950th ( 1 - a = 0.95) and 990th ( 1 - a = 0.99) value. The programs for shuffling and other manipulation of data were made using
SAS software ( 1985).
RESULTS
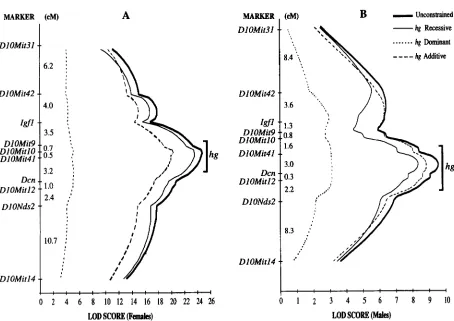
Interval mapping of the hg locus: A genetic map of the hgcontaining region in the HG X CAST intercross is displayed in Figure 2. T h e hg locus was localized by interval mapping using genetic markers from the distal half of the mouse chromosome I O , and the trait, loga- rithm of weight gain from 14 to 63 days of age. T h e maximum likelihood position of hg in the F2 females was at DlOMit41 (Figure 2A, LOD = 24.81 ) and in the F2 males 1.5 cM distal to DlOMit41 (Figure 2B, LOD = 9.56). This location accounted for 41.5 and 22.2% of t h e F2 variance in females and males, respectively. The LOD 2 support interval for the hglocation encom- passed a 3.7-cM (females) and a 5.4cM (males) region surrounding the corresponding maximum likelihood positions. T h e male and female LOD 2 support intervals overlap in the interval of 2.6 cM from the position 0.6
cM proximal to DlOMit4I to the position 2 cM distal to D l OMit41.
LOD score threshold values: The peak LOD scores in our analyses appeared to be highly significant when compared with “typical” threshold values of between 2 to 3 (for a = 0.05) suggested by LANDER and BOTSTEIN ( 1 9 8 9 ) . However, these threshold values may not be appropriate for use in our study, because o u r experi- mental conditions were different from the conditions assumed in LANDER and BOTSTEIN’S study. O u r QTL analysis was based on the markers defining a single linkage group of -30 cM rather than on markers cov- ering the whole genome. Also, in the males, segregation distortion was encountered. Differences in these a n d other experimental conditions may require different threshold LOD values for detecting significant QTL ef- fects ( CHURCHILL. and DOERCE 1994). We hence deter- mined the empirical threshold values that applied to characteristics of our experiment (see MATERIALS AND METHODS)
.
The empirical experimentwise thresholdLOD scores for the significance level of a = 0.05 were 1.95 and 1.97 in F2 females a n d males, respectively, and for the significance level of a = 0.01 were 2.7 and 2.95 in F2 females and males, respectively. T h e observed peak LOD scores were much larger than the estimated empirical threshold LOD scores indicating a significant effect of hg.
Inheritance and phenotypic effects of hg: To investi- gate the mode of inheritance of hg, LOD scores com- puted by the unconstrained F2 trait model were com- pared to LOD scores obtained by constrained models such as pure recessive, pure dominant, and pure addi- tive (Figure 2 )
.
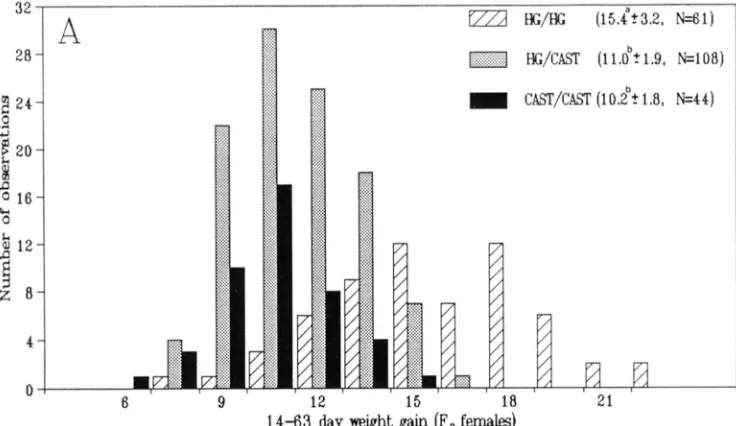
If the likelihood of a constrained model showed a deviation of 2 LOD units or more from uncon- strained model likelihoods, then we considered that type of gene action unlikely. We could not reject reces- sive inheritance for females and additive o r recessive inheritance for males. The mode of inheritance and phenotypic effects of hg in this cross is also observed comparing the mean weight gains of the three F2 geno- typic classes at the marker DlOMit41 (Figure 3 ).
H G / H G F2 females and males were significantly larger ( 1 -test, P < 0.01 ) than HG/CAST and CAST/CAST mice. HG/CAST F2 males were also significantly larger than CAST/CAST males, but this was not the case with fe- males. These results confirm the analysis of hg inheri- tance by interval mapping indicating a recessive mode of action in F2 females and a partially recessive mode in F2 males.
Mapping the high growth Locus 1741
MARKER
DlOMit3l
D l OMit42
I g f l
DlOMttlG DlOyit5 DlOMit41
Dcn DIOMitI2
D l ONds2
DlOMitlli I
!
(CM)
6.2 :
I
4.0
i
3.5 ',
0.7 *,
0.5 :
3.2
i
1.0 2.4 I.)I
10.7 ;
A
Ihg
4-
0 2 4 6 8 10 12 14 16 18 20 22 24 26
LOD
SCORE
(Females)MARKER (cM)
B
-
UnconstrainedDlOMit31 ..*,*.
',\
-
hg Recessive...
hg E m t&._I
DIOMdO DlOMit9
1:;
h 1 2 3 4 5 6 7 8 9 i O
LOD
SCORE
(Maks), , , . I . . . . .
FIGURE 2.-Interval mapping of the high growth locus ( hg) using the logarithm of weight gain from 14 to 63 days of age (A,
based on F2 female data; B, based on F2 male data). QTL maximum likelihood plots for the four F2 inheritance models (unconstrained, recessive, additive, dominant) are displayed. The bracket indicates the LOD 2.0 support interval for the maxi- mum likelihood location of hg.
sembly control ( RUOSLAHTI and YAMAGUCHI 1991 ) , maps to human chromosome 12q23 ( DANIELSON et al.
1993) or 12q21.3. (VETTER et al. 1993). Therefore, we examined whether the murine Den gene maps to the distal half of mouse chromosome
IO
and if so, how close to the hglocus. We developed a PCR-based marker for the murine Den gene (Figure 1 ),
and mapped it 3 cM distal to DIOMit41 (Figure 2 ).
In relation to hg, the Dcn gene maps within the hg LOD 2 support interval in males and falls 1.2 cM beyond the distal border of the hg LOD 2 support interval in females. The hglocus, therefore, appears to be closely linked to the murine Dcn gene.Test crosses to verify the localization of hg obtained by interval mapping and test for allelism between hg and
Zgfl
and between hg and Dm: Our mapping analysis(Figure 2 ) positioned the Z g f l locus -3 cM proximal to the boundary of the hgLOD 2 support interval. LOD scores for hg at Igfl were 8 units (females) or 3.3 units
(males) lower than the maximum likelihood LOD scores. These results suggest that hg and Igfl are not allelic. To provide further support for this hypothesis and to verify if hg is located distal to I g f l as implied from interval mapping, F2 mice, recombinant and non- recombinant between the Igfl locus and the hg LOD 2 support interval, were crossed with HG mice. The prog-
eny of nonrecombinant F2 mice that were heterozygous for both Z g f l and hg LOD 2 support interval (cross I, Tables 1 and 2 ) segregated two significantly different weight gain phenotypes between mice carrylng HG al- leles at Z g f l and hgLOD 2 support interval and hetero- zygotes. The progeny of FB mice that were heterozygous for the hgLOD 2 support interval but were homozygous for HG alleles at I g f l (cross V, Tables 1 and 2 ) also showed a similar segregation, in that progeny homozy- gous for HG alleles within the hgLOD 2 support interval were significantly larger compared to littermates het- erozygous for the hg LOD 2 support interval. In con- trast, progeny of F2 mice heterozygous at I g f l but homo- zygous within the hg LOD 2 support interval for CAST alleles (cross 111, Tables 1 and 2 ) or HG alleles (cross I V , Tables 1 and 2 ) did not exhibit segregation and the means for weight gain from 21 to 42 days of age of heterozygous and homozygous progeny for HG alleles at I g f l did not differ significantly. These results support the implication from interval mapping that hgand I g f l
are not allelic, and that hg is located distally to I g f l .
1742 S. Horvat and J. F. Medrano
FIGURE 3.-Distribution of number of observations by genotypic classes at the DlOMitll locus for the weight gain from 14 to 63 days of age in F2 females ( A ) and F2 males ( B ) ; HG, CAST indicate alleles from C57BL/GJ-hghg, CAsT/EiJ parents, respectively. The numbers in parentheses indicate the means 2 SD and a number of individuals ( n ) of a particular genotypic class. Means of the genotypic classes marked with different superscripts (a, b, c ) differ significantly (t-test, P
<
0.01). The overall mean 5 SD of the F2 population was 12.1 2 3.17 ( n = 213) and 16.2 g 2 3.47 ( n = 190) in females and males, respectively.performed. If hgwere an allele of Dm, all the progeny would be expected to have a highgrowth phenotype. Conversely, if hg localized within the hg LOD 2 support interval, progeny would be segregating for hg. The mean ? SD for weight gain from 21 to 42 days of age of the progeny homozygous for HG alleles at DIOMit41 and
D m
was 12.4 2 1.7 g for females ( n =7)
and 20.9 ? 3.6 g for males ( n = 12). These weight gains were significantly higher (t-test, P<
0.05) than the weightgains of their sisters (10.3 2 1.4 g, n = 10) or their brothers
(15.7
? 2.0 g, n = 6 ) who were heterozygous at DIOMit41 but homozygous for HG alleles at Dm, suggesting a segregation for hg. Therefore, the hg locus is not allelic with Dcn and resides proximally to the murine Dm gene as implied from the peak LOD scores from interval analysis.Mapping the high growth Locus 1743
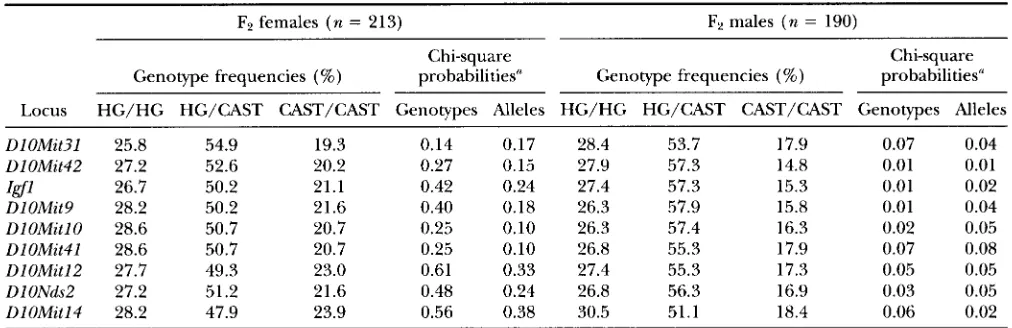
TABLE 3
Genotype frequencies and chi-square probabilities of allelic and genotypic segregation in the HG X CAST intercross
F2 females ( n = 213) F2 males ( n = 190)
Chi-square Chi-square
Genotype frequencies (%) probabilities" Genotype frequencies (%) prObdbilitieS"
Locus HG/HG HG/CAST CAST/CAST Genotypes Alleles HG/HG HG/CAST CAST/CAST Genotypes Alleles
DlOMit3l 25.8 54.9 19.3 0.14 0.17 28.4 53.7 17.9 0.07 0.04
UlOMit42 27.2 52.6 20.2 0.27 0.15 27.9 57.3 14.8 0.01 0.01
DlOMit9 28.2 50.2 21.6 0.40 0.18 26.3 57.9 15.8 0.01 0.04
DlOMitlO 28.6 50.7 20.7 0.25 0.10 26.3 57.4 16.3 0.02 0.05
DlOMit41 28.6 50.7 20.7 0.25 0.10 26.8 55.3 17.9 0.07 0.08
DlOMitl2 27.7 49.3 23.0 0.61 0.33 27.4 55.3 17.3 0.05 0.05
DlONds2 27.2 51.2 21.6 0.48 0.24 26.8 56.3 16.9 0.03 0.05
DlOMitl4 28.2 47.9 23.9 0.56 0.38 30.5 51.1 18.4 0.06 0.02
I d 1 26.7 50.2 21.1 0.42 0.24 27.4 57.3 15.3 0.01 0.02
Expected Mendelian ratios: genotypes 1 :2: 1, alleles 1 : l .
ratios of 1:2:1 for genotypic frequencies and 1:1 for allele frequencies, a chi-square analysis was performed for 213 F2 females and 190 F2 males. In the males, sig- nificant deviations ( P I 0.05) from the expected geno- typic and allele frequencies were observed for most markers (Table 3 ) . The main contributing factor to distortion of transmission ratios in F2 males appears to be an underrepresentation of homozygotes for the CAST alleles at chromosome 10markers analyzed here. In F2 females, however, no significant deviations from expected genotype and allele segregation ratios were observed. We noted, though, that a proportion of CAST
/
CAST homozygotes in F2 females also tended to be lower, although not as pronounced as in F2 males.DISCUSSION
Interval mapping of hg and test crossing: We devel- oped a genetic map of a region containing hg by inter- val mapping analysis in a large HG X CAST F2 cross. The maximum likelihood position of hg was at DlOMit41 (LOD = 24.8) in F2 females and 1.5 cM dis- tally from that locus in F2 males (LOD = 9.56) with the surrounding 3.7-cM (females) and 5.4cM (males) LOD 2 support interval. The interval mapping thus yielded similar maximum likelihood positions between sexes with highly significant LOD scores, and narrow LOD 2 support intervals. Inheritance of hg was essen- tially recessive in F2 females. In F2 males, however, re- sults demonstrate partial recessiveness of hg suggesting some expression of hg in male heterozygotes and con- firming our observations from previous crosses ( ME-
The genetic mapping of hg obtained in the present study is supported by previous linkage studies (ME-
DRANO et nl. 1992) that suggested a putative location of hg between two loci on mouse chromosome 10, Igf 1 and Steel. This region of the mouse chromosome 1 0 has also been reported to contain QTL( s ) that increase DRANO et d . 1992 )
.
growth in a population of Quackenbush-Swiss (QS) mice (COLLINS et al. 1993). Strong associations were found between DlOMitl2 and DlOMitl4 genotypes and increased 42-day body weight. It would be of interest to determine whether the enhancing effect on growth observed in hgand QS mice is controlled by an allele ( s )
at the hg locus or different linked loci.
The results of the test-cross experiment provided fur- ther support for the localization of hg by interval map- ping, and also suggested that hg is not allelic with I g f l and
D m .
The I g f l gene was considered a possible candi- date for hg because of genetic linkage ( MEDKANO etnl. 1992) and because elevated levels of IGFl plasma protein were detected in high growth mice ( MEDRANO
et al. 1991 )
.
However, in the present interval mapping analysis, the I g f l locus was localized -3 cM outside the proximal border of the hg LOD 2 support interval. A test cross of FP mice recombinant between the I g f l locus and the hg LOD 2 support interval revealed that the test-cross progeny homozygous for HG alleles within the hg LOD2
support interval expressed the high-growth phenotype regardless of their allelic composition at theIgfl locus, whereas the test-cross progeny homozygous for the HG alleles at I g f l but heterozygous for the hg LOD 2 support interval did not express the high-growth phenotype. These results demonstrate that I g f l and hg are two separate loci and that hg is located distally from the I s f l locus, as suggested by the peak of the LOD- QTL curve and its LOD 2 support interval. The localiza- tion of hg to the hg LOD 2 support interval was also confirmed in a test cross of an F3 female recombinant between the Dcn and markers in the hg LOD 2 support interval. The progeny that were homozygous for HG alleles within the hg LOD 2 support interval and
D m
1744 S. Horvat and J. F. Medrano
that hg is located proximally to Dcn. The combination of the hginterval map and the test-cross results provide genetic evidence that hgis not an allele of Z g f l or Dcn,
and that the genomic segment between DlOMit9 and
Dcn is likely to contain the hg locus.
The high-growth mice appeared in a stock subjected to selection for rapid postweaning growth (BRADFORD and FAMULA 1984). Because the high-growth mice ap- peared in a single litter in one of the two closely related sublines, it was suggested that the origin of hgwas most likely a spontaneous mutation in a single gene. The authors also noted that hg could be a preexisting allele whose effects could be uncovered in a background of positive growth QTLs generated by selection. Another possible explanation for the origin of hg could be that recombination produced a desirable combination of two ( o r more) closely linked alleles that would behave genetically as a single hglocus. Common to these expla- nations is the assumption that hg resides in a single locus. This assumption is supported by the present study in that interval mapping revealed the hg location with a defined peak of a QTL curve and narrow hg LOD
2
support interval. Furthermore, the positioning of hgin the LOD 2 support interval was verified by a test-cross experiment. However, because the interval mapping method can not resolve closely linked QTLs, we cannot eliminate the possibility that the hg effect is controlled by two (or more) alleles, linked within the hg LOD 2 support interval. Future fine resolution hgmapping and cloning should reveal whether hg is a single allele or a cluster of linked alleles.Threshold LOD scores and sex differences in the hg peak LOD scores: The estimated empirical threshold LOD score values were essentially the same in the F2 females and males and similar to threshold values typi- cally used to declare a significance of a QTL effect
(LANDER and BOTSTEIN 1989). This suggests that the specific features of our experiment (e.g., only a single linkage group used and transmission distortion present in the males) , did not markedly influence the threshold LOD values. The 1000 shuffled data-sets used to esti- mate the empirical threshold LOD values in this study will be utilized in our future QTL analyses of this cross to determine threshold LOD values for growth QTLs located elsewhere on the genome. Such empirical threshold LOD estimations will be particularly useful in assessing the significance of effects of QTLs with small effects.
A large difference in the LOD scores at the maximum likelihood position of hg was detected between the sexes (24.8 and 9.56 LOD units in females and males, respectively). Some possible causes for this may be dif- ferences in the allelic and dominance effect of hg and
/
or differences in epistatic effects of growth QTLs be- tween the sexes, differences in the number of growth QTLs between the sexes and differences in the genetic composition of the X chromosome ( s ) between our F2
females and F2 males which may have generated differ- ences in the effects of assumed X-linked growth QTLs. These factors may have decreased the overall impor- tance of the effect of hgon the total genetic or pheno- typic variation of F2 males, which in turn could be re- sponsible for the observed lower LOD scores in F2 males.
Sexual dimorphism in the allelic and epistatic effects has been demonstrated for bristle genetic factors in Drosophila (LONG et al. 1995). In our cross, the stan- dardized allelic effect, 1/2{
[&,,,,
- f i C A S T / a T ]/
SDF2sOr p1,
at DlOMit41 was 0.82 in F2 females and 0.65 in F2 males suggesting a slightly lower effect of hg in F2 males. Also, the analysis of different inheritance models in interval mapping and the comparison of standardized dominance effects, { -'12
( -%G/HG+
&T/CAST )1
/SDFZJor pI ,
at D1OMit41 (-0.57 and -0.22 in F2 females and F2 males, respec- tively) indicate sex differences in the dominance effect of hg. We thus examined how the peak LOD score in F2 males would change if we made the effect ofDlOMit41 in F2 males similar to F2 females (see MATERI-
ALS AND METHODS)
.
The "MAKER/ QTL analysis ofthe modified F2 male data set yielded a peak LOD score of 14.4 units. This increase of 4.8 LOD units in compari- son with the peak LOD score (LOD = 9.56) of the original F2 male data set accounts for 31.7% of the difference in peak LODs between the sexes. Therefore, differences in sex-specific effects of hg alone cannot account for the observed differences in LOD scores between the sexes. However, there may have been sex differences in epistasis and/or allelic and dominance effects of growth QTLs located elsewhere on the ge- nome or differences in the number of growth QTLs between the sexes. If such differences produced larger effects in the males, this could have increased the ge- netic "noise" and contributed in lowering the hg peak LOD score in F2 males.
Our F2 females and F2 males differed in genetic com- position of sex chromosomes. An F2 female from the intercross of an HG (grand dam) X CAST (grand sire )
carried on average 50% HG/HG and 50% HG/CAST loci on chromosome X. In contrast, an F2 male was hemizygous on average for 50% HG and 50% CAST chromosome X alleles. Recent studies have provided evidence for the existence of growth QTLs on the X chromosome in mice ( HASTINGS and
VEERKAMP
1993;VEERKAMP et ul. 1993; RANCE et al. 1994). Because the genetic composition of the X chromosomes was differ- ent between the F2 females and F2 males, X-linked growth QTLs could have produced different effects be- tween the sexes; this may have contributed to the differ- ence in the hgpeak LOD scores between F2 males and F2 females.
Mapping the high growth Locus 1745
in the hg peak LOD scores between the sexes. A ge- nome-wide mapping and the analysis of genetic factors controlling postweaning gain in females and males of this intercross may provide such answers.
Transmission ratio analysis Our analysis revealed that allelic and genotypic transmission ratios of most of the chromosome 10 markers were significantly altered in F2 males but not in F2 females. Several studies involv- ing backcrosses between inbred strains of M. m. doms- ticus and a strain of wild mice M. spetus (JUSTICE et al. 1990; ROW et al. 1994) or M. m. musculus (KOZAK et
al. 1990) have also detected segregation distortion in the region of the mouse chromosome 10 studied here, but there were no reports on differences in allelic inher- itance between sexes. Sex-specific differences in allelic inheritance of a region from chromosome 2 were dem- onstrated in a study of backcross mice originating from a cross between (C57BL/ 6J X M. spetus) F1 X C57BL/ 6J ( SIRACUSA et al. 1991 )
.
The authors provided elabo- rate discussion on potential sources of distortion in al- lelic inheritance and possible explanations for the ob- served sex-specific differences. They suggested that transmission distortion may be due to differences in production or survival of gametes ( e.g., during gameto- genesis in F1 female and F1 male parents in our case), differences in fertilization efficiencies and differences in the survival of embryos or neonatal progeny.The main factor contributing to the transmission dis- tortion in F2 males in our study was underrepresenta- tion of F2 males that were homozygous for CAST alleles at chromosome 10 loci. The mortality of neonatal progeny (between birth and
-
10 weeks of age) was low in our cross. From a total of 403 F2 mice, 5 pups died between birth and2
weeks of age, while 1 male(HG/HG for the analyzed chromosome 10 markers) and 1 female died between 3 and 4 weeks of age. There- fore, the neonatal loss was too small to account for the observed transmission distortion in F2 males.
It is likely that transmission distortion in F2 males occurred in prenatal stages, during gametogenesis, fer- tilization or embryogenesis. One possible explanation would be that homozygosity for CAST alleles at a locus
(loci) , from the analyzed region of chromosome 1 0
would have an adverse effect on survival of male em- bryos or that male embryos that were heterozygous or homozygous for HG alleles at a locus (loci) from the analyzed region of chromosome 10 would have selec- tive survival advantage. Alternatively, it may be that HG X CAST F1 female’s reproductive environment might have been hostile to male embryos homozygous for CAST alleles at a chromosome 10 locus (loci) or might have provided selective advantage to male embryos that were heterozygous or homozygous for HG alleles at a chromosome 10 locus (loci). If the aforementioned effects during embryogenesis were the source of trans- mission distortion, they should be expected to result in a significant difference in the ratio of neonatal fe-
ma1es:males (e.g., fewer male mice). However, sex ra- tios in our experiment
(213
females:190 males) did not differ significantly from a Mendelian segregation ratio of 1:l ( P<
0.05).
It is then less likely that the loss of male embryos carrying CAST alleles from the chromo- some 10 region analyzed here or selection for embryos that were heterozygous or homozygous for HG alleles at a locus (loci) of chromosome 10 is the source of transmission distortion observed in F2 males.Another explanation for transmission distortion in F2 males would be the differences in production, survival and
/
or fertilization efficiency between the Y chromo- some-bearing sperm carrylng CAST alleles at a chromo- some 10 locus (loci) and the Y chromosome-bearing sperm carrying HG alleles at a chromosome 10 locus(loci)
.
Either type of sperm may be selected for or against. Differences in production or survival of the two types of Y chromosome-bearing sperm could be tested by genotyping single sperm of an HG X CAST F1 male for chromosome 10 and Ychromosome loci ( SCHMITIet al. 1994). This would allow determining a ratio of the two types of Y chromosome-bearing sperm and test- ing of this ratio for significant deviations from the ex- pected 1:l ratio. If this ratio is not significantly different from the expected, one would then test for differences in fertilization efficiency of the two types of Y chromo- some-bearing sperm of an HG X CAST F1 male. The test would involve sexing and genotyping for PCR-based markers of male preimplantation embryos ( HORVAT et al. 1993) to analyze for chromosome 10 marker segre- gation. If the male preimplantation embryos carrying CAST alleles at a chromosome 10 locus (loci) are un- derrepresented, this may suggest that the difference in fertilization efficiency between the Y chromosome- bearing sperm carrying W T alleles at a locus (loci) from the analyzed region of chromosome 10 and the
Y chromosome-bearing sperm carrying HG alleles at a locus (loci) of chromosome 10 may account for the observed transmission distortion in F2 males.
1746 S. Horvat and J. F. Medrano
Dcn marker, which was typed only in
17
F2 females re- combinant in the interval DlUMit41 to DlUMitlZ, still resulted in decreased size of the LOD 2 support interval to 3.7 cM. Therefore, reanalyzing our data set with addi- tional markers closely linked to hg may further narrow the hg LOD 2 support interval and hence potentially increase the accuracy of hg mapping. However, as the number of recombinants becomes limiting, adding more markers will not increase the map resolution. DARVASI et al. ( 1993) demonstrated that even for a QTL of large effect ( similar to hg), in a large backcross popu- lation ( n = l O O O ) , and using an infinite number of markers, a resolution of the QTL map location needed for physical mapping ( -1 cM) can not be achieved. Although the resolution of the hg map location re- sulted in some improvement as we added more mark- ers, the study of DARVASI et al. (1993) supports our suggestion that further increase in marker density in our cross may not appreciably refine the map resolution of hg.Another way to improve the accuracy of the hg map location using the mapping population employed here would be to detect other QTLs controlling postweaning gain located elsewhere on the genome and include this information in the mapping of hg. Recently, ZENG
(1994) described a methodology combining interval mapping with multiple regression, which involves multi- ple QTL models to increase the QTL mapping accu- racy. Following the same objective, JANSEN and STAM (1994) presented a similar approach, which entails multiple QTL models and the use of parental and F1 phenotypic data. Applying these approaches to hg map- ping, an experiment would involve screening of the present F2 population for more markers covering the rest of the chromosome 1 0 and other chromosomes and reanalyzing our data set with the methodologies described above. This analysis may help to reduce the interfering effects of other (especially linked) QTLs, decrease the unexplained “noise”, and potentially in- crease the precision of hg mapping. In addition, it may uncover other QTLs controlling postweaning gain and possible modifiers of hg.
Future fine resolution mapping of hg: Although us- ing a denser spacing of markers or employing multiple QTL model analysis in the present cross may improve the resolution of the hg map, it will not result in a subcentiMorgan map of the region containing hg. The size and the nature of the cross (intersubspecific) and the mapping methodology itself has its limitations for providing a very fine genetic map resolution of a QTL
( MICHELMORE and SHAW 1988). Ideally, one would pro- ceed with genetic characterization of the region con- taining hg with the approach used by SHRIMPTON and ROBERTSON (1988) in mapping of the linked bristle polygenes in Drosophila melanogaster. This approach is based on an analysis of several congenic lines recombi- nant within a small targeted region to fine map QTL ( s )
in this region and to test for epistatic interactions be- tween tightly linked QTLs. Although fine mapping of hg using the approach of SHRIMPTON and ROBERTSON
( 1988) is theoretically feasible in mice, it would not be practical. The development of several congenic lines carrying small genomic segments from the region con- taining hg would be a time consuming and costly pro- cess.
The fine mapping of hgwould be more feasible using crosses of congenic strains ( PATERSON et al. 1990; JACOB et al. 1991; LANDER and SCHORK 1994). A congenic
strain C57BL
/
6J-hghg is already available, and could be crossed to C57BL/
6J to produce a mapping popula- tion. Assuming that our congenic pair is genetically identical in regions unlinked to hg, then the genetic noise due to segregation of unlinked QTLs would be eliminated and a higher resolution genetic map of hg could be obtained. Fine mapping of hgwould be based on recombinants in the interval containing hg (betweenDlUMit9 and D m ) and progeny tests of these recombi- nants. The ability to define small genetic intervals will depend in part on the density of available genetic mark- ers. The genetic divergence of the region containing hgin this congenic pair appears to be high, because 10 of 18 currently available microsatellite markers between
DlOMit9 and DlOMitl2 are polymorphic. New microsa- tellite markers are continually being produced in mice and will most likely provide additional markers in the region around hg. New markers in the targeted hg genomic region can also be developed using ap- proaches based on the random amplified polymorphic DNA ( GIOVANNONI et al. 1991; MICHELMORE et al. 1991; HORVAT and MEDRANO 1994), the amplified fragment length polymorphism assay (M. ZABEAU, Keygene per- sonal communication ) , or representational difference analysis ( LISITSYN et al. 1994)
.
Mapping the high growth Locus 1747
C57BL/ 6J. If the high fiber number/muscle cosegre- gates with hg and can clearly separate hg genotypes in crosses, this trait may provide a valuable parameter in future high resolution genetic mapping of hg.
Application of mapping hg: A denser map of genetic markers around the hg locus and more accurate charac- terization of the high-growth phenotype should enable fine hgmapping in crosses of congenic strains. The aim of fine mapping is to narrow the hg candidate region to a small genomic segment suitable for physical map- ping and cloning of hg. Cloning of hg will allow mo- lecular characterization of hgproduct and promote fur- ther functional studies to examine the role of hgin the control of mammalian growth. Furthermore, knowl- edge of hgand/ or markers linked to hgwill also permit studies of homologous regions in other species. For instance, the knowledge that Dcn is closely linked to hg may be applied to domestic animals. The cDNAs of Dcn have already been sequence characterized in cattle (DAY et al. 1987) and chickens (LI et al. 1992). There- fore, PCR-based markers in this gene can be developed in these and, potentially, also in related species. These markers can then be tested for associations with growth traits in domestic animals and may uncover a QTL with positive effects on growth. Such markers could provide efficient tools for identifjmg animals with a high ge- netic potential for growth.
We thank RICIIARI) MI(:HEI.MORE, ERIC BRADFORD and JIM MURRAY for their helpful suggestions and critical review of this manuscript. We are grateful to HAKAN SAKUL and LORA DELWICHE for their assis- tance with computer consultations and ANTHONY LONG for his advice on testing for sex-specific effects of hg. We also thank the anonymous reviewers, whose comments helped to improve this manuscript. The authors are particularly indebted to ERIC BRADFORD for his continued support and helpful advice in the development of this work. This work was funded by a grant from the U.S. Department of Agriculture (USDA-CSRS) 92-37205-7840 and by the California Agricultural Experimental Station.
LITERATURE CITED
BRADFORD, G. E., and T. R. FAMUIA, 1984 Evidence for a major gene for rapid postweaning growth in mice. Genet. Res. 44: 293-308. CALVERT, C. C., T. R. FAMULA, J. F. BERNIER and G. E. BRADFORD,
1985 Serial composition during growth in mice with a major gene for rapid postweaning growth. Growth 49: 246-257. CALVERT, C. C., T. R. FAMULA, J. F. BERNIER, N. KHAIM and G. E.
BRADFORD, 1986 Efficiency of growth in mice with a major gene for rapid postweaning gain. J. h i m . Sci. 62: 77-85.
CHURCHILL, G. A,, and R. W. DOERGE, 1994 Empirical threshold values for quantitative trait mapping. Genetics 1 3 8 963-971. CORNAH., R. J.. T. J. AITMAN, C. M. HEARNE and J. A. TODD, 1991
The generation of' a library of PCR-analyzed microsatellite vari- ants for genetic mapping of the mouse genome. Genomics 10:
COLLINS, A. C., I. C . A. MARTIN and B. W. KIRKPATRICK, 1993 Growth quantitative trait loci (QTL) on mouse chromosome 10 in a
454-458.
Quackenbush-Swiss X C57BL/ 6J backcross. Mamm. Genome 4
COPEIAND, N. G . , N. A. JENKINS, D. J. GILBERT, J. T. EPPIG, L. J.
MALTAIS et al., 1993 A genetic linkage map of the mouse: cut" rent applications and future prospects. Science 262: 57-66. DANIELSON, K. G . , A. FAZZIO, I. COHEN, L. A. CANNIZZARO, I. EICHSTET-
TER et al., 1993 The human decorin gene: intronexon organi- 874-881.
zation, discovery of two alternatively spliced exons in the 5' un- translated region, and mapping of the gene to chromosome 12q23. Genomics 15: 146-160.
DARVASI, A,, A. WEINREB, V. MINKE, J. I. WELLER and M. SOLLER, 1993 Detecting marker-QTL linkage and estimating QTL gene effect and map location using a saturated genetic map. Genetics 134
943-951.
DAY, A. A,, C . I. MCQUILLAN, J. D. TERMINE and M. R. YOUNG, 1987 Molecular cloning and sequence analysis of the cDNA for small proteoglycan I1 of bovine bone. Biochem. J. 248: 801-805. DIETRICH, W., H. KATZ, S. E. LINCOLN, H.-S. SHIN, J. FRIEDMAN et al.,
1992 A genetic map of the mouse suitable for typing intraspe- cific crosses. Genetics 131: 423-447.
GIOVANNONI, J. J., R. A. WING, M. W. GANAL and S. D. TANKSLEY, 1991 Isolation of molecular markers from specific chromo- somal intervals using DNA pools from existing mapping popula- tions. Nucleic Acids Res. 19: 6553-6558.
HASTINGS, I. M., and R. F. VEERKAMP, 1993 The genetic basis of response in mouse lines divergently selected for body weight or fat content. I. The relative contributions of autosomal and sex- linked genes. Genet. Res. 6 2 169-175.
HORVAT, S., and J. F. MEDRANO, 1994 Targeting a specific genomic interval to identify RAPD markers linked to the high growth ( hg)
locus in mice. Proceedings of the 5th World Congress on Genet- ics Applied to Livestock Production, Univ. Guelph, Guelph, On- tario, Canada, 21: 71-74,
HORVAT, S., J. F. MEDRANO, E. BEHBOODI, G. B. ANDERSON and J. D. MURRAY, 1993 Sexing and detection of gene construct in mi- croinjected bovine blastocysts using the polymerase chain reac- tion. Transgenic Res. 2: 134-140.
JACOB, H. J., K. LINDPAINTNER, S. E. LINCOLN, K. KLISUMI, R. K. BUN-
KER et al., 1991 Genetic mapping of a gene causing hyperten- sion in the stroke-prone spontaneously hypertensive rat. Cell 67:
213-224.
JANSEN, R. C., and P. STAM, 1994 High resolution of quantitative traits into multiple loci via interval mapping. Genetics 136: 1447-
1455.
JUSTICE, M. J., L. D. SIRACUSA, D. J. GII.RERT, N. HEISTERKAMP, J. GROFFEN et nl., 1990 A genetic linkage map of mouse Chromo- some 10: localization of eighteen molecular markers using a single interspecific backcross. Genetics 125: 855-866.
KOZAK, C. A., M. PEWER, M. KRALL, T. M. MARIANO, C. S. KUMAR et al., 1990 Molecular genetic markers spanning mouse chromosome 10. Genomics 8: 519-524.
LANDER, E. S., and D. BOTSTEIN, 1989 Mapping mendelian factors underlying quantitative traits using RFLP linkage maps. Genetics
121: 185-199.
LANDER, E. S., and N. J. SCHORK, 1994 Genetic dissection of complex traits. Science 265 2037-2048.
L A N D E R , E. S., P. GREEN, J. A B R A H A M S O N , A. BARLOW, M. J. DAI.Y
et al., 1987 MAPMAKER an interactive computer package for constructing primary genetic linkage maps of experimental and natural populations. Genomics 1: 174-181.
LI, W., J.-P. VERGNES, P. K. CORNUET and J. R. HMSELL, 1992 cDNA clone to chick corneal chondroitin/dermatan sulfate proteogly- can reveals identity to decorin. Arch. Biochem. Biophys. 296:
LINCOLN, S., M. DALY and E. LANDER, 1992a Constructing genetic maps with MAPMAKER/EXP 3.0. Whitehead Institute Technical Report, 3rd ed.
LINCOLN, S., M. DAI.Yand E. LANDER, 1992b Mapping genes control- ling quantitative traits with MAPMAKER/QTL 1.1. Whitehead Institute Technical Report, 2nd ed.
LISITSW, N. A,, J. A. SEGRE, K. KUSUMI, N. M. LISITSW, J. H. NADEAU
rt al., 1994 Direct isolation of polymorphic markers linked to a trait by genetically directed representational difference analysis. Nature Genet. 6 57-63.
LONG, A. D., S. L. MULLANEY, L. A. REID, J. D. FRY, C. H. LANGLEY et
al., 1995 High resolution mapping of genetic factors affecting
abdominal bristle number in Drosophila melanogaster. Genetics
MACARTHUR, J. W., 1944 Genetics of body size and related charac- teristics. I. Selecting small and large races of the laboratory mouse. Am. Nat. 78: 142-157.
MEDRANO, J. F., D. POMP, L. SHARROW, G . E. BRADFORD, T. R. DOWNS 190-197.
1748 S. Horvat and J. F. Medrano
et nl., 1991 Growth hormone and insulin-like growth factor-I measurements in high growth mice. Genet. Res. 58: 67-74. MEIIRANO, J. F., D. POMP, B. A. TAYLOR and G. E. BRADFORD, 1992
The high gruwth gene ( h g ) in mice is located on chromosome
10 linked to Z g f l . Advances in gene technology: Feeding the world in the 21st century, edited by W . J. WHEIAN et al. The
1992 Miami Bio/Technology Winter Symposium 1: 12.
MICHEI.MOKE, R. W., and D. V. SHAW, 1988 Quantitative genetics: character dissection. Nature 335: 672-673.
MICHELMORE, R. W., I. PARAN and R. V. KESSELI, 1991 Identification
of markers linked to disease-resistance genes by bulked segregant analysis: a rapid method to detect markers in specific genomic regions by using segregating populations. Proc. Natl. Acad. Sci. USA 88: 9828-9832.
O ' B R I ~ N , S. J., J. E. WOMACK, L . A. LYONS, K. J . MOORE, N. A. JENKINS
rt al., 1993 Anchored reference loci for comparative genome mapping in mammals. Nature Genet. 3: 103-1 12.
PATBRSON, A. H., E. S. LANDER, J. D. HEU'ITT, S. PETERSON, S. E. LINCOLN et nl., 1988 Resolution of quantitative traits into Men- delian factors by using a complete linkage map of restriction fragment length polymorphisms. Nature 335: 721 -726. PA'IEKSON, A. H., J. W. D!i\'ERNA, B. LWINI and S. D. TANKSI.EY, 1990
Fine mapping of quantitative trait loci using selected overlapping recombinant chromosomes in an interspecies cross of tomato. Genetics 124: 735-742.
PAI'EKsON, A. H., S. DAMON,J. D. HEUTTT, D. ZAMIR, H. D. RABINO-
W ~ : H rt nl., 1991 Mendelian factors underlying quantitative traits in tomato: comparison across species generations and envi- ronments. Genetics 127: 181-197.
RANCE, K. A,, I. M. HASTINCS, W. G. HIIL and P. D. KEIGHILEY, 1994
Mapping of putative QTL influencing body weight on the X
chromosome in mice. Proceedings of the 5th World Congress on Genetics Applied to Livestock Production, Univ. Guelph, Guelph, Ontario, Canada 21: 268-271.
ROWE, L. B., J. H. NADEAU, R. TURNER, W. N. FRANKKI,, V. A. L w r s
d nl., 1994 Maps from two interspecific backcross DNA panels available as a community genetic mapping resource. Mamm. Ge- nome 5: 253-274.
RUOSIAHTI, E., and Y. YAMAGLKHI, 1991 Proteoglycans as modula- tors of growth factor activities. Cell 64: 867-869.
SA5 User's Guide: Basics Version 5 , 1985. SAS Institute Inc., Cary, NC. SCHMITT, I C , L. C. LMZERONI, S. FOOTE, D. VOI.I.RATH, E. M. FISHER
rt al., 1994 Multipoint linkage map of the human pscudoautoso- mal region based on single-sperm typing: do double crossovers occur during male meiosis? Am. J. Hum. Genet. 5 5 423-430.
SIIRIMPTON, A. E., and A. RonFRTsoN, 1988 The isolation of poly- genic factors controlling bristle score in Drusuphiln mrlanuguskr.
11. Distribution of third chromosome bristle effects within chrtr mosome sections. Genetics 118: 445-459.
SIRKUSA, L. D . , W. G. AI.VORI), W. A. BICKMORE, N. A. JENKINS and N. G. <:OI'E:IANl), 1991 Interspecific backcross mice show sex- specific differences in allelic inheritance. Genetics 1 2 8 813-8'21,
Srunm, C . W., S. E. L,I?X:OLN, D. W. WOI.FF, T. HEI.ENI:JARIS and E. S .
LAKDER, 1992 Identification of genetic factors contributing to heterosis in a hybrid from two elite maize inbred lines using molecular markers. Genetics 132: 823-839.
SLIMMERS, P. ,J., and .J. F. MEDRANO, 1994 Morphometric analysis o f
skeletal muscle growth i n the high growth mouse. Growth Dev. Aging 58: 135-148.
VEEKKAMI', R. F., C. S. HAIXY, S. A. KNO'IT and I. M. HASTINGS, 1993
The genetic basis ofresponse in mouse lines divergently selected [orbody weight or fat content. 11. The contribution of gcncs with a large effect. Genet. Res. 62: 177-182.
VETTER, U., W. VO(:EI., W . . J r r s ~ , M. F. YOLTN(; and I.. W. FISHER, 1993
Human decorin gene: intronuxon junctions and chromosomal localization. Genomics 15: 161-168.
ZEN(;, Z.-B., 1994 Precision mapping ofquantitative trait loci. Genet- ics 136: 1457-1468.