SPECTRUM Enterprise Manager
Device Management
Ericsson MD110 PBX
Summary of Changes
Version Date Reason/Rational Nature of Changes
MMS-2 08-20-99 Standardization to new
Notice
Cabletron Systems reserves the right to make changes in specifications and other information contained in this document without prior notice. The reader should in all cases consult Cabletron Systems to determine whether any such changes have been made.
The hardware, firmware, or software described in this manual is subject to change without notice.
IN NO EVENT SHALL CABLETRON SYSTEMS BE LIABLE FOR ANY INCIDENTAL, INDIRECT, SPECIAL, OR CONSEQUENTIAL DAMAGES WHATSOEVER (INCLUDING BUT NOT LIMITED TO LOST PROFITS) ARISING OUT OF OR RELATED TO THIS MANUAL OR THE INFORMATION CONTAINED IN IT, EVEN IF CABLETRON SYSTEMS HAS BEEN ADVISED OF, KNOWN, OR SHOULD HAVE KNOWN, THE POSSIBILITY OF SUCH DAMAGES.
Copyright © September, 1999, by Cabletron Systems, Inc. All rights reserved. Printed in the United States of America.
Order Number: 9032382-01 Cabletron Systems, Inc. P.O. Box 5005
Rochester, NH 03866-5005
SPECTRUM, the SPECTRUMIMT/VNM logo, DCM, IMT, and VNM are registered trademarks, and SpectroGRAPH, SpectroSERVER, Inductive Modeling Technology, Device Communications Manager, and Virtual Network Machine are trademarks of Cabletron Systems, Inc.
Ethernet is a trademark of Xerox Corporation.
Virus Disclaimer
Cabletron Systems makes no representations or warranties to the effect that the Licensed Software is virus-free.
Cabletron has tested its software with current virus checking technologies. However, because no anti-virus system is 100% reliable, we strongly caution you to write protect and then verify that the Licensed Software, prior to installing it, is virus-free with an anti-virus system in which you have confidence.
Restricted Rights Notice
(Applicable to licenses to the United States Government only.)
1. Use, duplication, or disclosure by the Government is subject to restrictions as set forth in subparagraph (c) (1) (ii) of the Rights in Technical Data and Computer Software clause at DFARS 252.227-7013.
Cabletron Systems, Inc., 35 Industrial Way, Rochester, New Hampshire 03866. 2. (a) This computer software is submitted with restricted rights. It may not be
used, reproduced, or disclosed by the Government except as provided in paragraph (b) of this Notice or as otherwise expressly stated in the contract.
(b) This computer software may be:
(1) Used or copied for use in or with the computer or computers for which it was acquired, including use at any Government installation to which such computer or computers may be transferred;
(2) Used or copied for use in a backup computer if any computer for which it was acquired is inoperative;
(3) Reproduced for safekeeping (archives) or backup purposes;
(4) Modified, adapted, or combined with other computer software, provided that the modified, combined, or adapted portions of the derivative software incorporating restricted computer software are made subject to the same restricted rights;
(5) Disclosed to and reproduced for use by support service contractors in accordance with subparagraphs (b) (1) through (4) of this clause, provided the Government makes such disclosure or reproduction subject to these restricted rights; and
(6) Used or copied for use in or transferred to a replacement computer.
(c) Notwithstanding the foregoing, if this computer software is published copyrighted computer software, it is licensed to the Government, without disclosure prohibitions, with the minimum rights set forth in paragraph (b) of this clause.
Contents
INTRODUCTION 6
Purpose and Scope ...6
Required Reading ...6
Supported Device ...7
The SPECTRUM Model ...7
TASKS 9 Monitoring Interfaces ...9
Enabling or Disabling Interfaces...9
Configuring Device Connections ...9
Setting Interface Thresholds ...9
Viewing Interface Address Information...9
Monitoring MD110 Alarms ...9
Resolving Port Connections ...9
Model Communications Information ...9
Configuring Model Redundancy ...9
Monitoring ISDN Basic Rate Extensions ...9
Radio Exchange Information ...9
Configuring Computer Telephony Interfaces...9
PERFORMANCE VIEWS 10 Device Performance View...10
Port Performance View ...11
Device View ...12
Module Icons ...13
Chassis Module Labels...13
Chassis Module Icon Subviews Menu...13
Line Interface Module Labels ...14
Port Label Icon Subviews Menu...14
DEVICE TOPOLOGY VIEW 15 Interface Icons ...16
Interface Icon Subviews Menu Options...17
Interface Status View ...18
Secondary Address Panel ...18
Interface Address Translation Table View...18
Interface Thresholds View ...19
APPLICATION VIEW 20 Application Icons...21
Supported Applications ...21
MD110_App ...22
CONFIGURATION VIEWS 23 MD110 Configuration View ...23
Interfaces Information View ...25
Contents Contents
Interfaces Information Detail Views ...27
ICU Interfaces Table View...27
OPI Information Table View ...28
Call Information Logging Table View...28
Computer Telephony Interfaces Table View ...28
ISDN Basic Rate Extensions Table View ...29
VCU Interfaces Table View ...29
Server (E1/T1 ELU-7) Table View ...29
Data Extensions Table View ...30
DNA Interconnections View...30
Radio Exchange Table View ...30
Alarm Information View ...31
Active Alarms Table ...31
External Alarms Table...31
PIN Alarm Information View...32
PIN Alarm Configuration Table...32
PIN Alarms ...32
DNA Trap Destination Table View ...33
Route and Trunk Information View ...33
Trunk Endpoints...33
Route Endpoints ...33
Route - Trunk Table ...34
LIM Table View...34
Group Switch Information View ...34
Group Switch Table ...34
Group Switch Link ...35
Agent Information View ...35
Device Configuration View ...36
Interface Configuration View ...37
MODEL INFORMATION VIEWS 38
Introduction
This section introduces the SPECTRUM Device Management documentation for the Ericsson MD110 PBX device.
This introduction contains the following information:
• Purpose and Scope • Required Reading
• Supported Device on Page 7 • The SPECTRUM Model on Page 7
Purpose and Scope
Use this documentation as a guide for managing the Ericsson MD110 PBX (herein referred to as the MD110) with the SPECTRUM management module SM-ERC1000. This documentation
describes the icons, menus, and views that enable you to remotely monitor, configure, and
troubleshoot devices through software models in your SPECTRUM database.
Only information specific to the supported management module is included in this documentation. For more information about device management using SPECTRUM and for explanations of basic SPECTRUM functionality and navigation techniques, refer to the
documentation listed under Required Reading.
Required Reading
To use this documentation effectively, you must be familiar with the information covered by these other SPECTRUM online documentation topics:
• Getting Started with SPECTRUM for Operators • Getting Started with SPECTRUM for Administrators • How To Manage Your Network with SPECTRUM • SPECTRUM Views
I n t r o d u c t i o n S u p p o r t e d D e v i c e
Supported Device
The SPECTRUM management module
SM-ERC1000 allows you to model the MD110, described below.
The MD110 is a high-capacity digital voice-data PBX, carrying data transparently through a common networked system.The MD110:
• network can consist of on-premise hard-wired, wireless nodes, or wide area networked links
• can provide cordless communication for all users in an office environment, independent of the size of the organization
• operates in a coherent “single system” mode and offers customizable capabilities
• allows full computer telephony
internetworking with computer-supported telephony systems
• contains LIMs (Line Interface Modules) that can be distributed throughout one or many sites, and is managed from a terminal using the MD110 proprietary interface
The SPECTRUM Model
SPECTRUM uses a single device model type, MD110_PBX, to auto-discover and model each MD110 in the network.
The managed MD110 requires you to install Ericsson’s agent, which provides the SNMP interface for SPECTRUM. The SNMP agent exists as a stand-alone unit for a single MD110 or as a chassis package including up to eight agents.
Models are represented in SpectroGRAPH views by Device icons. As shown in Figure 1, the appearance of the Device icon varies slightly depending on the kind of view in which it appears.
Figure 1: Device Icons
Large Device icon Model Name
Model Name Small Device icon appears in
Topology, Alarms, Events,
appears in Device Topology, Org Owns, Location, and Interface Device views.
Application, and Container views.
MD110_PBX
I n t r o d u c t i o n T h e S P E C T R U M M o d e l
Device icons provide access to the views, subviews, and tables that let you manage the modeled device. Figure 2 shows the
model-specific portion of the Icon Subviews menu for a MD110_PBX Device icon in a Topology view. The views listed below are accessible directly from this menu and are described individually in
subsequent sections of this documentation.
• Performance Views on Page 10 • Device Views on Page 12
• Device Topology View on Page 15 • Application View on Page 20 • Configuration Views on Page 23 • Model Information Views on Page 38
Figure 2: Device Icons and Menu
Device DevTop Application
MD110 Configuration Acknowledge
Flash Green Enabled Configuration
Model Information
123.45.67.89 Notes
Zoom -> Performance
Utilities ->
Primary Application ->
Tasks
This section provides links to pages describing views and fields that allow you to complete certain tasks.
Monitoring Interfaces
• Device Views on Page 12
• Performance Views on Page 10
• Interface Icon Subviews Menu Options on Page 17
Enabling or Disabling Interfaces
• Admin Status on Page 37
Configuring Device Connections
• Device Topology View on Page 15
Setting Interface Thresholds
• Interface Thresholds View on Page 19
Viewing Interface Address Information
• Interface Address Translation Table View on Page 18
Monitoring MD110 Alarms
• Alarm Information View on Page 31
• PIN Alarm Information View on Page 32
Resolving Port Connections
• Device Topology View on Page 15
Model Communications Information
• Model Information Views on Page 38
Configuring Model Redundancy
• Device Configuration View on Page 36
Monitoring ISDN Basic Rate Extensions
• ISDN Basic Rate Extensions Table View on Page 29
Radio Exchange Information
• Radio Exchange Table View on Page 30
Configuring Computer Telephony Interfaces
Performance Views
This section provides brief descriptions of the Performance views available for models of MD110 devices in SPECTRUM.
Performance views provide statistical information about the operation of the device and packet information for the device and its ports. The following performance views are described in this section:
• Device Performance View on Page 10 • Port Performance View on Page 11
For general information on these views, refer to the SPECTRUM Views documentation.
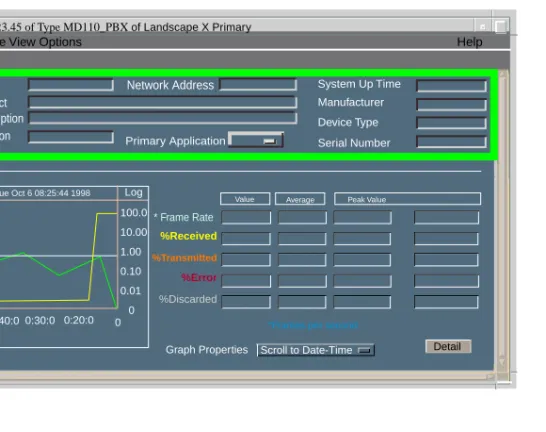
Device Performance View
Access: From the Icon Subviews menu for the Device icon, select Performance.
This view (Figure 3) includes both a graph and a table that show current, average, and peak values for the following performance statistics:
• Frame Rate • % Received
• % Transmitted • % Error
• % Discarded
Figure 3: MD110 Performance View
Log 100.0 10.00 1.00 0.10 0.01 0 0 0:40:0 0:30:0 0:20:0
Value Average Peak Value
%Received
%Transmitted
Detail Graph Properties Scroll to Date-Time
123.45 of Type MD110_PBX of Landscape X Primary
Primary Application
System Up Time Manufacturer Device Type
Serial Number
Network Address
* Frame Rate Name
Contact Description Location
%Error
%Discarded
*Frames per second Tue Oct 6 08:25:44 1998
P e r f o r m a n c e V i e w s P o r t P e r f o r m a n c e V i e w
Port Performance View
Access: From the Icon Subviews menu for the DevTop view’s Interface Icon, select Performance.
This view includes both a graph and a table that show current, average, and peak values for the following performance statistics:
• Load
D e v i c e V i e w s
Device Views
This section describes the Device view and subviews available for models of the MD110 device in SPECTRUM.
This view contains icons that represent the modeled MD110 as a set of LIMs (Line Interface Modules) which together constitute a manageable MD110. The icons and corresponding double-click areas are described below.
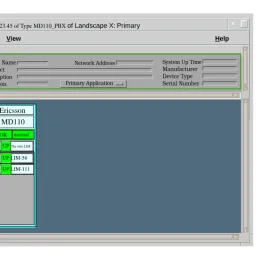
Device View
Access: From the Icon Subviews menu for either Device icon, select Device.
Each MD110 chassis modeled in SPECTRUM shows the Device view in which it is represented as a single chassis module icon (see Figure 4). The icon displays the agent and alarm status of the MD110.
Individual LIMs within each chassis module are represented by smaller icons located on the module icon that dynamically display current LIM information.
Figure 4: MD110 Device View
123.45 of Type MD110_PBX of Landscape X: Primary
* File View Help
Model Name Contact Description Location
System Up Time Manufacturer Device Type Serial Number Network Address
Primary Application
MD110
FWD FWD
D1 STDBY
D2 FWD
Repeaters A UNLOCKED
Ericsson
The only LIM UP 1
UP LIM-56 UP LIM-111 56 111
D e v i c e V i e w s D e v i c e V i e w
Module Icons
Figure 5 shows a close-up of the Module icon from the MD110 Device view. Note that there are two types of labels on the icon: those that apply to the chassis module as a whole, and those that apply to individual LIMs within the module.
Figure 5: Module Icons
Chassis Module Labels
The following labels are located at the top of each Module icon:
• Manufacturer - The module manufacturer’s name, or other user-provided identification information. This double-click zone accesses the Route and Trunk Information View on Page 33.
• Module Type - The type of module inserted in this chassis slot—e.g., MD110. This double-click zone accesses the Interfaces Information View on Page 25.
• Agent Status - Indicates OK, linkdown, updatingMIB, or agentFault. Information will only be valid when the Agent Status is OK.
• Alarm Status - Indicates the severity of the highest active alarm detected by the agent. The states are normal, warning, minor, major, or critical.
Chassis Module Icon Subviews Menu
Table 1 lists the Icon Subviews menu options for a chassis module.
Chassis
Agent Status Module Type
Port Number
LIM
Port State/LIM Detail
LIM Descriptor Manufacturer
Labels
MD110 Alarm Status Module
Labels MD110
FWD
FWD
D1 STDBY
D2 FWD
Repeaters A UNLOCKED Ericsson
The only LIM
UP 1
UP LIM-56
UP LIM-111 56
111
D e v i c e V i e w s D e v i c e V i e w
Line Interface Module Labels
As shown in Figure 5, each selectable LIM label on a port icon comprises three smaller labels. Clicking any of these labels lets you access the port-specific menu options listed in Table 2.
• Port Number - Identifies a particular LIM.The ports shown correspond to entries in the LIM table. Double-click this label to open a Port Notes view that allows you make, revise, save, retrieve, and mail annotations about the LIM.
• Port Status - Displays the current operating status of the LIM and the corresponding color for that status (green if the port is up, red if the port is down or in test mode). Double-click this label to open the LIM Detail view.
• Port Statistics - Displays the LIM (Line Interface Module) location. This is a writable attribute within the agent and the default value can be updated by the user.
Port Label Icon Subviews Menu
Table 2 lists the Icon Subviews menu options for port labels within the Device view.
Table 1: LIM Label Icon Subviews Menu
Selection Description
Notes Allows you to record notes for the MD110_App.
Route/Trunk Information
See Route and Trunk Information View on Page 33.
Interfaces Information
See Interfaces Information View on Page 25.
Configuration See MD110 Configuration View on Page 23.
LIM
Information
See LIM Table View on Page 34 for text values on each LIM (Line Interface
Module). Table 2: Port Label Icon Subviews Menu
Menu Option Description
Notes Allows you to revise, retrieve, create, save, and/or mail notes for the MD110_App.
Port Notes Opens the Notes view, which allows you to record notes for the GnPort. LIM Detail Opens the LIM Detail view, which
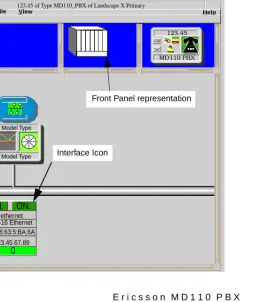
Device Topology View
This section provides a brief description of the Device Topology view available for models of the MD110 device in SPECTRUM.
Access: From the Icon Subviews menu for the Device icon, select DevTop.
The Device Topology view shows the connections between a modeled device and other network entities.
Figure 6 shows an example of the Device Topology view. The lower panel of the view uses interface icons to represent the device’s serial/network I/O ports. If there is a device connected to a particular interface, a device icon appears on the vertical bar above the interface icon along with an icon
representing the network group that contains the device.
Figure 6: Device Topology View
ethernet
1
0
123.45.67.89
ON
(IP address) of Type FN10 and FN100 switches6000 of LandscapeX Primary Help
0:8:63:5:BA:6A SX-16 Ethernet
123.45 of Type MD110_PBX of Landscape X Primary
* File View
123.45
Front Panel representation
Interface Icon Model Type
Model Type
D e v i c e T o p o l o g y V i e w
Interface Icons
Figure 7 shows a close-up of an Interface icon from an Interface Device view. Most of the informational labels on the icon also provide double-click access to other views, as explained in the following label descriptions.
Figure 7: Interface Icon
Interface Number Label
This label displays the interface number.
IF Status Label
This label displays the current Operational Status of the interface (see Table 3). Note that the
background color of the label also depends on the interface’s current Administrative Status,
described under Interface Status View on Page 18 (accessed by double-clicking the label).
Interface Type Label
This label identifies the type of interface—e.g., Ethernet or FDDI. Double-click this label to access Interface Configuration view. For a
description, see Interface Configuration View on Page 37.
ethernet
SX-16Ethernet0
1
ON
0:0:30:68:6F:1B
0:0:0:0
a Interface Number Label
b IF Status Label
c Interface Type Label
d Physical Address Label
e IP Address Label
f Gauge Label
g Network Type Label
(a) (b)
(c)
(d) (e) (f) (g)
Table 3: Interface Status Label Colors
Color Operational
Status
Administrative Status
Label Text
Green ON ON ON
Blue OFF OFF OFF
Yellow OFF ON OFF
D e v i c e T o p o l o g y V i e w
Physical Address Label
This label displays the physical (MAC) address of the interface. Double-click the label to open the Address Translation Table (see Interface Address Translation Table View on Page 18). This allows you to view the physical and IP address for the interface. Double-clicking any column entry opens Address Translation Table Information view, which allows you to write to the Interface Index and address fields.
IP Address Label
This label displays the IP address for the interface. Double click this label to access the Secondary Address Panel (described under Secondary Address Panel on Page 18).
Gauge Label
This label displays whichever performance statistic has been selected in the Gauge Control panel for the interfaces (see the SPECTRUM Views documentation for more information). Double-click this label to open the Port Performance view, described under Port Performance View on Page 11.
Network Type Label
This label identifies the type of network the
interface is connected to. Double-click the label to open the Model Information view for the interface.
Interface Icon Subviews Menu Options
Table 4 lists the Icon Subviews menu options available for the Interface icon.Table 4: Interface Icon Subviews Menu Options
Menu Option Opens the...
Performance Port Performance View on Page 11
Detail Interface Detail view, which displays Packet, Error, and Discard
Breakdown pie charts.
IF Status Interface Status View on Page 18
IF Configuration Interface Configuration View on Page 37
Model Information Model Information Views on Page 38
IF Address Translation Table
Interface Address Translation Table View on Page 18
Secondary Address Panel
Secondary Address Panel on Page 18
D e v i c e T o p o l o g y V i e w
Interface Status View
Access: From the Icon Subviews menu for the Interface icon in the Interface Device view, select IF Status.
This view provides information on the operational status of the interface and allows you to enable or disable the port.
Operational Status
The current state of the interface (ON, OFF, or Testing).
Administrative Status
This button allows you to select the desired operational state of the interface (ON, OFF, or Testing).
Secondary Address Panel
Access: From the Icon Subviews menu for the Interface icon in the Interface Device view, select Secondary Address Panel.
This panel provides a table that cross-references network addresses (IP addresses) to physical (MAC) addresses for selected nodes between networks. The addresses are obtained from the Address Translation table within the firmware. Change the current address displayed in the IP Address field by selecting an entry from the table and clicking Update.
Interface Address Translation
Table View
Access: From the Icon Subviews menu for the Interface icon in the Interface Device view, select IF Address Translation Translation Table.
This view displays interface address information for ports connected to the MD110.
Interface Index
A unique value for each interface. Its value ranges between 1 and the highest index value. The value 0 for each interface must remain constant at least from one reinitialization of the entity’s network management system to the next reinitialization.
Physical Address
The interface’s address at the protocol layer immediately below IP in the protocol stack. The Ethernet address of the bridge is returned, for both channels of the bridge.
Network Address
D e v i c e T o p o l o g y V i e w
Interface Thresholds View
Access: From the Icon Subviews menu for the Interface icon in the Interface Device view, selectThresholds.
This view displays the thresholds that can be set for a particular interface. The thresholds are used to generate alarms that will notify you when a condition exists that you have determined to be undesirable. Example: excessive traffic on this interface.
Load Threshold
Allows you to set the values to determine the point at which the percent load will generate an alarm (on) and the point at which it will shut the alarm off (off).
Packet Rate Threshold
Allows you to set the values to determine the point at which the packet rate will generate an alarm (on) and the point at which it will shut the alarm off (off).
Error Rate Threshold
Allows you to set the values to determine the point at which the error rate will generate an alarm (on) and the point at which it will shut the alarm off (off).
% Discarded Threshold
Application View
This section describes the Application view and the associated application-specific subviews available for the MD110 in SPECTRUM.
Access: From the Icon Subviews menu for the Device icon, select Application.
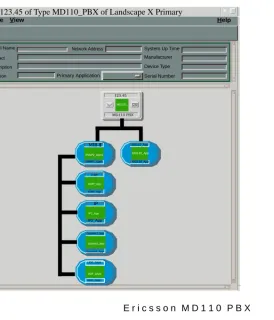
When a device model is created, SPECTRUM automatically creates models for each of the major and minor applications supported by the device. The Application view identifies all of these application models, shows their current condition status, and provides access to application-specific subviews.
Figure 8 shows an Application view in its default mode (Icon) where each of the application models is represented by an Application icon (see
Figure 9 for a close-up). The Application icons are arranged hierarchically under a Device icon, with major applications in the top row and their
respective minor applications stacked directly below.
If you prefer to see applications displayed by name only, in a single vertical list, select View > Mode > List.
Figure 8: MD110 Application View
Model Name
Contact
Description
Location Primary Application
System Up Time
Manufacturer
Device Type
Serial Number
Network Address
* File View Help
123.45 of Type MD110_PBX of Landscape X Primary
MIB-III MD110_App
MD110_App
MD110_App MD110_
ICMP SNMP2_Agent
IP2_App
System2_App
System2_App
System2_App
UDP_2App SNMP2_Agent
ICMP_App
ICMP_App
123.45
MD110 PBX
IP
UDP_2App
A p p l i c a t i o n V i e w A p p l i c a t i o n I c o n s
Application Icons
When the Application view is in Icon mode, each of the application models is represented by an Application icon (Figure 9). Double-clicking the Model Name label (a) at the top of the icon opens the associated Model Information view (see Model Information Views on Page 38). For some
applications, the Model Type label (c) at the bottom of the icon is also a double-click zone, which opens an application-specific view. For other applications, this label is blank. Any views accessible through these double-click zones are also accessible from the Application icon’s Icon Subviews menu.
Figure 9: Application Icon
Supported Applications
The MD110 supports the md110_App and the common applications shown in Table 5.
a Model Name Label / Model Information View
b Condition Status Label
c Model Type Label / Application-Specific View (a)
(b)
(c)
123.45.67.890
md110_App
A p p l i c a t i o n V i e w S u p p o r t e d A p p l i c a t i o n s
Table 5: Common Applications
MD110_App
The MD110 provides one application-specific view: the MD110 Configuration view. To access this view, select MD110 Configuration from the Icon Subviews menu, or highlight the Device icon and select MD110 Configuration from the Icon Subviews menu. The md110_App is also used for creating additional models to represent the device chassis and its LIMs.
Application Reference
Bridging (Bridge_App) Bridging Applications
MIB-II (SNMP2_Agent) MIB-II Applications
Point to Point Protocol (PPP_LCPApp)
Miscellaneous Applications
DLM (DLM_Agent) DLM for SPECTRUM
CtDownLoad (CtDownLoadApp)
SPMA Tools Guide - TFTP Download Tool
Standard RMON (RMONApp)
Configuration Views
This section describes the various Configuration views and subviews available for models of MD110 devices in SPECTRUM.
Configuration views allow you to view and modify current settings for the modeled device and its interfaces, ports, and applications. The following Configuration views are available for models of MD110 devices:
• MD110 Configuration View on Page 23 • Interfaces Information View on Page 25 • Alarm Information View on Page 31 • Route and Trunk Information View on
Page 33
• LIM Table View on Page 34
• Group Switch Information View on Page 34 • Agent Information View on Page 35
• Device Configuration View on Page 37
An example of the MD110 Configuration view is shown in Figure 10.
Figure 10: MD110 Configuration View
MD110 Configuration View
Access: From the Icon Subviews menu for the Device icon, Model Name
Contact Description
Location Primary Application
System Up Time Manufacturer Device Type Serial Number Network Address
LIM Information
Group Switch Information
Agent Information MD110 Release Ericsson MD110 Release
Agent State OK
Alarm Status Normal
Interfaces Information
Alarm Information
Route + Trunk Information
123 of Type MD110_PBX of Landscape X Primary
MD110 Configuration View
C o n f i g u r a t i o n V i e w s M D 1 1 0 C o n f i g u r a t i o n V i e w
The MD110 Configuration view and its fields are described below.
MD110 Release
The manager-defined release number (2, 3, or 4). This field is not automatically updated by the MD110 Agent.
Agent State
The state of the connection between the MD110 and the agent. The default value is OK. The values are described in Table 6.
Alarm Status
The current alarm status of the MD 110 node. The alarm states and definitions are listed in Table 7.
Refer to the Interfaces Information View on Page 25, which provides Interface Names and Common Interface Tables.
Table 6: Agent Connection States
Connectio
n State Definition
OK The agent established a connection to the attached MD110 and all MIB objects are instrumented.
linkdown The connection between the agent and MD110 is down.
updating MIB
The communication between the agent and MD110 is
working and the agent is updating the information base. The agent can not yet provide its services to any manager.
agentFault The agent is out of operation due to internal fault.
Table 7: MD110 Alarm States
Alarm State Definitions
Critical Any Active A4 alarms.
Major Any active A3 alarms but no active higher alarms or Agent is not operational.
AgentState is not 1.
Minor Any active A2 alarms but no active higher alarms.
Warning Any active A1 alarms but no active higher alarms.
Indeterminate Status unknown.
Normal Any active A0 or no active alarm but no active higher alarms.
C o n f i g u r a t i o n V i e w s M D 1 1 0 C o n f i g u r a t i o n V i e w
Refer to the Alarm Information View on Page 31.
Refer to the Route and Trunk Information View on Page 33.
Refer to the LIM Table View on Page 34.
Refer to the Group Switch Information View on Page 34.
Refer to the Agent Information View on Page 35.
Interfaces Information View
Access: From the MD110 Configuration view, click the Interfaces Information button.
This view provides information for common
Common Interface Table
This table provides descriptive and status information on the interfaces.
Index
A unique value for each interface. Its value ranges between 10 and the maximum interface value.
Interface Name
The type of interface.
Description
A textual string containing information about the interface.
Status
The operational state of the interface. The possible states are described in Table 8.
Alarm Information
Route + Trunk Information
LIM Information
Group Switch Information
Agent Information
Table 8: Common Interface States
States Description
Up The interface is in the Up state. Down The interface is in the Down state. Unknown The agent cannot obtain the status of
C o n f i g u r a t i o n V i e w s M D 1 1 0 C o n f i g u r a t i o n V i e w
Alarm Class
Displays active external alarm error codes. Alarm classes range from critical (A4) to normal (A0).
Interface Information Buttons
The Interfaces Information view buttons access interface information table views.
Refer to the ICU Interfaces Table View on Page 27.
Refer to the OPI Information Table View on Page 28.
Refer to the Call Information Logging Table View on Page 28.
Refer to the Computer Telephony Interfaces Table View on Page 28.
Refer to the ISDN Basic Rate Extensions Table View on Page 29.
Refer to the VCU Interfaces Table View on Page 29.
Refer to the Server (E1/T1 ELU-7) Table View on Page 29.
Refer to the Data Extensions Table View on Page 30.
ICU Information
OPI Information
CIL Information
CTI Information
ISDN SO Information
VCU Information
Server Information
C o n f i g u r a t i o n V i e w s M D 1 1 0 C o n f i g u r a t i o n V i e w
Refer to the DNA Interconnections View on Page 30.
Refer to the Radio Exchange Table View on Page 30.
Interfaces Information Detail Views
The detail views provide varying subsets of information for each interface table, and allow you to change default values.
IF Index
A unique value for each interface. Its value ranges between 1 and the highest interface value.
Name
The name of this interface.
Description
A textual description of this interface.
Status
The current operational status of this interface.
Port ID
The port identity for this interface type.
EquPos
The equipment position for the port interface, within the chassis or device.
Application
The application using this port. The ICP and Server E1/T1 ELU7 interface information views display this field.
ICU Interfaces Table View
Access: From the Interfaces Information view, click ICU Information.
This view shows Intercept Computer interfaces, which identify applications using ICU ports (voicemail, directory, ccm, or ancd. Double-click any entry in the ICU Interface Table view to access the ICU Interface Detail view and change default values).
IF Index
A unique value for each network port.
Port ID
Port identity for this interface type.
Equip Position
The equipment position for this port.
Application
The application using the ICU port.
C o n f i g u r a t i o n V i e w s M D 1 1 0 C o n f i g u r a t i o n V i e w
OPI Information Table View
Access: From the Interfaces Information view, click OPI Information
This view shows data for each switch board attendant extension. Double-click any entry in the OPI Interface Table view to access the OPI Interface Detail view and change default values.
IF Index
A unique value for each OPI port.
Port ID
Port identity for this interface type.
Equip Position
The equipment position for this port.
OPI Type
The type of OPI port.
Call Information Logging Table View
From the Interfaces Information view click CIL Information.
This view shows data for all call information logging interfaces. Double-click any entry in this table to access the Call Information Logging Interface Detail view and change default values.
IF Index
A unique value for each network interface. Each value is indexed to the Call Information Logging
Port ID
The port identity, for this interface type CIL id (SI-x).
Equip Position
The equipment position for this port.
Computer Telephony Interfaces Table View
Access: From the Interfaces Information view, click CTI Information.This view provides data for each computer telephony interface of an MD110 that are recognized via MML commands. The Computer Telephony Interfaces functionality is only supported for MD110 BC 8 firmware and later. Double-click any entry in the view to access the Computer Telephony Interface Detail view and change default values.
IF Index
A unique value for each network interface appears in each column of the Computer Telephony Interface table.
Port ID
The port identity for this interface type.
Equip Position
C o n f i g u r a t i o n V i e w s M D 1 1 0 C o n f i g u r a t i o n V i e w
ISDN Basic Rate Extensions Table View
Access: From the Interfaces Information view, click ISDN SO Information.The ISDN Basic Rate Extensions Table displays Integral Services Digital Network basic rate
extension information for MD110. SO refers to an adapter which enables a single digital extension for all digital telephone functions, and provides basic rate access for data applications. This functionality is only supported for MD110 BC 8 firmware and later. Double-click any entry in the view’s table to access the ISDN Basic Rate
Extensions Detail view and change default values.
IF Index
A unique value for each network interface of an ISDN S0 port.
Port ID
The port identity for this interface type directory number for the ISDN S0 port.
Equip Position
The equipment position for this port.
VCU Interfaces Table View
Access: From the Interfaces Information view, click VCU Information.
This view shows data for each Voice Compression
Interface Table view to access the VCU Interface Detail view and change default values.
IF Index
A unique value for each network interface of a VCU board.
Type
The VCU board interface type.
Equip Position
The equipment position for this board.
Config
The configuration of this board.
Mode
The compression mode used for this VCU board.
Server (E1/T1 ELU-7) Table View
Access: From the Interfaces Information view, click Server Information.
This view shows data for the Server interfaces connected via E1/T1 ELU-7 interface. Double-click any entry in this view’s Server Table to access the Server Detail view and change default values.
IF Index
C o n f i g u r a t i o n V i e w s M D 1 1 0 C o n f i g u r a t i o n V i e w
Port ID
The port identity for this interface type directory number for a Server Interface.
Equip Position
The equipment position for this port.
Application
The application using the Server port.
Data Extensions Table View
Access: From the Interfaces Information view, click Data Extns Information.
The Data Extensions Table view shows data extensions that are programmed to generate alarms. Double-click any entry in the Data Extensions Table to access the Data Extension Information Detail view and change default values.
IF Index
A unique value for each interface.
Port ID
Identity for this interface type.
Equip Position
The equipment position for this interface.
DNA Interconnections View
Access: From the Interfaces Information view, click Connections Information.
This view displays neighbor information from the agent DNA mib. Double-click any entry in the view’s table to access the Connections
Information Detail view and change default values.
IF Name
The name of this interface.
Neighbor Address
The IP address of the nearest neighbor.
Neighbor Name
The product name for the nearest neighbor.
Radio Exchange Table View
Access: From the Interfaces Information view, click Radio Exchange Information.
C o n f i g u r a t i o n V i e w s M D 1 1 0 C o n f i g u r a t i o n V i e w
Ex Number
The radio exchange identifier.
Equip Position
The equipment position or location of the corresponding base station.
Status
The status of each corresponding base station.
Alarm Information View
Access: From the MD110 Configuration view, click Alarm Information.
This view contains two tables with alarm statistics for this MD110 node.
Agent State
The current alarm state of the MD 110 node. Refer to Table 6 for a list of alarm states.
Alarm Status
The current alarm status of the MD 110 node. Refer to Table 7 for a list of alarm conditions.
Active Alarms Table
This table provides active alarm information for the MD110.
Error Code
Number Active
The number of active alarms for the MD110.
Alarm Class
Provides an indication of the severity of the trap notification in a network element-specific
notation.
Alarm Text
The textual description associated with the external alarm code.
External Alarms Table
This table provides information on external alarms to the MD110.
Error Code
The error code associated with the external alarm, which corresponds to the CODE parameter within the ALEXP printout.
Alarm State
Indicates if the external alarm is active or passive.
Alarm Text
C o n f i g u r a t i o n V i e w s M D 1 1 0 C o n f i g u r a t i o n V i e w
Accesses data for each pin in the agent alarm port. This information is described under PIN Alarm Information View on Page 32.
This view shows trap destination information, described under DNA Trap Destination Table View on Page 33.
PIN Alarm Information View
Access: From the Alarm Information view, click PIN Alarm Information.
This view shows a table with pin alarm
configuration data for each pin in the agent alarm port, and another table with pin alarm identifying information.
PIN Polling Interval
Indicates interval, in seconds, between readings of the PIN state at agent alarm port.
PIN Alarm Configuration Table
Access: From the Alarm Information view, click PIN Alarm Information.
Code
Shows the agent alarm port pin number.
Polarity
Interprets the pin signal as active or passive alarm or else unused.
Class A
Indication of the severity of the trap notification in a network element specific notation.
Descr-Active
Indicates alarm source and recommendation of action.
Descr-Passive
Indicates ceasing alarm.
PIN Alarms
The pin alarms are described below.
Index
Index of the pin in the alarm port.
Alarm Text
Textual description associated with the pin alarm.
PIN Alarm Information
C o n f i g u r a t i o n V i e w s M D 1 1 0 C o n f i g u r a t i o n V i e w
Alarm State
Indicates if the pin alarm is active, passive or else the pin is not configured
Alarm Class
Indicates alarm class for this pin.
DNA Trap Destination Table View
Access: From the Alarm Information view, click Trap Destinations.
IP Address
The IP address to which this trap is being sent.
Sequence
The sequential order in which this trap is being sent.
Route and Trunk Information View
Access: From the MD110 Configuration view, click Route + Trunk Information.
Trunk Endpoints
The Trunk Endpoints Table identifies trunk endpoints by block type and position.
IF Index
A unique value for each network interface of a trunk endpoint having the same value as indefinites.
T1 Block Type
The type of TL-block in MD110 controlling the trunk endpoint, corresponds to the MML (man machine language) parameter RO TYPE.
Equip Position
The equipment position for the port, which corresponds to the MML parameter EQU.
Route Endpoints
The Route Endpoints Table shows router endpoints by type and bearer capacity; the endpoint provides information for each route in the node. The view fields are described below.
Number
The identification number for the route. Corresponds to the MML parameter.
Type
This route-type corresponds to the MML parameter RO SERV-D3.
Bearer Cap
C o n f i g u r a t i o n V i e w s M D 1 1 0 C o n f i g u r a t i o n V i e w
Signalling
The type of signalling diagram for the route. Corresponds to the MML parameter RO SIG-D11.
Route - Trunk Table
The Route - Trunk table displays data link information between the route and trunk
endpoints. The table also displays the number of channels for a route endpoint on each trunk endpoint.
Route.IF
The trunk endpoint If index.
Endpoints
The number of bearer channels for a route endpoint or a trunk endpoint.
LIM Table View
Access: From the MD110 Configuration view, click LIM Information.
This view presents a table with information for each LIM appearing in the Device view, and is described below. Double-click an entry to access the LIM Detail view.
Number
If this I/O (input/output) LIM shows a value of 1, the value reflects “the only LIM present”.
Location
The physical location of the LIM.
Status
Shows the operational status of the LIM. The status values are up or down.
Group Switch Information View
Access: From the MD110 Configuration view, click Group Switch Information.
This view shows tables with statistics on each group switch and the group switch link.The Group Switch Link Table will not be instantiated if there is no group switch in the MD110. The view fields are described below.
Group Switch Operational Status
The operational state of the group switch. Values are up, down, unknown, or notPresent.
GS Active Side
The active side of a group Switch. Values,
depending upon the current active side, are side0 or side1.
Group Switch Table
C o n f i g u r a t i o n V i e w s M D 1 1 0 C o n f i g u r a t i o n V i e w
Index
The index to the Group Switch table. The values start at 1.
Status-Side0
The operational state of the group Switch, side0.
Status-Side1
The operational state of the group Switch, side1.
Group Switch Link
This table presents information on each Group Switch Link; the fields are described below.
Index
Shows the sequence number for the group switch links.
Equip Position
The equipment position in the LIM for the group switch link.
Mult Position
If multiple group switch links exist, the total number of links appear in this column.
Agent Information View
Access: From the MD110 Configuration view, click the Agent Information button.
The Agent Information view provides
identification information for this MD110 agent.
Agent Board Hardware Version
Indicates MD110 release information. This data is not automatically generated by the MD110/agent and must be set by a manager.
Serial Number
The agent board serial number programmed at manufacturing time.
Base System Version
The agent board hardware version programmed at manufacturing time.
Application Version
C o n f i g u r a t i o n V i e w s D e v i c e C o n f i g u r a t i o n V i e w
Agent State
Contains the state of the connection between the agent and MD110. Values are listed in Table 9.
Alarm Status
Lists the alarm state of this agent.
Cold Start Initiate
Shows the value 1 during Cold Start of the agent. A manager initiates a cold start of the agent by setting the value to 1, under the condition that the value was 0.
Attempts to set the value to 0 or to 1 if it already is 1 will not initiate any action by the agent. Values are Option and Start Now.
Last Change
Displays the date and time the view state of the port was changed.
IP Network Mask
Displays the IP address and network mask for this device.
Phy Address
The (MAC) address of the port.
Bandwidth
The amount of bandwidth being utilized by this port.
Packet Size
The size of the packet being passed on this port.
Device Configuration View
Access: From the Icon Subviews menu for the Device icon, select Configuration.
The Device Configuration view for the switches provides access to views that allow you to enable/disable redundancy and reconfigure model interfaces. Double-clicking a table column Table 9: Agent State Values
Connection
State Description
OK The agent has established a connection to the attached MD110 and all MIB objects are instrumented.
linkDown The connection between the agent and MD110 is down.
updatingMIB The communication between the agent and MD110 is working and the agent is
updating the information base. The agent can not yet provide its services to any manager.
C o n f i g u r a t i o n V i e w s I n t e r f a c e C o n f i g u r a t i o n V i e w
entry accesses the Interface Configuration View on Page 37.
Figure 11 shows the MD110 Device Configuration View. Refer to the SPECTRUM Views documentation for more information.
Figure 11: Device Configuration View
Interface Configuration View
Access: From the Interface Icon’s Subviews menu, click IF Configuration.
This view displays port-specific information for this device.
Operation Status
Displays the current operating state of the port. This state is set using the Admin Status button described below. Possible values are On, Off, or Test.
Admin Status
This field provides a button that allows you to change the current administrative state (turn ports on or off) of the port. Possible values are On, Off, or Test.
Model Name Contact Description
Location Primary Application
System Up Time Manufacturer Device Type Serial Number Network Address
Primary Address
Device Configuration View
Contact Status Established Number of Interfaces 24
Index Description Type Bandwidth Physical Address Operation Status Admin Status Last Change Queue Le Interface Configuration Table
Sort Find Update
Fast Ethernet ETH 1000000 0.40.27.7. 0
1 down
Preferred Addresses
123.45 of Type MD110 of Landscape X Primary
* File View Help
Redundancy and Model Reconfiguration Options Interface Address Translation
Model Information Views
This section provides a brief description of the Model Information views available for models of the MD110 device in SPECTRUM.
Access: From the Icon Subviews menu for the Device icon, select Model Information.
Model Information views provide descriptive and configuration information about SPECTRUM models of individual devices, interfaces, and applications. Figure 12 shows an example of the Model Information view accessed from the Icon Subviews menu for the model’s Device icon. Model Information views are also available for each of the Interface icons in the Interface Device and Interface Device Topology views, and for each of the Application icons in the Application view. Although these views may vary slightly depending on the particular entity being modeled, their basic layout and content are similar for most
SPECTRUM management modules. These views are described in SPECTRUM Views.
In the Model Information view for Interface icons, the Trap Configuration button accesses the Generic Interface Trap Configuration view. Refer to the explanation on buttons in this view.
Figure 12: Model Information View
MM Version Number MM Name MM Part Number
Community Name DCM TimeOut DCM Retry
Poll/Log Information
Model Created By Model Type Model Creation Time
Poll Interval Polling Status Model State Security String Mgmnt Protocol Model Name Contact Description
Location Primary Application
System Up Time Manufacturer Device Type Serial Number Network Address
123.45 of Type MD110_PBX of Landscape X Primary
Primary Address
Model Information View
* File View Help
Condition
Condition Value
Contact Status
Lost Child Count
Value When Yellow
Value When Orange
Value When Red
Last Successful Poll
Log Ratio
LOGGED POLLED
42
Index
Symbols
% Discarded Threshold 19
Numerics
1000Base-SX and 1000Base-LX 7
A
Active Alarms Table 31
Address MAC 36
Address Translation table 18
Admin Status 37
Administrative Status 18
agent alarm port 32
Agent Board Hardware Vs 35
agent board serial number 35
Agent State 31
agentFault 24
Alarm Class 31
alarm class 33
alarm states 24
Application
MIB-II (SNMP2_Agent) 22
Application View 20
B
Bandwidth 36
bearer channels 34
C
Call Logging Interface data 28
ceasing alarm 32
Chassis Device View 12
Chassis Views 20
Class A 32
Cold Start Initiate 36
Colors
Interface Status Label 16
compression mode 29
Condition Status Label 21
Configuration View Interface
Admin Status 37
Bandwidth 36
Last Change
Packet Size 36
Physical Address 36
Critical 24
D
Descr-Active 32
Descr-Passive 32
Device Configuration View Contact Status 24
Number of Interfaces 24
Device icon 7, 20
Device Performance View 10
E
E1/T1 ELU-7 interface 29
Enable/Disable
Ethernet Port (Admin Status) 37
enable/disable redundancy 36
Equip Position 27
EquPos 27
Error Code 31
I n d e x I n d e x
F
flash memory 35
G
Generic Interface Trap Configuration view 38
group switch link 34
GS Active Side 34
I
Icon
Application 21
Icon mode 20
Icon Subviews Menu Interface Label 14
Icon Subviews Menus for Interface icon 17
Icons
Device 7, 20
Interface 15, 16
Indeterminate 24
Interface Adddress Translation Table 24
Interface icon 16
Interface Icon Subviews Menu Options 17
Interface Index 18
Interface Menu Selection IF Details 14
IF Performance 14, 17
Interface Names Table 25
Interface Status View 18
Administrative Status 18
Operational Status 18
internal fault 24
ISDN S0 port 29
L
Labels
Application Icon
Condition Status 21
Model Name 21
Model Type 21
Interface
IF Status Label 16
Interface Number Label 16
Interface Type Label 16
Physical Address Label 17
Module
Module Type 13
Slot Number 13
Port
Port Number 14
Port Status 14
Last Change 36
LIM Detail view 14
LIM information 34
LIM Table 25
linkdown 24
List mode 20
Load Threshold 19
Logical Repeater
Menu Selections 36
Module Details 36
M
Major 24
major applications 20
manager-defined release number 24
MD110 BC 8 firmware 28
Minor 24
minor applications 20
MML parameter EQU 33
MML parameter RO TYPE 33
Mode 29
Mode (Icon or List) 20
Model Information View 38
Model Information views 38
Model type 7
Model Type Label 21
modeled device connections 15
Module Icon Subviews Menu 13
Module Notes 14
I n d e x I n d e x
multiple group switch links 35
N
Neighbor Address 30
Neighbor Name 30
Network I/O ports 15
Normal 24
notPresent 34
Number Active 31
O
Operation Status 37
Operational Status 18
OPI Information Table 28
P
Packet Rate Threshold 19
Packet Size 36
Performance View 10
Performance views 10
Phy Address 36
pin alarm 32
PIN Alarm Information 32
PIN Polling Interval 32
Polarity 32
bandwidth 36
MAC Address 36
off 37
on 37
Physical Address 36
Port ID 27
Port Label Icon Subviews Menu 14
protocol stack 18
R
Required Reading 6
Restricted Rights Notice 3
Route Information 25
S
Secondary Address Panel 18
Serial ports 15
Server port 30
SM-CSI1064 6
SSR_ChassApp 22
state of the connection 24
Status-Side0 35
Status-Side1 35
switch board attendant 28
T
T1 Block Type 33
Tasks 9
tasks 9
Threshold
%Discarded 19
Error Rate 19
Load 19
Packet Rate 19
Trademarks 3
Trap Destination 32
Trunk Endpoints Table 33
U
updating MIB 24
V
Views
Application 20
Configuration 23
Interface Status 18
Model Information 38
I n d e x I n d e x
W