Experimental research of flow servo-valve
Jakub Takosoglu1,*
1
Faculty of Mechatronics and Mechanical Engineering, Department of Manufacturing Engineering and Metrology, Kielce University of Technology, Aleja Tysiaclecia Panstwa Polskiego 7, 25-314 Kielce, Poland
Abstract. Positional control of pneumatic drives is particularly important in pneumatic systems. Some methods of positioning pneumatic cylinders for changeover and tracking control are known. Choking method is the most development-oriented and has the greatest potential. An optimal and effective method, particularly when applied to pneumatic drives, has been searched for a long time. Sophisticated control systems with algorithms utilizing artificial intelligence methods are designed therefor. In order to design the control algorithm, knowledge about real parameters of servo-valves used in control systems of electro-pneumatic servo-drives is required. The paper presents the experimental research of flow servo-valve.
1 Introduction
Pneumatic proportional valves (servo-valves) are the components characterised by great enhancement of the input signal [1-3]. They aim to strengthen and transform incoming signals into strong outgoing signals [4-7] continuously - strong in terms of their flow intensity (flow valves) or pressure (pressure valves) [8, 9]. The greatest enhancements can be gained using electric signals which serve as incoming signals. Hence, proportional valves electrically controlled are applied the most commonly. Such valve consists of two basic systems:
• electro-mechanic transducer, which processes voltage or current signal into linear (angular) shift or force (momentum) [10-12],
• one-, two-, or three-stage amplifier.
Proportional valves are primarily used in control systems [13-17] of electric quick-change production processes [18-22]. The design of electro-pneumatic servo-valves is not substantially different from electro-hydraulic ones [23, 24]. These are most often directional valves with four or two control ends. The slider-sleeve system of pneumatic servo-valves has no elastic seals for lowering frictional drag and consequential hysteresis [25-27]. Lack of sealing results in significant losses of compressed air [28, 29], which can be prevented by using additional flow canal cover in the slider-sleeve system, which, however, creates ‘a callousness zone’ in the servo-valve around the central slider. Table 1 shows the parameters of examined MPYE-5-1/8-HF-010-B proportional valve manufactured by Festo.
Table 1. Proportional valve parameters
Parameters Values
Nominal size 6 mm
Valve function 5/3-way, normally closed Operating pressure range 0-1 MPa
Critical pressure ratio b 0.26
Sonic conductance C 3.110-8 m3/(s·Pa) Nominal flow rate qv 11.67·10-3 m3/s
Critical frequency f 100 Hz
Max. histeresis 0.4 %
Power supply 17-30 V
Setpoint value 0-10 V
The overview of the proportional valve is shown in Fig. 1a, whereas the schematic diagram - in Fig. 1b.
Fig. 1. MPYE-5-1/8-HF-010-B proportional valve: a) general view b) schematic diagram.
2 Determining the pressure
characteristic
p=f(U)
Fig. 2. Diagram of the test stand applied to determine pressure characteristic p=f(U).
1 3
4 5
2
Fig. 3. General view of the test stand: 1 – proportional valve, 2 – xPC Target monitor, 3 – air service unit, 4 – power supply, 5 – pressure transducer
For pressure measurement at 1-2 and 1-4 flow ways of the proportional valve, two digital pressure sensors of PXW series (Peltron) with one voltage-out slot were used. Calibration curve p=f(Up) (pressure p in output voltage function Up) of PXW pressure sensor is shown in Fig. 4.
Fig. 4. Calibration curve p=f(Up) of the pressure sensor.
The linear regression of the calibration curve of PXW pressure sensor was determined with the following formula:
p p p p
p p K K U
p
p ( rG )( rG ) (1)
where:
p – pressure,
Up – pressure sensor output voltage,
Kp – directional coefficient of the calibration curve,
įKp – error of the calibration curve directional coefficient,
pp – free term indicating the intersection of calibration curve with the p axis,
įpp – error of the calibration curve free term.
Constituents (pp± įpp) and (Kp± įKp) of the linear regression of the calibration curve were determined using OriginPro software:
4 4
10 8 . 1 10 9 .
1 r
p
p p
p G (2)
5
10 7 16056 .
0 r
p p p p
U p K
K G (3)
After taking the results (2) and (3) into account, the linear regression of the calibration curve of PXW pressure converter is expressed in the following way:
p
U p 1.9104 r1.8104(0.16056r7105) (4) The measurement data was analysed using Matlab -Simulink package [30-33] of xPC Target software with a 16-bit AD/DA PCI-DAS 1602/16 card manufactured by Measurement Computing and fitted with 16 input slots and two output slots [34-38]. During the measurements, the voltage signal was introduced in a linear and incremental manner onto the solenoid of the proportional valve at 0 up to 10 V. By taking advantage of the calibration curve (Fig. 4), pressure characteristic p=f(U)
of MPYE-5-1/8-HF-010-B proportional valve was determined as shown in Fig.5.
Fig. 5. Pressure characteristic p=f(U) of MPYE-5-1/8-HF-010-B.
3 Determining the flow characteristic
qv=f(U)
The diagram of the test stand which is used to determine flow characteristic qv=f(U) of the proportional valve is shown in Fig. 6, whereas the general view of the stand in Fig. 7.
0 1 2 3 4 5
-0,1 0,0 0,1 0,2 0,3 0,4 0,5 0,6 0,7 0,8
p
(MPa)
Up (V)
calibration curve linear regression
0 2 4 6 8 10
0,0 0,1 0,2 0,3 0,4 0,5 0,6
p
(MPa)
U (V)
Fig. 6. Diagram of the test stand applied to determine flow characteristic qv=f(U): 1 – compressed gas source and filter, 2 – adjustable pressure regulator, 3 – shut-off valve, 4 – flow-rate measuring device, 5 – temperature-measuring instrument, 6 – upstream pressure-measuring tube, 7 – upstream transition connector, 8 – component under test, 9 – downstream transition connection, 10 – downstream pressure-measuring tube, 11 – upstream pressure gauge or transducer, 12 – downstream pressure gauge or transducer, 13 – flow control valve, 14 – barometer.
Fig. 7. General view of the test stand.
In order to select the diameters and lengths of measuring tubes and laminar flow tubes, the dependencies from ISO 6358 were used. The calculations were made on the basis of the diagram shown in Fig. 8.
Fig. 8. Dependencies of the selection of pipe lengths and diameters (according to ISO 6358 [39])
The measurement data was analysed with the use of Sensyflow D software of ABB that comes with a flowmeter, which allows measurement of mass flow and volumetric air flow. The flow-rate characteristic of the component is the dependency of air overpressure behind component p2 in volume flow function qv under constant overpressure p1 in front of component p1. In the case of proportional valves, the flow-rate characteristics are most often shown by drive voltage function. Fig. 9 presents flow-rate characteristic qv=f(U) under constant inlet pressure p1=0.6 MPa.
Fig. 9. Flow-rate characteristic qv=f(U) of MPYE-5-1/8-HF-010-B proportional valve.
4 Determining the response time and
the idle time
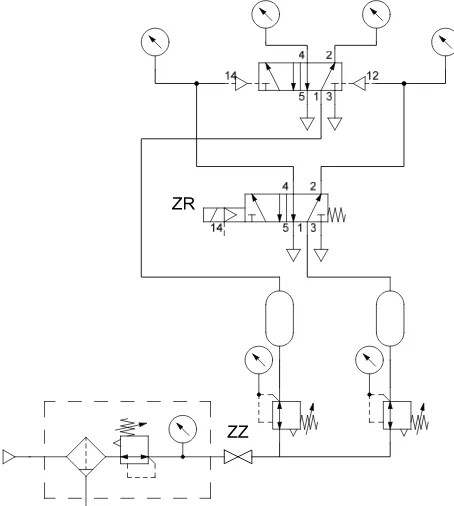
The response time and the idle time of MPYE-5-1/8-HF-010-B proportional valve were measured at ITE-made PT-2 test stand, the diagram of which is shown in Fig. 10, while Fig. 11 presents its overall view.
Fig. 10. Diagram of the test stand applied to determine the response time and the idle time.
Fig. 11. General view of the PT-2 test stand.
determination of the idle time of valves controlled electrically consisted in measuring a time gap between opening or closing the electrical circuit feeding the electromagnet [40, 41], which controls the valve, with output pressure values amounting to zero (the flow route is then closed). At PT-2 test stand, the pressure change (behind the valve) in a time function, as well as the electrical current in the solenoid of the electromagnet controlling the valve were measured. To measure quick pressure changes over time, Minitron MPXG20 with a measuring range between 0 and 1 MPa and accuracy ± 1% was used. A series of 20 measurements was conducted during shifting the proportional valve from extreme positions which corresponded to voltage of 0 V and 10 V, and back – 10 V to 0 V. Table 1 shows the average results of the experimental measurements of the response and idle times for the proportional valve type MPY5-1/8-HF-010-B. The measurements performed at PT-2 stand are consistent with RP 82 P method “Response time characteristic of pneumatic control valves” described in the guidelines of the European Fluid Power Committee (CETOP).
Table 2. Measurement results
valve slider position
response time idle time
10Vo0V 14.4 ms 2.0 ms
0Vo10V 15.1 ms 1.3 ms
4 Summary
Pneumatic proportional valves are mainly used in control systems of quick-change production processes that use advanced control systems, e.g. fuzzy logic, artificial neural networks or state space variables [42-45]. When designing such control systems, true parameters of the proportional valves applied are especially crucial. This article presents the methods and test stands dedicated to determine static characteristics: pressure p=f(U) and flow qv=f(U), as well as the response time and the idle time of MPYE-5-1/8-HF-010-B proportional valve. These methods can successfully be used in further research on control valves.
References
1. J.E. Takosoglu, R.F. Dindorf, P.A. Laski, Int. J. Adv. Manuf Tech. 40, 3-4, 2009
2. P.A. Laski, J.E. Takosoglu, S. Blasiak, Edited by Fuis V. Proceedings of 20th International Conference on Engineering Mechanics 2014 (Brno University of Technology, Czech Republic, 2014)
3. P.A. Laski, J.E. Takosoglu, S. Blasiak, Robot. Auton. Sys. 72, 2015
4. R. Trochimczuk, M. Gawrysiak, Solid State Phenom. 147-149 (2009)
5. R. Trochimczuk, Solid State Phenom. (2013) 6. R. Trochimczuk, Int. J. Appl. Mec. Eng. 19, 9 (2014a)
7. R. Trochimczuk, T. Kumierowski, Int. J. Appl. Mec. Eng. 19, 9 (2014b)
8. P.A. Laski, Edited by Zolotarev I., Radolf V.
Proceedings of 22nd International Conference on Engineering Mechanics 2016 (Academy of Sciences of the Czech Republic, 2016)
9. D.S. Pietrala, Edited by Zolotarev I., Radolf V.
Proceedings of 22nd International Conference on Engineering Mechanics 2016 (Academy of Sciences of the Czech Republic, 2016)
10. P. Wos, R. Dindorf, Mechatronics: Ideas for Industrial Applications, 317, 2015
11. M. Blasiak, R. Kotowski, Przeglad Elektrotechniczny, 85, 12, 2009
12. M. Blasiak, Edited by Zolotarev I., Radolf V.
Proceedings of 22nd International Conference on Engineering Mechanics 2016 (Academy of Sciences of the Czech Republic, 2016)
13. J.E. Takosoglu, Edited by Zolotarev I., Radolf V.
Proceedings of 22nd International Conference on Engineering Mechanics 2016 (Academy of Sciences of the Czech Republic, 2016)
14. J.E. Takosoglu, P.A. Laski, S. Blasiak, G. Bracha, D. Pietrala. Meas. Cont. 49, 2, 2016
15. L. Nowakowski, M. Miesikowska, M. Blasiak, Edited by Zolotarev I., Radolf V. Proceedings of 22nd International Conference on Engineering Mechanics 2016 (Academy of Sciences of the Czech Republic, 2016)
16. L. Nowakowski, E. Miko, M. Skrzyniarz, Edited by Zolotarev I., Radolf V. Proceedings of 22nd International Conference on Engineering Mechanics 2016 (Academy of Sciences of the Czech Republic, 2016)
17. L. Nowakowski, M. Wijas, Edited by Zolotarev I., Radolf V. Proceedings of 22nd International Conference on Engineering Mechanics 2016 (Academy of Sciences of the Czech Republic, 2016)
18. R. Farana, B. Walek, M. Janosek, J. Zacek,
Proceedings of the 15th International Carpathian Control Conference (ICCC), 2014
19. R. Nadolski, K. Ludwinek, Przeglad Elektrotechniczny, 4, 2012
20. H. Wisniewski, L. Plonecki, Proceedings of the 16th International Carpathian Control Conference (ICCC), 2015
21. E. Miko, L. Nowakowski, L. Procedia Eng. 39
(2012a)
22. E. Miko, L. Nowakowski, L. Procedia Eng. 39
(2012b)
23. P. Wos, R. Dindorf, Int. J. Dynam. Control, 2014 24. P. Wos, R. Dindorf, Int. J. Appl. Mec. Eng. 17, 3, 2012
25. G.F. Bracha. Edited by Zolotarev I., Radolf V.
26. S. Blasiak, J. E. Takosoglu, P. A. Laski, J. Therm. Sci. Techn. 9, 2, 2014
27. S. Blasiak, P. A. Laski, J. E. Takosoglu. Int. J. Heat Mass Tran. 57, 1, 2013
28. S. Blasiak, Int. J. of Heat Mass Tran. 81, 2015 29. S. Blasiak, A. Pawinska, Int. J. of Heat Mass Tran,
90, 2015
30. D. Gapinski, Z. Koruba, I. Krzysztofik, Mech. Syst. Signal. Pr. 45, 2 (2014)
31. Z. Koruba, Z. Dziopa, I. Krzysztofik, J. Theor. Appl. Mec. 48, 1 (2010)
32. I. Krzysztofik, Solid State Phenom. 180 (2012) 33. I. Krzysztofik, Z. Koruba, J. Automat. Inform. Sciences 44, 5 (2012)
34. P. Wos, R. Dindorf, Asian J. Contr. 15, 4, 2013 35. P. Wos, R. Dindorf, Dynamical Systems - Applications, 2013
36. J. Zwierzchowski, Edited by Zolotarev I., Radolf V. Proceedings of 22nd International Conference on Engineering Mechanics 2016 (Academy of Sciences of the Czech Republic, 2016)
37. D. Janecki, L. Cedro, J. Zwierzchowski, Metrology Meas. Sys. 22, 2, 2015
38. D. Janecki, J. Zwierzchowski, L. Cedro, B. Pol. Acad. Sci-Tech. Sci. 63, 3, 2015
39. ISO 6358. Pneumatic fluid power - Determination of flow-rate characteristics of components using compressible fluids
40. J.E. Takosoglu, P.A. Laski, S. Blasiak, Edited by Fuis V. Proceedings of 20th International Conference on Engineering Mechanics 2014 (Brno University of Technology, Czech Republic, 2014)
41. S. Blasiak, J.E. Takosoglu, P.A. Laski, Edited by Fuis V. Proceedings of 20th International Conference on Engineering Mechanics 2014 (Brno University of Technology, Czech Republic, 2014)
42. I. Krzysztofik, Edited by Zolotarev I., Radolf V.
Proceedings of 22nd International Conference on Engineering Mechanics 2016 (Academy of Sciences of the Czech Republic, 2016)
43. Z. Koruba, I. Krzysztofik, P. I. Mech. Eng. K-J. Multi-Body Dyn. 227, K1, 2013
44. J.E. Takosoglu, P.A. Laski, S. Blasiak. P. I. Mech. Eng. I-J. Sys. 226, 10, 2012
45. I. Krzysztofik, J. Takosoglu, Z. Koruba. Annual Reviews in Control.