3. Socio-economic position
James Banks Institute for Fiscal Studies and University College London Saffron Karlsen University College London
Zoë Oldfield Institute for Fiscal Studies
The analysis in this chapter shows that:
• Average net disposable family income for individuals aged 50 and over is £346.82 per week. Taking account of household size, this equates to an equivalent for a single adult of £243.44 per week.
• The average level of net financial assets of those aged 50 and over is £43,400 (not counting pensions). Adding housing and other physical wealth results in an average level of resources (excluding pensions) of £155,700.
• The inequality in wealth across the older population is much greater than that observed in incomes. As an indication of this inequality, and also the degree to which the ‘average’ wealth measures are driven by a small number of very wealthy individuals, despite average financial wealth being over £40,000, half the population aged 50 and over have less than £12,000 and a quarter have less than £1,500.
• There are a large number of individuals, particularly amongst single men and women, who have little or no wealth. A quarter of single men and women aged 50 or over have almost no wealth at all.
• Holdings of the three main forms of wealth – housing, pensions and financial assets – are positively correlated in the population. Those without housing or pension wealth also have the lowest levels of financial savings.
• There is a strong correlation between socio-economic position and health. This holds whether socio-economic position is measured by income, wealth or other socio-economic classification. In addition, individuals from higher wealth groups expect to live longer on average.
• The average expectation of receiving inheritances is largest amongst those from the highest wealth groups. These groups are also the most likely to report high probabilities of leaving bequests.
• Individuals’ subjective assessment of their own socio-economic position is correlated with both their actual financial resources and their health.
meet the needs of a population with an increasing fraction of older individuals. Yet this is only one reason to be interested in the incomes and wealth of older individuals. An equally important set of issues surround the relationship between financial resources and health outcomes over an individual’s lifetime. Previous research on this question has typically analysed variation in health outcomes with broader measures of socio-economic position, such as occupational group, social class or even home-ownership. In the UK, such research has only occasionally looked at differences in current income, and even more rarely looked at differences in wealth, not least because of lack of data. The ELSA data provide individual- and family-level indicators of all these dimensions for the first time. Therefore in this chapter we concentrate on describing all aspects of ‘socio-economic position’ in the population in England and discuss the way in which they are related to health outcomes measured very broadly.
When thinking about financial resources, income and wealth measure two different aspects of an individual’s economic position and we discuss both in what follows. Although much policy debate focuses on differences across groups defined by income, such differences do not always reflect underlying ‘permanent’ differences in economic resources if individuals can borrow or draw on savings in order to provide consumption expenditures when their incomes are low. Older individuals are a particularly important case in point, since their earnings are low once they have retired and left the labour market, and this is a predictable event from the point of view of the individual. An extreme example could be an individual with no pension but a large stock of savings held in a bank account. Such savings will not generate particularly high interest income, and the individual will look poor on an income measure, despite living standards being high as a result of their being able to finance consumption from ‘running down’ previously accumulated savings.
For older individuals, accumulated wealth is therefore a particularly attractive supplementary measure of economic resources. Since wealth is just the accumulated sum of past borrowing or saving, it carries with it information on an individual’s past circumstances. Indeed, once someone has left the labour market for good, wealth is a good measure of an individual’s ‘permanent’ income, which can be thought of as capturing their lifetime living standards.1 Such a measure needs to capture private pension wealth, however, which in turn depends on the labour market history of the individual. The ELSA data have been designed to calculate such wealth measures, but at the present time such measures have not been calculated, so we focus simply on ownership of pensions and on any income they may generate after retirement. Of course, once an individual is in the withdrawal or annuity phase of their pension, their private pension income is a sufficient statistic for understanding their private pension wealth.
In addition to private pension wealth, state pension wealth is also important (both the State Earnings-Related Pension Scheme – SERPS – and the basic
1For studies focusing on younger individuals, permanent income may be better captured by
state pension). For those who have retired, we can learn about their state pension wealth from their state pension income. However, for those who are yet to retire, we do not have information on accumulated rights to state pensions. Other benefit income can also be thought of as wealth for those who are entitled to them. For less wealthy or lower income groups, wealth from these sources is likely to be particularly important. In order to calculate these sources of wealth, work histories and National Insurance (NI) contributions histories are required. Plans to collect work histories in a future wave of ELSA have been discussed and it is hoped that the ELSA data will be linked to administrative data on NI contributions in order to calculate other wealth. However, such information is not currently available and in this report we only consider private pension wealth.
As well as pension wealth, housing wealth is also very important, as for many people it represents the largest component of their wealth portfolio. Although ELSA collects information on house values and mortgages, conceptually housing wealth is not straightforward to calculate. This issue is discussed in more detail in Section 3.2 and, despite the conceptual difficulties, we do include housing in our measure of total wealth.
Two broader measures of socio-economic position are examined in addition to income and wealth. One (the NS-SEC or National Statistics socio-economic classification) involved an occupational classification and could be seen as a more objective measure, while the other (the ladder) is a self-reported assessment of ‘social standing’ and could therefore be seen to be a more subjective measure. Subjective social status is examined since it has been argued to reflect not only current social circumstances, but also past socio-economic, educational and economic background, as well as an assessment of a person’s future prospects, opportunities and resources (Singh-Manoux, Adler and Marmot, 2003).
A full breakdown of many of the relevant dimensions of income, wealth and other measures of economic position in the ELSA sample is provided in tables in the Annex to this chapter. The text that follows refers briefly to some of those tables and focuses on a number of key findings that illustrate potentially important variation in circumstances and outcomes in the older population.
3.1 Income and income sources
Tables 3A.1–3A.5 provide a characterisation of income levels, and the importance of various income sources, by age, gender, marital status, employment status and health. The analysis shows variation in both levels of income and sources of income, across age groups and within age groups across employment status groups. In this section, we briefly describe the main differences across age groups.
pension income, state pension income, other benefit income (excluding housing benefit and council tax benefit), asset income and any other income.2 The data are analysed at the individual level but we use a family-unit3 measure of income. This means that for couples, income is summed across the unit and so, all other things equal, a couple would be better off than a single person simply because there are two individuals contributing to family income. For this reason, we take care not to compare income across the different family types.4
Figure 3.1. Mean total weekly net family income and income sources, by age 0 100 200 300 400 500 600 50 -5 4 55 -5 9 60 -6 4 65 -6 9 70 -7 4 75 -7 9 80+ 50 -5 4 55 -5 9 60 -6 4 65 -6 9 70 -7 4 75 -7 9 80+ 50 -5 4 55 -5 9 60 -6 4 65 -6 9 70 -7 4 75 -7 9 80+ £ pe r w e e k
Asset and other
State pensions and benefits
Private pensions
Employment
Single Women Couples
Single Men
As would be expected, younger age groups tend to receive more income from employment and older age groups tend to rely more on state benefits and pensions. Older people have lower income on average than their younger counterparts, and this is particularly true for couples. Note, however, that this
2Although direct comparisons cannot be made from the tables, income measured in ELSA
compares well to income measured in the Family Resources Survey. Mean total income in nominal terms for 50- to 69-year-olds is £404 in ELSA (for the year 2002/3) compared to £384 for the same components measured in the DWP/ONS Family Resources Survey for the previous financial year (2001/2).
3A family unit is defined as a single person or a couple and any dependent children that they
might have.
4An alternative approach is to use an equivalence scale. An equivalence scale is a common,
does not necessarily mean that income declines with age. Current 50-year-olds may well receive different income levels when they reach older ages from those of the current generation of older people because of different lifetime characteristics, different policy environments and real economic growth over time.
On average, couples have higher average levels of income than singles, and while this is to be expected because income is summed across couples, in many age groups couples are at least twice as well off on average as singles. So unless there are no economies of scale in living as a couple, those in couples are typically better off than singles. Single women have less income than single men in all age groups except those aged 50–54, and these differences are most noticeable for those aged 55–64.5 The relative importance of each of the components is broadly comparable in all but the later working ages, where employment income represents a less important component of income for women than for men.
3.2 Wealth levels and wealth inequality
As was discussed at the beginning of this chapter, current income is not the only important factor in assessing living standards. Wealth is an important component of financial resources, particularly in older age groups, as it represents the funds that can be drawn on in retirement. The ELSA survey is the first to collect very detailed information on wealth for all respondents.6 As a result, we have the necessary data to provide a complete picture of the amount of wealth that older people have for the first time.
Since respondents cannot typically ‘self-report’ a financial value for their pension wealth, the ELSA questions are focused on the key features of the pension arrangements and will enable us, in due course, to compute levels of pension wealth from current and past earnings. Since such an exercise is inherently complicated and time-consuming, at this stage we simply report whether respondents currently have (or have ever had) a private pension, and look at how other components of wealth – financial, physical (such as business wealth, land or jewellery) and housing – vary according to pension plan membership. In this section, however, we concentrate solely on total non-pension wealth7 (financial plus physical plus housing wealth minus any debt).
5
This analysis is based on current marital status and, of course, there may be differences within these groups according to past marital history. The potential importance of these effects is not investigated here.
6The British Household Panel Survey collected summary information on financial wealth in
1995 and 2000 but no information on physical assets. The Financial Resources Survey only collects measures of savings (and not debts or physical assets) for a small group of the population. The British Retirement Survey collected some information on wealth although the information was collected at a more aggregate level and respondents were asked only to report a band. In addition, this survey was carried out only in 1988 and 1994 and is not an ongoing study.
7Although we do not include private pension wealth in this analysis, non-pension wealth may
Once again, for couples, wealth is summed across the family unit but analysed at the individual level.
Tables 3A.6–3A.12 provide evidence on the distribution of various measures of wealth, by age, gender, marital status and employment status. Broadly speaking, they show that average wealth is lower amongst older age groups and slightly lower for women than for men (see, for example, Tables 3A.7 and 3A.10). Differences across employment status groups are apparent, with the most striking being the low average wealth of the group defined as ‘long-term sick’ (Table 3A.12). In what follows, we concentrate on the distribution of total non-pension wealth by age, gender and marital status.
Figure 3.2. The distribution of total non-pension family wealth, by age, gender and marital status
50 100 150 200 250 5 0-54 5 5-5 9 6 0-6 4 6 5-6 9 7 0-74 7 5-7 9 8 0+ 5 0-54 5 5-5 9 6 0-6 4 6 5-69 7 0-74 7 5-79 8 0+ 5 0-54 5 5-5 9 6 0-6 4 6 5-6 9 7 0-74 7 5-7 9 80 + £ 00 0 mean median
Single Single women Couples
interquartile range
Figure 3.2 shows the level and distribution of total (non-pension) wealth across groups defined by age and marital status. The grey bars show mean wealth but because of the uneven nature of the distribution of wealth, this mean is heavily influenced by individuals who hold very large amounts of wealth and so is not necessarily a good guide to the amount of wealth held by the majority. For this reason, Figure 3.2 also shows median wealth – the level of wealth that splits the population into two equal halves (half having wealth below this level and half having wealth above it). In order to learn more about inequality in wealth holdings, the black lines surrounding the median span the
interquartile range, their ends representing the 25th and 75th percentile points of the wealth distribution for this group.
The first thing to note about Figure 3.2 is that, in broad terms, older age groups have lower mean and median wealth. Half of individuals aged 50–69 and living in couples have total non-pension wealth of less than around £100,000, whilst for older individuals in couples this value is around £75,000. At any age, singles have less wealth at the mean and median than married individuals of the same age although, because we are measuring family wealth, this is to be expected to some extent. However, in most age groups, mean and median wealth of couples is higher than the wealth of singles by less than a factor of two, so it is possible that the standards of living that their wealth will provide may be comparable at the mean and median. But it is also worth noting that at the 25th percentile, couples are many times wealthier than singles of the same age. It would be hard to argue that such a large difference would be compensated for by lower consumption needs of single people. Simple economic theory suggests that individuals should smooth consumption over their lifetime, and broadly speaking this translates into accumulating assets when income is high (in middle age) and then drawing on those assets after exiting the labour market. However, the hump shape that is apparent in Figure 3.2 should not necessarily be taken as evidence of this sort of ‘life-cycle’ behaviour since, within a cross-section, different age groups are observationally equivalent to different cohort groups. When the current generation of 50-year-olds reach their 70s and 80s, their stock of wealth may look very different from that of people currently at the older ages.
The second noticeable feature of Figure 3.2 is the unequal nature of the distribution of wealth within each group. Although we do not analyse inequality in income in this report, inequality statistics are widely available elsewhere8 and the inequality that is found in the wealth distribution far outweighs that found in the income distribution. For example, amongst single men aged 55–59, mean total wealth is around £122,000 and median wealth is around £60,000. However, 25% of these men have more than £160,000 and 25% have almost zero wealth. For financial wealth alone, the inequality is even more pronounced (Table 3A.7). It is worth noting that this is inequality within age groups. When looking at wealth over the whole population, substantial inequality will emerge purely as a result of age differences within the group meaning that individuals at different points of their life course are being considered together.
The increased inequality in wealth over income is to be expected since the accumulation of wealth is a dynamic process. The stock of wealth is the result of past saving decisions, so inequality that is observed in the stock is the result of the accumulation of past inequality in saving decisions. Nevertheless, the data reveal that, especially for single men and women, a large number of individuals have little or no wealth either to fund their retirement or to draw on in an emergency – a particularly striking feature of Figure 3.2 is the low values for the 25th percentile of wealth for single individuals at all ages.
8
Total non-pension wealth measured here includes residential housing wealth.9 Tables 3A.8 and 3A.9 show that housing forms a very large part of wealth portfolios. We have defined housing wealth to be the current value of the home less any outstanding debt secured on it. However, it is not straightforward to measure housing wealth, because, as well as having investment value, housing also has a consumption value – if an individual were to sell their house, the resources becoming available would then need to finance somewhere else to live. Strictly speaking, this ‘future consumption’ component of housing wealth should be treated differently from the investment component, yet the separation of the components depends on the individual’s future demand for housing services and the extent to which they are willing to downsize their house as they age. Hence we treat the two together, and the housing wealth identified in this section can be thought of as an upper bound on the investment component.
3.3 Wealth and health
As discussed above, ELSA is the first English study to contain detailed information on all components of wealth, so it provides the first opportunity to look at how health measures vary across the wealth distribution. As argued above, wealth represents a better measure of the permanent economic status of older people than income, since it captures the stock of assets that they could use to finance consumption if necessary. There is a strong correlation between wealth and health, which comes through in the data in a number of ways, whether we choose to look at average wealth across health groups (Table 3A.13) or the proportion of each wealth quintile that falls into each health category (Table 3A.14).
Figure 3.3 summarises the key information from Table 3A.13 and shows the full extent of wealth differences across health groups. Within each age group, median wealth for those reporting excellent or very good health is around three times that of those reporting fair or poor health. Similar results are obtained if the data are split by gender subgroups or if one looks at different parts of the wealth distribution.
In Figure 3.4, we present the corresponding data from Table 3A.14, which looks at variation in the fraction reporting fair or poor health across wealth groups within each five-year age band. Again, the health differences are immediately apparent. Taking individuals aged 50–54, for example, amongst those in the poorest fifth of the wealth distribution within this age group almost four in ten report poor health, whereas amongst those in the richest fifth of the wealth distribution less than one in ten report poor health. These differences persist at all ages, although the average across all wealth groups clearly rises with age, as would be expected.
9
Figure 3.3. Median non-pension family wealth, by age and self-reported health
0 20 40 60 80 100 120 140
50-59 60-69 70+
£ '
000s
Excellent/very good
Good
Fair/Poor
Figure 3.4. Percentage reporting fair/poor health, by age and wealth quintile
0 10 20 30 40 50 60
50-54 55-59 60-64 65-69 70-74 75-79 80+
%
Poorest Quintile Quintile 2 Quintile 3 Quintile 4 Richest Quintile
With regard to other evidence on how wealth might be correlated with health, perhaps the part of the health–wealth relationship about which most is known in Britain is the relationship between wealth and mortality. Recent research has shown that, even when controlling for the state of health, an individual’s position in the wealth distribution is an important determinant of subsequent mortality (Attanasio and Emmerson, 2003). The final part of this brief preliminary investigation into links between health and wealth considers the extent to which this relationship holds up when we look at individuals’ expectations of their own future longevity.
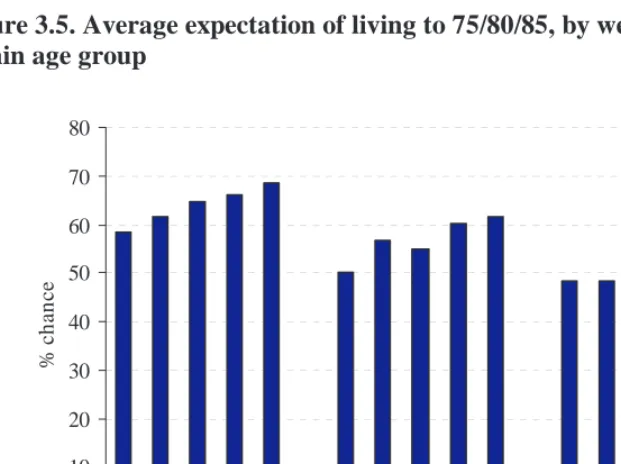
The ELSA data are unusual in that they contain information on individuals’ assessments of the chances of various events or circumstances occurring at some point in the future. Individuals are instructed to report a number between 0 and 100 (per cent), where ‘0 means absolutely no chance and 100 means you think it is absolutely certain to happen’. Individuals aged under 66, 66–69 and 70–74 are asked their chances of living to 75, 80 and 85 respectively.
Tables 3A.15 and 3A.16 report how these probabilities vary across income and wealth groups within each broad age category. For the purposes of the detailed tables, we divide the distribution of respondents’ subjective probabilities into five groups which one can think of as ‘certain not to happen’ (0%), ‘unlikely’ (1%–39%), ‘50–50’ (40%–60%), ‘quite likely’ (61%–99%) and ‘certain’ (100%). The average self-reported chances of living to the relevant age are summarised across wealth groups in Figure 3.5. Again, we see a gradient by wealth group, although less pronounced than in the contemporaneous health measures and only within the two youngest age groups in the ELSA sample.
Figure 3.5. Average expectation of living to 75/80/85, by wealth quintile within age group
0 10 20 30 40 50 60 70 80
P
oor
e
st
2nd 3r
d
4t
h
R
ich
es
t
P
oor
e
st
2nd 3r
d
4t
h
R
ich
es
t
P
oor
e
st
2nd 3r
d
4t
h
R
ich
es
t
%
ch
an
ce
As with all the tables in this volume, cross-sectional relationships should certainly not be interpreted causally. When looking at wealth and health, however, it is not even clear that an extension to longitudinal analysis is always sufficient to enable causal statements to be made, since wealth itself represents the outcome of a forward-looking choice by individuals. The analysis of health and mortality provides perhaps the clearest example of this. Even though wealth is accumulated many years before mortality outcomes are observed, it is possible that the variation in mortality rates may be ‘causing’ the variation in wealth – if an individual expects to die young, they may choose to accumulate less wealth. The unravelling of causal relationships from health (or other measures of socio-economic position) to wealth and vice versa requires careful empirical analysis, and is expected to be one of the main purposes to which ELSA data are put. Only when repeated observations in all the relevant dimensions are available will such analysis begin to become possible.
3.4 Pension and non-pension wealth
So far, we have presented data on income and wealth for the over-50s but that measure of wealth excluded pension wealth. In thinking about adequacy of saving for retirement, pension wealth is clearly very important. As discussed previously, calculating pension wealth for ELSA respondents is complex and we do not directly address it in this report. For those who are still in the contribution phase of their private pension, we can gain some understanding of pension wealth by looking at private pension status – that is, how many people are currently contributing or have ever contributed to a private pension. Chapter 4 analyses pension status in detail and how it varies with activity status. Here, we simply present private pension status in order to learn something about pension wealth and its correlation with other asset holding.
Figure 3.6 is based on the analysis in Chapter 4 (Table 4A.16) and shows the percentage of men and women, by age, who are currently contributing or who have ever contributed to a private pension. Over 90% of men and over 65% of women aged 50–54 have contributed to a private pension at some point in their lifetime. While this is a large proportion, some of these people may have only contributed to a private pension for a small number of years.
The question that we address here is how people choose to allocate their savings across different assets, and whether individuals without pensions are saving for their retirement in other ways. The analysis in Table 3A.17 investigates this, reporting mean and median financial wealth across groups split according to whether individuals have pensions and/or owner-occupied housing.
Figure 3.6. Individual ownership of private pensions, by age and gender
0 10 20 30 40 50 60 70 80 90 100
50-54 55-59 60-64 50-54 55-59
%
currently contributing
ever contributed
Men Women
Figure 3.7. Median financial wealth, by age and broad portfolio status: couples only
5 10 15 20 25 30 35
50-59 60-74 75+ All
£ 000
Housing + private pension Housing only
Private pension only None
comparison with the holdings of assets, as would be expected given the age of the ELSA sample. The numbers in Table 3A.6 reveal that it is also the younger age groups within the ELSA sample who are more likely to have debt, as would be expected. Nevertheless, debt is still far from negligible in the older population. Almost one in five of those over 50 have outstanding credit-card balances (after monthly payments have been made) and more than one in five have other types of outstanding debt.
Figure 3.8. Percentage with different types of financial assets
0 10 20 30 40 50 60 70 80 90 100
Savings accounts
ISAs
TESSAs
Premium bonds National Savings
PEPs
Shares
Trusts
Bonds Other savings
Credit cards
Private debt
Other debt
3.5 Expectations of future resources
Recent policy debate on the adequacy of retirement saving has focused on designing policies to encourage people to save more or work longer.10 The data on wealth presented in this chapter reveal that there are subgroups of individuals who have little or no private resources to fund their retirement or draw upon in an emergency. An understanding of why this is the case, and the way in which such differences feed through into individuals’ expectations of their future resources in retirement, is a key factor in understanding whether policies aiming to encourage increased saving, or indeed compelling people to save more, might be either desirable or effective. In this section, we discuss evidence on individuals’ expectations of future resources. Such data represent a significant departure from standard measures collected in surveys (with the exception of the Health and Retirement Study in the USA) and clearly require
10
significant further analysis in the future. The analysis in this section presents a flavour of the variation in individual expectations with other characteristics.
Firstly, ELSA sample members are asked to report the chances that ‘at some point in the future you will not have enough financial resources to meet your needs’. Again, these chances are collected on a scale of 0 to 100. The distribution of these chances is presented by income and wealth, within age group, in Tables 3A.18 and 3A.19. The probability distribution varies with both income and wealth, as would be expected, but even the most well-off groups are far from certain that their resources will be adequate.
Figure 3.9 plots the mean chance of having insufficient resources to meet needs in future by age-specific wealth quintile and age. In general, the average chance decreases with age except in the richest wealth quintile. It is not surprising that younger individuals state a higher probability since they have a longer expected remaining lifetime in which uncertain events may occur (either with respect to earnings or with respect to post-retirement ‘needs’). The average chance of having insufficient resources also decreases with wealth. This suggests that individuals who have not saved during their life have not necessarily done so under the misapprehension that the State will provide sufficient resources during their retirement.
Figure 3.9. Mean chance of financial resources being insufficient to meet future needs, by age and wealth quintile
0 10 20 30 40 50 60
P
oor
e
st
2nd 3r
d
4t
h
R
ich
es
t
P
oor
e
st
2nd 3r
d
4t
h
R
ich
es
t
P
oor
e
st
2nd 3r
d
4t
h
R
ich
es
t
%
ch
an
ce
Aged 50-59 Aged 60-74 Aged 75+
might be because their wealth is tied up in their house and either they are unwilling to withdraw equity or they may wish to bequeath their wealth. We can examine the issue of bequests using information contained in the survey on expected bequests. Respondents are asked what the chances are of them leaving a bequest at all, leaving a bequest totalling £50,000 or more and leaving a bequest totalling £150,000 or more. The values include the value of property or housing. Tables 3A.20–3A.25 present the distributions of subjective probabilities of leaving a bequest of each magnitude, split by income and wealth groups.
Figure 3.10 shows the average probability of leaving a bequest totalling £150,000 or more by age and (age-specific) wealth quintile. As would be expected, the probability of leaving a large bequest increases with wealth. The average probability decreases slightly with age, particularly in the poorer wealth quintiles. Again, this is not surprising, since the younger age groups have a longer remaining lifetime in which to accumulate greater assets and their existing assets will become worth more over time. It is interesting to note that individuals in the 4th wealth quintile or lower have current wealth of around £225,000 or less. This means that, ignoring any further wealth accumulation, many individuals in these quintiles are expecting to bequeath a large portion of their current wealth.
Figure 3.10. Mean chance of leaving a bequest totalling £150,000 or more, by age and wealth quintile
0 10 20 30 40 50 60 70 80 90 Po o re st 2nd 3r d 4t h Ri c h e st Po o re st 2nd 3r d 4t h Ri c h e st Po o re st 2nd 3r d 4t h Ri c h e st % ch an ce
Aged 50-59 Aged 60-74 Aged 75+
for those aged under 75.11 Firstly, very few people expect to receive inheritance of £100,000 or more. Secondly, the average chance of receiving a large inheritance increases with current wealth, which suggests intergenerational immobility in the wealth distribution.
Figure 3.11. Mean chance of receiving inheritance totalling £10,000 or more or £100,000 or more, by age and wealth quintile
0 5 10 15 20 25 30 35
P
oor
e
st
2nd 3r
d
4t
h
Ri
c
h
e
st
P
oor
e
st
2nd 3r
d
4t
h
Ri
c
h
e
st
%
ch
an
ce
>£10,000 > £100,000
Aged 50-59 Aged 60-74
3.6 Broader socio-economic position
As discussed at the beginning of this chapter, income and wealth are only two possible summary measures of socio-economic position. Others that are explored in this section are occupational classification and subjective economic position. Interpretation of the former needs to take account of the fact that the majority of the older population will have stopped working, so the measure will only be relevant in the sense that it captures their ‘average’ or lifetime status as represented by their occupation in their working life. Cohort differences might be particularly important here when comparing across age groups in a cross-section of the population.
Table 2A.12 in Chapter 2 shows the distribution of the sample into the five National Statistics socio-economic classification (NS-SEC) groups, by age and gender. There is some variation in the occupational division by gender. Greater proportions of men occupy the managerial and professional occupations, small employers and own-account workers and lower supervisory and technical occupations groups, and greater proportions of women are located in the intermediate occupations and semi-routine occupations groups. Variation by age is also apparent, although the degree to which surviving
11The question was also asked of those aged 75 or over but we do not report these numbers in
members from each cohort are differentially drawn from various lifetime occupational groups, as a result of differential mortality, makes such variation relatively uninteresting unless more covariates are added to the analysis.
Table 3A.32 shows how the distribution of occupational classifications varies according to respondents’ self-assessed health. The distribution of respondents into the five NS-SEC classes is similar for men and women reporting excellent, very good or good health. There is some variation between these and those reporting fair or poor health, however, with, particularly, lower proportions of respondents in both gender groups in the managerial and professional occupations group and greater proportions in the semi-routine occupations group.
The second broad measure of socio-economic position we consider is self-reported social position, as captured by ‘ladder position’.12 Table 3A.33 shows the mean scores on the subjective social status ladder, by age and gender. For both men and women, mean self-reported social status scores are lower in older age groups, although this association is less strong for women than for men.
Tables 3A.34 and 3A.35 show the correlations between subjective social status and self-reported health and between subjective social status and income, respectively. Poorer health and lower incomes are both associated with declining mean subjective social status scores.
Table 3A.36 shows that higher wealth is also associated with a higher mean subjective social status score. The pattern of scores by age was less uniform than that seen for income quintiles, however. For both men and women, those in net total wealth quintiles 3, 4 and 5 had some decline in mean subjective social status score with increasing age. However, women in the lowest net total wealth quintile (quintile 1) had increasing mean subjective social status scores with increasing age, while mean subjective social status scores for women in quintile 2 remained similar at each age. Men in the two lowest net total wealth quintiles had mean subjective social status scores that declined between the youngest and middle age ranges, rising again at the oldest ages. The mean subjective social status scores for men in quintile 1 rose (at this oldest age range) to a level above that at either of the two youngest age ranges, while those for men in quintile 2 rose to a level higher than that reported for men aged between 60 and 74 but lower than that reported for men aged between 50 and 59.
To conclude this section and provide some food for thought regarding the general theme of the importance of multi-dimensional measures of socio-economic position such as income, wealth and the broader measures discussed
12A self-anchoring pictorial scale in the form of a 10-rung ladder was used to measure
above, we present some preliminary analysis into the correlation of health with subjective socio-economic position that exists even when controlling for financial resources. Figure 3.12 groups the ELSA population into five wealth quintiles according to the total non-pension wealth measure discussed and analysed in Section 3.2. Within each of these wealth groups, we divide the population according to their subjective ladder position. Although the correlation between wealth and subjective ladder position has been demonstrated above, there is still considerable variation within wealth quintiles. Figure 3.12 shows that this variation is correlated with self-reported health. Although not reported here, results are similar for a measure of health based on limitations in activities of daily living (ADLs), and whether the wealth quintiles are adjusted for age. Possible interpretations of this finding are discussed in the conclusions below.
Figure 3.12. Proportion in excellent/very good/good health, by subjective socio-economic position within wealth quintile
0 0.1 0.2 0.3 0.4 0.5 0.6 0.7 0.8 0.9 1
1 2 3 4 5 6 7 8 9 10
Ladder point
P
ro
por
tion
Poorest quintile
Quintile 2
Quintile 3
Quintile 4
Richest Quintile
3.7 Conclusions
Income, wealth and broader measures of socio-economic position are key dimensions to measure in an ageing study. Firstly, income and, more importantly, wealth provide resources with which individuals can finance consumption, both currently and in the future, particularly during retirement. The analysis in this chapter has characterised the economic resources of the older population in England and discussed the level of, and inequality in, wealth and how it varies according to various characteristics.
over and above broad socio-economic position measures such as occupational class or education, which can be mapped into health outcomes, and this chapter has provided some preliminary descriptive evidence along these lines. When it comes to a more sophisticated analysis, unravelling which dimensions of socio-economic position are important and why is both important and difficult. As an example of this, consider again Figure 3.12, which shows that subjective economic position is correlated with self-reported health even when controlling for an individual’s position in the wealth distribution. Possible interpretations of this correlation could be any one, or indeed any combination, of the following:
• Subjective socio-economic position captures other unobserved dimensions of current socio-economic position that are omitted when we simply control for wealth. For example, if an individual’s ‘needs’ are lower, then their wealth will go further and hence lead to a higher standard of living.
• Subjective socio-economic position captures elements of ‘permanent’ status more accurately than current wealth, and the correlation with health reflects the link between permanent or ‘lifetime’ status and health outcomes.
• Subjective economic position matters over and above true (financial) economic position as a result of psychosocial factors that directly affect health.
• Health is part of what individuals think of when thinking about their socio-economic position, so having better health leads to higher evaluations of subjective socio-economic position, even within a group with the same level of wealth.
• Individuals with more positive dispositions tend to report both higher subjective health and higher subjective socio-economic position than those with a less favourable outlook on life.
In reality, there may well be something to all of these interpretations, and more interpretations may also be relevant. However, the relative importance of such explanations is absolutely key when it comes to designing policy reforms aimed at increasing the health or quality of life of the older population. In addition, the relative importance may well be different for different age or cohort groups within the population aged 50 and over. The ELSA data are unique in providing measurements in all the dimensions needed to evaluate these questions as individuals within the population age, and only as more waves of ELSA data become available will the importance of such relationships become apparent.
References
Attanasio, O. and Emmerson, C. (2003), ‘Mortality, health status and wealth’, Journal of the
European Economic Association, 1: 821–50.
Department for Work and Pensions (2003), Households Below Average Income, 1994/95–
HM Treasury / Department for Work and Pensions (2002), Simplicity, Security and Choice: Working and Saving for Retirement
(http://www.dwp.gov.uk/consultations/consult/2002/pensions/gp.pdf).