Article
1
Ready for green building risks? The case of South
2
Korea from the architect’s point of view
3
Jinho Kim
4
Division of Urban Design and Architecture, Incheon National University, Incheon 22012, South Korea;
5
[email protected]; Tel.: +82-32-835-8981
6
7
Abstract: The number of green buildings has increased to address the global environmental crisis.
8
However, green buildings face risks resulting from new materials and methods. In addition, these
9
buildings are expected to perform at higher levels than traditional ones. The objectives of this
10
study are to identify the possible risk factors for architects developing green building projects in
11
South Korea and to assess risk mitigation measures. To attain this goal, fourteen risk factors and
12
twelve mitigation measures were identified from a comprehensive literature review. A
13
questionnaire survey was administered to architects practicing green building design. Findings
14
revealed the ‘adoption of new technology and processes’ was the largest difference between green
15
and traditional building projects. This study identified ‘financial risk,’ ‘design changes,’ and
16
‘client’s goal uncertainty’ as the top three risk factors in green building design. Additionally, the
17
survey proposed the four most effective risk mitigation measures for green building projects: (1)
18
‘contract indicating each party’s roles, liabilities and limitations clearly’; (2) ‘utilizing integrated
19
design process’; (3) ‘understanding client’s goal in green building projects’; and (4) ‘improving
20
communication and coordination among stakeholders.’ There are a few studies focusing on the
21
architects’ perceived risk concerning green building projects; however, this study expands the
22
knowledge and fills the literature gap. Additionally, this study provides a comprehensive
23
understanding of critical risks and mitigation measures that can benefit South Korea’s green
24
building design practice through better risk management.
25
Keywords: green building; risk management; risk factors, risk mitigation measures; architect
26
27
1. Introduction
28
The rapid increase in the use of fossil fuels that began after the Industrial Revolution has led to
29
global warming and works as a direct cause of climate change [1]. Energy used by buildings
30
accounts for a substantial proportion of carbon dioxide emissions. Evidence shows that buildings
31
consume 40% of energy and materials, as well as 16% of water around the world [2]. In the United
32
States, 68% of electricity consumption, 38% of carbon dioxide emissions, 39% of energy
33
consumption, and 12% of potable water consumption are from buildings [3].
34
Architecture, Engineering, Construction (AEC) experts and government officials have taken
35
the environmental crisis seriously. The green building concept was introduced to actively address it.
36
According to the Environment Protection Agency (EPA) of the United States, green building is ‘the
37
practice of creating structures and using processes that are environmentally responsible and
38
resource-efficient throughout a building’s life-cycle from siting to design, construction, operation,
39
maintenance, renovation and deconstruction.’ [4]
40
Consequently, the green building movement is gaining popularity over the traditional
41
buildings in the United States. In 2005, the green building market consisted of only 2% of all new
42
non-residential construction. By 2010, the number had grown to 28%-35% in the United States [5].
43
Since the United States Green Building Council (USGBC) began full-fledged research on green
44
buildings in 2006, the demand for green buildings remained substantial in 2016. Factors such as
45
client demand, low-cost building operation, and necessity are found to be the factors that will raise
46
the demand for green buildings in the future [6]. Two factors that are considered to be the main
47
drivers of increased demand for green building include participation in resolving global
48
environmental problems and the variety of economic profits these buildings bring.
49
South Korea is on the threshold of transitioning beyond a developing country to an advanced
50
country. It is one of the countries participating in the Organization for Economic Corporation and
51
Development (OECD) that exhibits a substantial influence on the global economy. As a member of
52
the global society, South Korea has a duty to reduce greenhouse gas emissions according to climate
53
change conventions and has been making diversified efforts to achieve this reduction goal. Notably,
54
the South Korean government has established a basic roadmap for national gas reduction by the
55
year 2030. Essentially, the government is pushing forward with a 37% national greenhouse gas
56
reduction target against business as usual (BAU). According to this roadmap, South Korea has
57
agreed to reduce a total of 219 million tons of greenhouse gas. Out of that amount, the building
58
sector plans to reduce its production of greenhouse gases by 35.8 million tons, which is 18.1% of the
59
total reduction target volume. The South Korean government intends to respond more actively to
60
climate change and take the opportunity to shift to a new paradigm of growth [7]. As part of their
61
efforts, the South Korean government announced its Zero Energy Building obligation roadmap in
62
December 2014. According to the timeline, they will begin implementation of the roadmap in the
63
public sector in 2020. A phased implementation in the private sector targets a goal of completion by
64
2025 [8]. In South Korea, the construction industry occupies a substantial share in the national
65
economy and comprises 8.1% of the gross domestic production (GDP) [9]. The demand for green
66
buildings and resulting proportion of green buildings will continue to rise in South Korea based on
67
the shift in policy.
68
In order to meet the rigorous national goal mentioned above, the role of architects is important
69
in the planning, design, construction of not only traditional buildings but also green buildings that
70
require high-quality performance. Architects can assure this high level of quality because they work
71
closely with their clients to discuss the objective, scope, budget, and design of diverse projects from
72
the start. The architect’s design work is defined as the development of design documents that
73
consist of drawings and specifications as well as consulting activities. Their work also involves
74
supervision to confirm whether the content in the design document is accurately reflected in the
75
construction process, including tasks related to the construction contract. At that point, architects
76
assist clients to select contractors and administer construction process. They also work with clients
77
in fulfilling diverse administrative tasks related to different approvals and inspections. Based on
78
their professional knowledge and experience, architects perform the design work that materializes
79
into a building and fully considers the client’s requirements [10].
80
As changes in the construction industry shift the focus to the prioritization of green buildings,
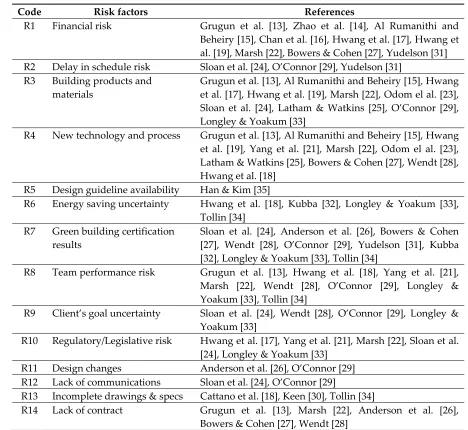
81
the government agencies develop regulations to promote them. Accordingly, the architects are then
82
required to acquire a high standard of expertise and responsibility, which eventually affects the
83
architects’ ‘standard of care.’ The standard of reasonable care is the minimum expectation for
84
architects by law and ‘the most widespread and generally accepted baseline for evaluating the
85
adequacy of design professional performance’ [11]. The AIA B101-2007, Standard Form of
86
Agreement Between Owner and Architect, establishes this standard. Specifically, ‘the architect shall
87
perform its services consistent with the professional skill and care ordinarily provided by architects
88
practicing in the same or similar locality under the same or similar circumstances.’ The architect
89
shall render its services as expeditiously as is consistent with such professional skill and care and
90
the orderly progress of the project [12].
91
Traditional buildings were designed and built in a way that complied with minimum legal
92
requirements. However, architects who design green buildings must not only fulfill such
93
requirements, but also achieve better performance expected for green buildings. Green buildings,
94
and processes to achieve green building status. The benefits of green building include reductions in
96
the consumption and cost of energy and water, the generation and disposal of construction waste,
97
improved indoor air quality and increased worker productivity. However, if a green building fails
98
to fulfill its performance indices addressed above, this could ultimately lead to a client’s
99
dissatisfaction and thereby, conflict.
100
This study aims to identify and evaluate risk factors and mitigation strategies in green
101
buildings in order to determine a scientific basis for better risk management in the South Korean
102
context. Architects are provided to prepare strategies for the upcoming green building projects by
103
understanding potential risks when practicing green building projects. Additionally, this study
104
contributes to previous literature mainly focused on the risks in the construction industry by
105
suggesting design professionals oriented perspective of view.
106
This study is detailed in five sections. In Section 2, review of prior literature and hypotheses
107
are addressed. In Section 3, research methods are presented. Section 4 shows a questionnaire
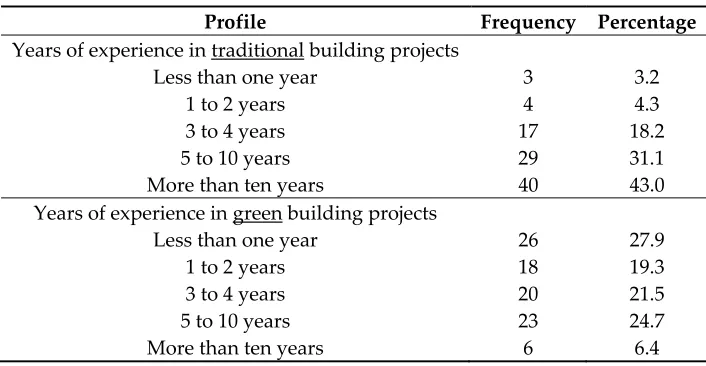
108
survey’s results and discussion. Finally, Section 5 summarizes and concludes the paper.
109
2. Literature Review and Hypotheses
110
Although risk identification studies regarding architectural practice are limited, growing
111
awareness of risks in the green building has been raised. To start, a database search was conducted
112
by using the Scopus database. The search code “(TITLE-ABS-KEY [green building] AND
113
TITLE-ABS-KEY [risk])” was used to search for the articles relating to both green building and risk.
114
An initial review of search results was processed by reading the abstracts and skimming the
115
contents of the articles in order to screen the papers relevant to the research goal. In total, 9 research
116
papers were reviewed thoroughly to identify the risk factors in green building.
117
One line of literature has investigated cost as the main risk factor in green building design and
118
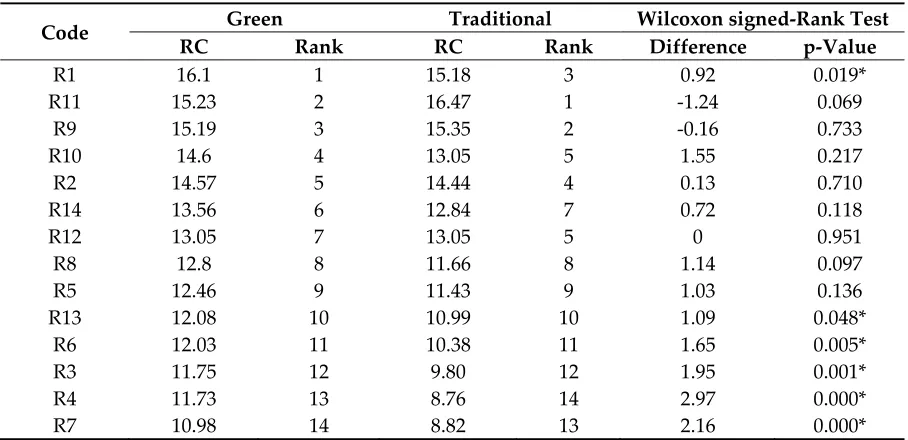
construction. Gurgun et al. [13] recognized the top risk factors to minimize cost impacts in LEED
119
certified projects: (1) when contractors and subcontractors disagree as to standards within their
120
expertise and competence; (2) the high cost of certification; (3) the lack of expertise in new products,
121
materials and technologies; and (4) inadequate definition of parties to the project’s contractual roles
122
and responsibilities. Finally, in using a fuzzy synthetic evaluation approach, Zhao et al. [14]
123
assessed inaccurate cost estimation as the top risk factor. Further, the cost overrun risk was the
124
most critical group in green building projects in Singapore. Al Rumanithi and Beheiry [15] found
125
that utilizing green project management processes could lower the costs and risks of green projects.
126
It could also raise their competitive advantage over conventional projects by presenting the case
127
study in the United Arab Emirates. Chan et al. [16] identified and evaluated 20 barriers to adopt
128
green building technologies in Ghana from a comprehensive literature review. Results from a
129
questionnaire survey performed by green building professionals substantiated that the top three
130
critical barriers were higher initial cost, lack of government incentives, and lack of financing.
131
Identifying risk factors while comparing traditional and green building was conducted in
132
retrofit and commercial green building projects. Hwang et al. [17] summarized 20 risk factors and
133
37 mitigation measures associated with green retrofit projects and conducted a questionnaire
134
survey within the context of Singapore. They found that 19 risks were more critical in green retrofits
135
than its traditional counterpart. The top eight risk factors were identified as post-retrofit tenant’s
136
cooperation, regulations, market demand, project finance, pre-retrofit tenant’s cooperation, and
137
concerns from stakeholders, material supply and availability. Cattano et al. [18] identified that
138
unforeseen conditions were the cause of both schedule delay and cost increase when delivering
139
renovation projects for improved energy performance. Additionally, Cattano et al. [18] proposed
140
the use of a comprehensive building inspection guide that could reduce the risk of unforeseen
141
conditions. Regarding green commercial building projects, Hwang et al. [19] identified the top five
142
critical risk factors after a comprehensive literature and structured interview. Risk factors involve
143
inflation, currency and interest rate volatility that can be worsened by the import of green materials,
144
They found that adoptions of green ideas, materials, and technologies had posed additional risks to
146
green commercial projects.
147
Other researchers have developed stakeholder decision-making models to identify risks in
148
green building. Pearch et al. [20] initiated a study to promote the adoption of green building
149
renovations and employed a process of interactive stakeholder mapping. This process aims to
150
identify possible points of influence for changing stakeholders’ decisions about specific innovations
151
in green building and demonstrating the rewards that green building can bring. Similar to these
152
studies, Yang et al. [21] modeled the interactive networks of the risks associated with different
153
stakeholders in green building projects to comprehend the key risk networks. By using social
154
network analysis methods, risk factors are identified differently between China and Australia;
155
specifically, reputation risk is important in both countries. However, the ethical risk of ‘assessment
156
experience and fairness’ has been highlighted as crucial in the Chinese context. Namely, the
157
government plays a critical role in improving the societies’ knowledge and awareness on green
158
technology uptake in China.
159
Table 1. Risk factors associated with green building design
160
Code Risk factors References
R1 Financial risk Grugun et al. [13], Zhao et al. [14], Al Rumanithi and Beheiry [15], Chan et al. [16], Hwang et al. [17], Hwang et al. [19], Marsh [22], Bowers & Cohen [27], Yudelson [31] R2 Delay in schedule risk Sloan et al. [24], O’Connor [29], Yudelson [31]
R3 Building products and materials
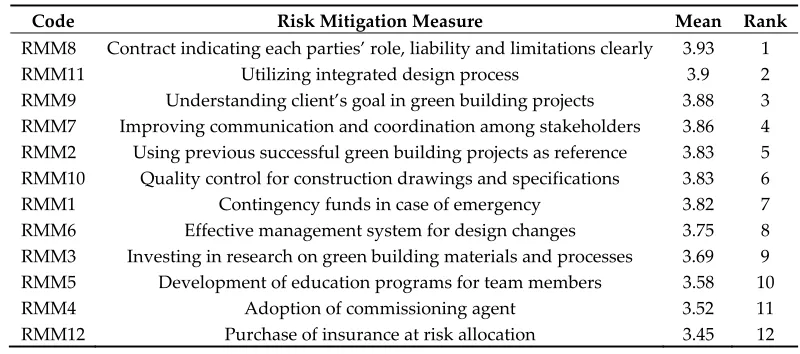
Grugun et al. [13], Al Rumanithi and Beheiry [15], Hwang et al. [17], Hwang et al. [19], Marsh [22], Odom el al. [23], Sloan et al. [24], Latham & Watkins [25], O’Connor [29], Longley & Yoakum [33]
R4 New technology and process Grugun et al. [13], Al Rumanithi and Beheiry [15], Hwang et al. [19], Yang et al. [21], Marsh [22], Odom el al. [23], Latham & Watkins [25], Bowers & Cohen [27], Wendt [28], Hwang et al. [18]
R5 Design guideline availability Han & Kim [35]
R6 Energy saving uncertainty Hwang et al. [18], Kubba [32], Longley & Yoakum [33], Tollin [34]
R7 Green building certification results
Sloan et al. [24], Anderson et al. [26], Bowers & Cohen [27], Wendt [28], O’Connor [29], Yudelson [31], Kubba [32], Longley & Yoakum [33], Tollin [34]
R8 Team performance risk Grugun et al. [13], Hwang et al. [18], Yang et al. [21], Marsh [22], Wendt [28], O’Connor [29], Longley & Yoakum [33], Tollin [34]
R9 Client’s goal uncertainty Sloan et al. [24], Wendt [28], O’Connor [29], Longley & Yoakum [33]
R10 Regulatory/Legislative risk Hwang et al. [17], Yang et al. [21], Marsh [22], Sloan et al. [24], Longley & Yoakum [33]
R11 Design changes Anderson et al. [26], O’Connor [29] R12 Lack of communications Sloan et al. [24], O’Connor [29]
R13 Incomplete drawings & specs Cattano et al. [18], Keen [30], Tollin [34]
R14 Lack of contract Grugun et al. [13], Marsh [22], Anderson et al. [26], Bowers & Cohen [27], Wendt [28]
161
As demonstrated above, the literature review provides a solid foundation for identification of
162
risks in green building. In addition to those noted academic journals, nine additional articles from
163
additional academic journals [34,35] are added to supplement the risks found in architectural’
165
design and consulting services. Finally, the total 23 literatures are categorized according to the
166
classical elements of project management: (1) cost, (2) schedule, and (3) quality. This quality
167
attribute is subdivided in terms of factors affecting production of design drawings (R5, R10), design
168
quality (R11, R13) and consulting services (R8, R9, and R12). Performance risks have been added in
169
order to evaluate the performance of materials and technology applied in the building as well as
170
results of any energy savings in green building certification level (R3, R4, R6, and R7). Contracts
171
without clear lines of responsibilities, roles, and limitations have been added into one of the risk
172
factors since it is a means to prevent legal and administrative risk that can lead to a claim (R14). As
173
a result, fourteen risk factors were identified to conduct a subsequent questionnaire as shown in
174
Table 1.
175
Although these studies provide some evidence of comprehensive studies of green building risk,
176
our knowledge regarding the risk perceptions of architects within the context of service scope
177
remains limited. Therefore, the objective of this study is to answer the following questions: (1) Do
178
differences exist in South Korean architect’s perceived risk factors in terms of designing traditional
179
building and green building?; (2) How do the risk factors for traditional building and green
180
buildings rank?; and (3) What are the effective risk mitigation measures perceived by South Korean
181
architects and how do they rank? To date, research has been conducted on green building risks in
182
terms of construction management, but there have been few studies on the risk factors perceived by
183
architects themselves. Therefore, by shedding light on architect perception, this study will
184
ultimately contribute to the improvement of the quality in green buildings, thereby helping to
185
further advance the construction industry.
186
3. Methods
187
3.1. Data collection and presentation
188
For this study, a questionnaire survey was administered to compare the risk factors and risk
189
mitigation measures for traditional buildings and green buildings as perceived by South Korean
190
architects. Regarding the risk factors, the risk occurrence likelihood and their degree of impact on
191
traditional buildings and green buildings were examined separately.
192
Before beginning the questionnaire survey, it was mandated that the scope of green buildings
193
include those that obtained the following: Green Standard for Energy and Environmental Design
194
(G-SEED), Korean green building rating system; Leadership in Energy and Environmental Design
195
(LEED), another green building rating system developed by the U.S. Green Building Council; the
196
Building Energy Efficiency Certificate and Zero Energy Building Certificate developed and
197
administered by Korea Energy Agency; the Passive Construction Certificate of Passive House
198
Institute Korea. In addition, before it was distributed to respondents, the questionnaire was
199
reviewed overall by two experts who have full knowledge in questionnaire survey methodology, as
200
well as by an architect who has more than 10 years of experience in architectural design.
201
After undergoing a revision process for survey items and questions, the final version of the
202
questionnaire was written using Google Survey [36]. The subject of the survey was South Korea’s
203
leading architectural design firms which are ranked within 15th in sales volume from Korea
204
Financial Supervisory Service. Among them, 10 companies able to answer the questionnaire were
205
selected; the number of respondents from each company was limited to 20 staff members working
206
in architectural design. The questionnaire was sent through e-mail in February 2018 and
207
respondents were given four weeks to answer. Weekly reminders were sent via phone or e-mail to
208
encourage respondents to answer the questionnaire. A total of 96 questionnaire copies were
209
collected, three of which were excluded due to insufficient answers. A total of 93 copies of the
210
questionnaire were analyzed. The response rate for the questionnaire survey was 47.5%.
211
Table 2 shows the distribution of respondent’s experiences in the field. As shown, 74.1% of the
212
respondents had more than five years of experience in designing traditional buildings, while 52.6%
213
the respondents had sufficient experience for the study’s objective and that the collected data was
215
representative.
216
Table 2. Profiles of survey respondents
217
Profile Frequency Percentage
Years of experience in traditional building projects
Less than one year 3 3.2
1 to 2 years 4 4.3
3 to 4 years 17 18.2
5 to 10 years 29 31.1
More than ten years 40 43.0
Years of experience in green building projects
Less than one year 26 27.9
1 to 2 years 18 19.3
3 to 4 years 20 21.5
5 to 10 years 23 24.7
More than ten years 6 6.4
218
Table 3. Rating scales for LO and MI
219
Likelihood of Occurrence Magnitude of Impact
LO Linguistic Terms Likelihood of References MI Linguistic Terms
1 Rare <20% 1 Insignificant
2 Unlikely 20%-40% 2 Minor
3 Moderate 40%-60% 3 Moderate
4 Likely 60%-80% 4 Major
5 Almost certain >80% 5 Catastrophic
220
3.2. Criticality index
221
To evaluate the criticality of each risk, this study adopted the risk criticality (RC) index used in
222
previous relevant studies [37-41]. This RC index has been extensively perceived as the function of
223
the likelihood (LO) of occurrence and magnitude (MI) of impact. In this study, respondents were
224
asked to assess the LO and MI using five-point Likert scales as shown in Table 3. By using
225
equations (1), (2), (3), and (4), LO, MI, and RC can be measured respectively:
226
227
= ∑ , (1)
= ∑ , (2)
where n = the total number of respondents, LOi = the likelihood assessment of risk i, LOi = the likelihood assessment of risk i by respondent j, MIi = the magnitude assessment of risk i, and MIi = the magnitude assessment of risk i by respondent j [37].
= × , (3)
= ∑ , (4)
228
where n = the total number of respondents, RCi = the risk criticality of risk i by respondent j, and
229
4. Results and discussions
231
4.1. Risk criticalities: Traditional versus Green Building Projects
232
As actively practicing architectural design service in South Korea, the respondents were asked
233
to evaluate the LO and MI for the 14 risk factors. RC values, ranking, and difference were calculated
234
between green and traditional projects as shown in Table 4. The paired t-test was used to verify the
235
difference in RC values between the two groups. The results showed that p-values of 6 risk factors
236
were below 0.05, suggesting that there were significant differences in RC values between green and
237
traditional projects. The RC values of these 6 risks in green projects were higher than those in
238
traditional projects, suggesting that the research hypothesis was supported.
239
Table 4. Comparison of RC values between green and traditional building projects.
240
Code Green Traditional Wilcoxon signed-Rank Test
RC Rank RC Rank Difference p-Value
R1 16.1 1 15.18 3 0.92 0.019* R11 15.23 2 16.47 1 -1.24 0.069
R9 15.19 3 15.35 2 -0.16 0.733 R10 14.6 4 13.05 5 1.55 0.217
R2 14.57 5 14.44 4 0.13 0.710
R14 13.56 6 12.84 7 0.72 0.118
R12 13.05 7 13.05 5 0 0.951
R8 12.8 8 11.66 8 1.14 0.097 R5 12.46 9 11.43 9 1.03 0.136 R13 12.08 10 10.99 10 1.09 0.048*
R6 12.03 11 10.38 11 1.65 0.005* R3 11.75 12 9.80 12 1.95 0.001* R4 11.73 13 8.76 14 2.97 0.000* R7 10.98 14 8.82 13 2.16 0.000*
*indicates the paired t-test result is significant at the 0.05 significance level.
241
242
The risk ‘R4-Adoption of new technologies and process’ indicates the largest difference
243
(Diff.=2.97). Contemporary green building is relatively young, with innovative new approaches and
244
technologies introduced to improve building performance. These recent practices, however, add a
245
layer of complexity that requires diligent maintenance and monitoring to prevent potential water or
246
moisture issues that could damage the building’s integrity. For example, installation of green roof,
247
the practice of increased ventilation and building flush out, and increased insulation within the
248
exterior walls which change the location of the dew point, can bring unintended moisture into the
249
building, resulting in mold issues, especially in hot and humid climates [23]. Architect needs to
250
make decisions of their applications based on technical data from the manufacturer and to test and
251
evaluate its effectiveness using mock-ups before applying in the construction fields [26].
252
Communication among project stakeholders is essential; architects needs to inform any risks
253
uncovered during the selection process and to discuss contractors with any potential issues during
254
construction phase.
255
The risk ‘R7-Green Building Certification Results’ has the second largest difference (Diff.=2.16).
256
Green building rating system such as G-SEED or LEED performs the evaluation per each criteria
257
and gives the final grade for the purpose of an objective evaluation by a third party. In addition, the
258
certification grade can be a very sensitive issue for clients who are the beneficiary of green
259
buildings, as the tax benefit or incentive granted to them can differ according to the result of the
260
certification. There exists a likelihood of dispute between architects and clients if the final grade is
261
lower than expected or the certification itself fails. It is recommended that architects refrain from
262
a building will achieve a specific level of certification, they may assume a high amount of risks
264
based on the fact that insurance companies often do not cover such warranties [34,42].
265
The risk ‘R3-Building products and materials’ has the third largest difference (Diff.=1.95).
266
Some green products are in high demand and low supply, which results in a long lead time,
267
thereby affecting the project schedule. Additionally, use of salvaged materials in new projects, the
268
use of recycled content materials, and selection of locally produced buildings materials is highly
269
encouraged to reduce the environmental footprint associated with extraction, production, and
270
transportation of the building materials. However, the performance of new products can create a
271
risk since they are developed without enough time to field test. When these untested products fail
272
to meet the expected levels of performance, this can lead to legal disputes over who is responsible.
273
In order to prevent potential liability issues out of specifying green products and materials,
274
architects have a duty to discuss untested or new products with the client. Additionally, they must
275
describe any possible impacts on the project, including, but not limited to, product performance
276
and achieving an expected green building certification level. Language in the contract should
277
address the issue of risks of new materials in order to protect architects from claim. Examples may
278
include (1) “the owner will render a decision [about untested materials] and (2) the architect shall
279
be permitted to rely on the manufacturers’ or suppliers’ representations and shall not be
280
responsible for any failure of the Project to achieve the Sustainable Objective as a result of the use of
281
such materials or equipment [43].”
282
The risk ‘R6-Energy Saving Uncertainty’ has the fourth largest difference (Diff.=1.65). When
283
considering a building’s operational performance, clients and tenants tend to expect that green
284
buildings will reduce environmental impacts, reduce energy and water costs, and involve less
285
maintenance and other long-term benefits to the building owner. Energy efficiency is one of the
286
most compelling green building performance factors to reduce operating costs. However, there are
287
too many factors beyond the control of the architects to meet energy saving goals. Most of all, even
288
though architects incorporate green features into the building, there is a considerable gap between
289
design and occupancy. Any outcome in energy consumption is predicated based on assumptions
290
which need to be understood by the owner, facilities manager, and tenants who must properly
291
operate and maintain the equipment systems. It is recommended architects hire a commissioning
292
agent before and after construction to catch potential problems as necessary to achieve the planned
293
energy savings [28].
294
The risk ‘R13-Incomplete drawings and specifications’ ranked the fifth (Diff.=1.09). Contract
295
documents consist of drawings and specifications as well as related supplementary paper work.
296
Incomplete contract documents result from unclear and inadequate documentation, insufficient site
297
investigation, and design changes [30]. This ultimately results in design changes and an increase in
298
construction cost and period of time it takes to build. As green buildings require higher
299
performance than traditional buildings, thereby bearing high complexity [44,45], a greater influence
300
is exerted onto green buildings than traditional buildings in case the design documents and
301
specifications are not perfectly matched.
302
The statistical analysis results from this study’s questionnaire survey revealed similarities
303
between the risk factors for green buildings and the risk factors for traditional buildings in
304
R1-Financial risk, R11-Design changes, R9-Client’s goal uncertainty, R10-Regulatory and legislative
305
risk, R2-Delay in schedule risk, R14-Lack of contract, and R12-Lack of communications.
306
The result of the Wilcoxon-rank test verified that R1-Financial Risk was the primary risk factor
307
for green buildings that differed from traditional buildings. Diverse factors that arise in the process
308
of pushing forward with green building design and construction are thought to be the cause. The
309
factors involved in financial risks likely include the following: design change due to the client’s
310
unexpected new direction, the architect’s lack of experience and knowledge of the system of green
311
buildings; unexpected increases in budget or cost that consequently occur; and increase in the
312
budget following the selection of products and materials available to fulfill green building
313
green buildings risk factors; and (2) unlike traditional buildings, the budget impact could be an
315
additional risk for green buildings.
316
4.2. Proposed risk mitigation measures
317
This study also surveyed respondents to assess the efficiency of the 12 risk mitigation
318
measures developed from the literature. Table 5 shows the 12 risk mitigation measures as ranked to
319
tackle risks associated with green building design service in South Korea. Mitigation measures
320
above 3.85 values are discussed as follows.
321
Table 5. Risk mitigation measures in green building projects in South Korea.
322
Code Risk Mitigation Measure Mean Rank
RMM8 Contract indicating each parties’ role, liability and limitations clearly 3.93 1
RMM11 Utilizing integrated design process 3.9 2
RMM9 Understanding client’s goal in green building projects 3.88 3 RMM7 Improving communication and coordination among stakeholders 3.86 4 RMM2 Using previous successful green building projects as reference 3.83 5 RMM10 Quality control for construction drawings and specifications 3.83 6
RMM1 Contingency funds in case of emergency 3.82 7
RMM6 Effective management system for design changes 3.75 8 RMM3 Investing in research on green building materials and processes 3.69 9 RMM5 Development of education programs for team members 3.58 10
RMM4 Adoption of commissioning agent 3.52 11
RMM12 Purchase of insurance at risk allocation 3.45 12
323
The risk mitigation measure ‘RMM8-Contract indicating each party’s role, liability and
324
limitations clearly’ was assessed as the most effective measure with the highest evaluation of 3.93.
325
Many disputes arise from miscommunications and misunderstandings on roles, responsibilities,
326
and limitations that could be lessened by using precise contract language. The contracting parties
327
should clearly define the scope of work, schedule, building performance expectations, certification
328
levels, and risk allocation in their contracts [25]. AIA Document ‘D503-2013 Guide for Sustainable
329
Projects’ developed by the AIA can be considered as a reference guide [43].
330
The risk mitigation measure ‘RMM11-Utilizing integrated design process’ scored the
331
second-highest value at 3.9. The process of an integrated design process (IDP) represents the
332
prospect for risk reduction by architects in a green building project. The traditional delivery method
333
is the design-bid-build process in which the client contracts with separate entities for design and
334
construction. Specifically, the project is designed by separate teams of architects and engineers and
335
then put out for bidding to general contractors. The contractors build the project according to
336
developed designs. However, this project delivery method is not ideal when employing an IDP
337
because it may discourage collaboration among parties involved in construction projects. In
338
contrast to traditional processes, the integrated design processes can pull together a
339
multi-disciplinary team of architects, consultants, clients, tenants, contractors to work from the
340
project’s start and promote better communication. The goal of the IDP is to optimize the building’s
341
performance while reducing any rework, delay, and cost overrun that can challenge a successful
342
green building project with complicated systems and technologies. Alternative project delivery
343
methods can facilitate the integrated design process [27,28,46] and close collaboration; specifically,
344
adoption of design-build contracts, construction managers at-risk, and integrated project delivery
345
(IPD).
346
The risk mitigation measure ‘RMM9-Undertanding client’s goal in green building projects’
347
received the third highest value at 3.88 in the effectiveness evaluation. It is highly recommended
348
that clients establish sustainability goals, the level of certification where relevant, and related
349
reduces the potential for misunderstanding among clients, architects, and contractors, defines clear
351
goals and responsibilities in the design process and provides the potential to reduce project time
352
and costs resulting from miscommunications among related parties.
353
The risk mitigation measure ‘RMM7-Improving communication and coordination among
354
stakeholders’ was assessed as the fourth most effective measure with an evaluation of 3.86. It is
355
important to assure the flow of information throughout the project development process in order to
356
reduce defects in design and construction. This is particularly prudent where some parties may be
357
new to green building. Measures to assure information flow include: (1) holding meetings with the
358
design team to review project requirements and goals; (2) clarifying additional documentation and
359
other certification-related requirements particularly with general contractors and attorneys; (3)
360
holding meetings with general contractors, subcontractors, and attorneys to ensure that they
361
understand the purpose of green-related requirements; and (4) providing additional training and
362
materials to subcontractors where necessary [27]. ‘The greatest risk management tool is reaching
363
understanding and clear communication between the architect, owner, and contractor’ [24]. Such
364
mutual understanding requires in-depth collaboration among parties to minimize the potential
365
risks associated with new practice with innovative technologies and materials applied in the green
366
building design.
367
5. Conclusions
368
The demand for green building has increased in recent years due to global crisis and benefits
369
from saving related to energy and natural resources. However, this relatively new practice is
370
exposed to potential risks generated from new materials and methods, along with raised
371
expectations of higher performance than that of traditional buildings.
372
This study first conducted a questionnaire survey to determine the risk factors associated with
373
the green building design services in South Korea from the architect’s point of view. The findings
374
revealed that ‘adoption of new technology and process’ had the largest difference in criticality
375
between green and traditional building projects. Furthermore, this study identified ‘financial risk,’
376
‘design changes,’ and ‘client’s goal uncertainty’ as the top three critical factors in green building
377
design.
378
In addition, the survey identified the four most effective risk mitigation measures in green
379
building projects: ‘contract that clearly indicates each party’s role, liability, and limitations,’
380
‘utilizing integrated design processes,’ ‘understanding client’s goal in green building project,’ and
381
‘improving communication and coordination among stakeholders.’ In order to avoid potential risks
382
for a green building project, the integrated design process must be based on open communications.
383
Additionally, contracts must clearly define performance expectations.
384
Despite these are two basic limitations inherent in this study. First, the respondent resource
385
used in the survey is confined to major architectural design firms only. The architects’ working in
386
small or mid-sized firms has been excluded. Thus, careful attention should be given when the
387
results from the analysis are generalized and applied. Second, findings from this study apply to
388
South Korea exclusively, which in turn, may vary from other counties in different conditions.
389
In this study, this is the first time mitigation measures and diverse risk factors which affect the
390
architects’ practice have been investigated in green building projects. Thus, in spite of limitations
391
addressed above, findings from this study are still beneficial. This study has provided the
392
foundation to benefit South Korea’s green building industry by means of better risk management.
393
By analyzing potential risks that are foreseeable and taking reasonable precautions, architects are
394
able to minimize exposure to losses and potential disputes. By including architecture, industry
395
practitioners in engineering and construction can obtain a deeper understanding of potential risks
396
in green building projects. In doing so, they prepare a customized checklist and strategies for the
397
upcoming green building projects.
398
Three research topics can be suggested for future research subjects: (1) comparison studies that
399
assess and identify the risk factors perceived between architects and contractors or between South
400
development based on collecting and analyzing the legal cases involving green building design and
402
construction; and (3) identifying risk factors and effective risk mitigation measures through
403
in-depth interviews with AEC industry professionals.
404
Acknowledgments: This research was made possible by financial support of the Incheon National University
405
newly appointed faculty grant. Project number: 2015-1821
406
Conflicts of Interest: The author declares no conflict of interest.
407
Appendix A. Questionnaire Used for This Study
408
Section 1: Background Information of Respondent
409
1. Please select your age range
410
A. Twenties
411
B. Thirties
412
C. Forties
413
D. Fifties
414
E. Sixties and older
415
2. Are you currently employed in the architectural design firm?
416
A. Yes
417
B. No
418
3. Please identify the number of green building projects
419
A. Less than 5
420
B. 5 to 10
421
C. 11 to 15
422
D. More than 20
423
4. Please identify your years of experience in architectural design service
424
A. Less than 1
425
B. 1 to 2 years
426
C. 3 to 4 years
427
D. 5 to 10 years
428
E. More than 10 years
429
5. Please identify your years of experience in green building design service
430
A. Less than 1
431
B. 1 to 2 years
432
C. 3 to 4 years
433
D. 5 to 10 years
434
E. More than 10 years
435
Section 2: Assessment of Risks of Traditional Building Design Service
436
Based on your design experience in traditional building projects, please evaluate each risk
437
factor below in terms of its likelihood and magnitude of impact using five-point Likert scales:
438
Likelihood of occurrence: 1-Rare; 2-Unlikely; 3-Moderate; 4-Likely; 5-Almost certain.
439
Magnitude of impact: 1-Insignificant; 2-Minor; 3-Moderate; 4-Major; 5-Catastrophic.
440
441
Code Risk Factors Likelihood of Occurrence Magnitude of impact
1 2 3 4 5 1 2 3 4 5
Financial risk
Delay in schedule risk
Building products & materials
Design guidelines availability
Energy saving uncertainty
Green building rating results
Team performance risk
Client’s goal uncertainty
Regulatory/Legislative risk
Lack of communications
Incomplete drawings & specs
Lack of contract
Section 3: Assessment of Risks of Green Building Design Service
442
Based on your design experience in green building projects, please evaluate each risk factor
443
below in terms of its likelihood and magnitude of impact using five-point Likert scales:
444
Likelihood of occurrence: 1-Rare; 2-Unlikely; 3-Moderate; 4-Likely; 5-Almost certain.
445
Magnitude of impact: 1-Insignificant; 2-Minor; 3-Moderate; 4-Major; 5-Catastrophic.
446
447
Code Risk Factors Likelihood of Occurrence Magnitude of impact
1 2 3 4 5 1 2 3 4 5
Financial risk
Delay in schedule risk
Building products & materials
New technology and process
Design guidelines availability
Energy saving uncertainty
Green building rating results
Team performance risk
Client’s goal uncertainty
Regulatory/Legislative risk
Lack of communications
Incomplete drawings & specs
Lack of contract
Section 4: Assessment of Risk Mitigation Measures for Green Building Design Service
448
Based on your design experience in green building projects, please evaluate the following risk
449
mitigation measures regarding their effectiveness, using five-point Likert scales:
450
Effectiveness: 1-Totally ineffective; 2-Ineffective; 3-Neutral; 4-Useful; 5-Very useful.
451
452
Code Risk Mitigation Measures
Effectiveness
1 2 3 4 5
RMM2 Using previous successful green building projects as reference
RMM3 Investing in research on green building materials and processes
RMM4 Adoption of commissioning agent
RMM5 Development of education programs for team members
RMM6 Effective management system for design changes
RMM7 Improving communication and coordination among stakeholders
RMM8 Contract indicating each party’s role, liability, and limitations clearly
RMM9 Understanding client’s goal in green building project
RMM10 Quality control for construction drawings and specifications
RMM11 Utilizing integrated design process
RMM12 Purchase of insurance at risk allocation
References
453
1. Intergovernmental Panel on Climate Change (IPCC). IPCC Fifth Assessment Report. Available online:
454
http://www.ipcc.ch/pdf/assessment-report/ar5/syr/AR5_SYR_FINAL_SPM.pdf (accessed on 14 March
455
2018).
456
2. Roodman, D.M.; Lenssen, N. Worldwatch Paper#124: A building revolution: How ecology and health
457
concerns are transforming construction. Available online: http://www.worldwatch.org/node/866
458
(accessed on 14 March 2018).
459
3. United States Environmental Protection Agency. Why build green? Available online:
460
https://archive.epa.gov/greenbuilding/web/html/whybuild.html (accessed on 14 March 2018).
461
4. United States Environmental Protection Agency, Definition of green building Available online:
462
https://archive.epa.gov/greenbuilding/web/html/about.html (accessed on 14 March 2018).
463
5. McGraw Hill Construction. Green outlook 2011: Green trends driving growth. Available online:
464
https://www.bdcnetwork.com/green-building-market-grows-50-two-years-green-outlook-2011-report
465
(accessed on 14 March 2018).
466
6. Dodge Data & Analytics. Smart Market report: World green building trends 2016. Available online:
467
http://fidic.org/sites/default/files/World%20Green%20Building%20Trends%202016%20SmartMarket%20R
468
eport%20FINAL.pdf (accessed on 14 March 2018).
469
7. Ministry of Environment. 2030 National Greenhouse Gas Reduction Basic Roadmap of South Korea.
470
Available online: http://www.me.go.kr (accessed on 14 March 2018).
471
8. Korea Energy Agency. Certification of Zero Energy Building of South Korea. Available online:
472
http://www.kemco.or.kr/web/kem_home_new/ener_efficiency/building_08.asp (accessed on 14 March
473
2018).
474
9. The Bank of Korea. 2016 Annual Report. Available online:
475
http://www.conslove.co.kr/news/articleView.html?idxno=1041 (accessed on 14 March 2018).
476
10. The Construction Specification Institute. The Project Resource Manual, 5th ed.; McGraw-Hill, New York,
477
NY, USA, 2005; pp.4.1-4.82, ISBN 0-07-137004-8.
478
11. Hatem, D.J. Green and sustainable design part I: Professional liability risk and insurability issues for design
479
professionals; Donovan Hatem LLP: Boston, MA, USA, 2010.
480
12. AIA. B101-2007 Standard Form of Agreement Between Owner and Architect. Available online:
481
https://www.aiacontracts.org/contract-documents/21392-owner-architect-agreement (accessed on 14
482
March 2018).
483
13. Gurgun, A.P.; Arditi, D.; Vilar, P.C. Impacts of construction risk on costs in LEED-certified projects. J
484
Green Build.2016, 11, 163-181. doi:10.3992/jgb.11.4.163.1
485
14. Zhao, X.; Hwang, B.G.; Gao, Y. A fuzzy synthetic evaluation approach for risk assessment: A case of
486
Singapore’s green projects. J. Clean. Prod. 2016, 115, 203-213. doi:10.1016/j.jclepro.2015.11.042
487
15. Al Rumaithi, K.H.; Beheiry, S.M. A framework for green project management processes in construction
488
16. Chan. A.P.C.; Darko, A.; Olanipekun, A.O.; Ameyaw, E.E. Critical barriers to green building technologies
490
adoption in developing countries: The case of Ghana. J. Clean Prod. 2018, 172, 1067-1079.
491
doi:10.1016/j.jclepro.2017.10.235
492
17. Hwang, B.G.; Zhao, X.; See, Y.L.; Zhong, Y. Addressing risks in green retrofit projects: The case of
493
Singapore. Proj. Mang. J. 2015, 46, 76-89. doi:10.1002/pmj.21512
494
18. Cattano, C.; Valdes-Vasquez, R.; Klotz, L. Barriers to the delivery of building renovations for improved
495
energy performance: A literature review and case study. In Proceedings of the International Conference
496
on Sustainable Design and Construction 2011, Kansas City, MO, United States, March 2011; pp.203-210.
497
19. Hwang, B.G.; Shan, M.; Supa’at, N.N.B. Green commercial building projects in Singapore: Critical risk
498
factors and mitigation measures. Sustain. Cities and Soc.2017, 30, 237-247. doi:10.1016/j.scs.2017.01.020
499
20. Pearce, A.R.; Doshi, P.; Carneal, M.G. Leverage points for sustainability: Targeting stakeholders,
500
innovations, and decision types of maximal influence. In Proceedings of Construction Research Congress
501
2016: Old and New Construction Technologies Converge in Historic San Juan, CRC 2016, San Juan,
502
Puerto Rico, May 2016; pp.1181-1191.
503
21. Yang, R.J.; Zou, P.Z.W.; Wang, J. Modelling stakeholder-associated risk networks in green building
504
projects. Int. J. Proj. Manag.2016, 34, 66-81. doi:10.1016/j.ijproman.2015.09.010
505
22. Marsh Group Inc. Green building: Assessing the risks. Available online
506
https://c.ymcdn.com/sites/acrel.site-ym.com/resource/collection/D1CFEE37-A66B-4712-9DFC-6687A87B1
507
FD9/Maloney_ACREL_Exhibit_3.pdf (available at 14 March 2018).
508
23. Odom, J.D.; Scott, R.; DuBose, G.H. The hidden risks of green buildings. Available online:
509
http://www.buildingforensicsgroup.com/wp-content/uploads/2016/06/NCARB-MIni-Hidden-Risks-Of-Gr
510
een-Buildings_No-Covers.pdf (available at 14 March 2018).
511
24. Slone, D.; McGlamery K.; Blake, D.; York, J. The legal risk in building green: New wine in old bottles?
512
USGBC Panel Discussion, Washington, D.C., USA, 2009.
513
25. Latham & Watkins Environment, Land & Resource Department. Green building projects: The growing
514
trend brings both opportunities and potential liability risks. Available online:
515
https://www.lw.com/thoughtLeadership/risks-in-growing-trend-of-green-building-projects (available at
516
14 March 2018).
517
26. Anderson, M.K.; Bidgood, J.K.; Heady, E.J. Hidden legal risks of green building, Fla. Bar. J.2010, 84, 35-41.
518
27. Bowers, K.; Cohen, L. The Green Building Revolution: Addressing and Managing Legal Risks and Liabilities;
519
Harvard Law School, Environmental Law & Policy Clinic, 2009.
520
28. Wendt, A. Will I get sued? Managing risk in green building. Available online:
521
https://www.buildinggreen.com/feature/will-i-get-sued-managing-risk-green-building (accessed on 14
522
March 2018).
523
29. O’Connor, H. Architect’s professional liability risks in the realm of green buildings. Available online:
524
https://uk.perkinswill.com/files/ID%204_PWRJ_Vol0402_03_Architect%E2%80%99s%20Professional%20L
525
iability%20Risks%20in%20the%20Realm%20of%20Green%20Buildings.pdf (accessed on 14 March 2018).
526
30. Keen, B. The pitfalls of incomplete contract documents. Available online:
527
https://www.revay.com/index.php/publications/the-revay-report (accessed on 14 March 2018).
528
31. Yudelson, J. Reinventing green building: Why certification systems aren’t working and what we can do about it, 1
529
st ed.; New Society Publishers: Gabriola Island, Canada, 2016; pp87-135, ISBN978-0-86571-815-9.
530
32. Kubba, S. Handbook of green building design and construction, 2nd ed.; Butterworth-Heinemann, Cambridge,
531
MA, USA, 2017; pp.853-897, ISBN 978-0-12-810433-0.
532
33. Longley P.G.; Yoakum, S.E. Risk and Emerging Practices. In The Architect’s handbook of professional practice,
533
15th ed.; Hayes, R.L., Klein, R.M., Eds.; John Wiley & Sons: Hoboken, NJ, USA, 2014; pp. 1021-1029, ISBN
534
978-1-118-30882-0.
535
34. Tollin, H.M. Green building risks: It’s not easy being green. Environ. Claim. J. 2011, 23, 199-213.
536
doi:10.1080/10406026.2011.593442.
537
35. Han, J.H.; Kim, S.S. Architectural professionals’ needs and preferences for sustainable building guidelines in
538
Korea. Sustainability, 2014, 6, 8379-8397. doi:10.3390/su6128379
539
36. https://goo.gl/forms/GLbBasdHNH9ZpF1A2 (accessed on 14 March 2018).
540
37. Hwang, B.G.; Shan, M.; Chi, S. An exploratory analysis of risks in green residential building construction
541
38. Hwang, B.G.; Zhu, L.; Ming, J.T.T. Factors affecting productivity in green building construction projects:
543
The case of Singapore. J. Manage. Eng. 2016, 33, 04016052. doi:10.1061/(ASCE)ME.1943-5479.0000499.
544
39. Ke, Y.; Wang, S.; Chan, A.P.C.; Cheung, E. Understanding the risks in China’s PPP projects: Ranking of
545
their probability and consequence. Eng. Constr. Archit. Manag. 2011, 18, 481-496.
546
doi.:10.1108/09699981111165176.
547
40. Zou, P.X.W.; Zhang, G.; Wang, J. Understanding the key risks in construction projects in China. Int. J. Proj.
548
Manag. 2007, 25, 601-614. doi:10.1016/j.ijproman.2007.03.001.
549
41. Hwang, B.G.; Ming, J.T.T. Productivity improvement strategies for green construction projects:
550
Performance comparison and critical factors. International. Journal of Sustainable Building Technology Urban
551
Development.2017, 8, 45-53. doi:10.12972/susb.20170004.
552
42. Huston, M.D. Sustainable building: Anticipate potential liability to manage risk. Available online:
553
https://www.mankogold.com/media/publication/98_legal-20080619.pdf (accessed on 14 March 2018).
554
43. AIA. D503-2013 Guide for Sustainable Projects. Available online: www.aia.org/sustainableprojectsguide
555
(accessed on 14 March 2018).
556
44. Moe, K. Integrated Design in Contemporary Architecture, 1st ed.; Princeton Architectural Press: New York,
557
NY, USA, 2008; pp. 6-9, ISBN 978-1-56898-745-3.
558
45. Kibert, C.J.; Sendzimer, J.; Guy, B. Construction ecology and metabolism: Natural system analogues for a
559
sustainable built environment. Construction Management and Economics. 2010, 18, 903-916.
560
doi:10.1080/014461900446867.
561
46. AIA California Council. Integration Project Delivery: An Updated Working Definition. Available online: