Research Article
Impact of Aerosol-Cloud Cycling on Aqueous
Secondary Organic Aerosol Formation
William G. Tsui 1, Joseph L. Woo 2 and V. Faye McNeill 1,*
1 Department of Chemical Engineering, Columbia University, New York, NY 10027
2 Department of Chemical and Biomolecular Engineering, Lafayette College, Easton PA 18042
* Correspondence: vfm2103@columbia.edu; Tel.: +1-212-854-2869
Abstract:
Chemical processing of organic material in aqueous atmospheric aerosols and cloudwater is
known to form secondary organic aerosols (SOA), although the extent to which each of these
processes contributes to total aerosol mass is unclear. In this study, we use GAMMA 5.0, a
photochemical box model with coupled gas and aqueous-phase chemistry, to consider the impact of
aqueous organic reactions in both aqueous aerosols and clouds on isoprene epoxydiol (IEPOX) SOA
over a range of pH for both aqueous phases, including cycling between cloud and aerosol within a
single simulation. Low-pH aqueous aerosol, in the absence of organic coatings or other morphology
which may limit uptake of IEPOX, is found to be an efficient source of IEPOX SOA, consistent with
previous work. Cloudwater at pH 4 or lower is also found to be a potentially significant source of
IEPOX SOA. This phenomenon is primarily attributed to the relatively high uptake of IEPOX to
clouds as a result of higher water content in clouds as compared to aerosol. For more acidic
cloudwater, the aqueous organic material is comprised primarily of IEPOX SOA and lower-volatility
organic acids. For both cloudwater and aqueous aerosol, pH is the most significant factor considered
in this study in determining the mass of aqueous phase organic acids and IEPOX SOA. Other factors,
such as the time of day or sequence of aerosol-to-cloud or cloud-to-aerosol transitions, contribute to
less than 15% difference in the final aqSOA fractional composition. The potential significance of cloud
processing as a contributor to IEPOX SOA production could account for discrepancies between
predicted IEPOX SOA mass from atmospheric models and measured ambient IEPOX SOA mass, or
observations of IEPOX SOA in locations where mass transfer limitations are expected in aerosol
particles.
Keywords: secondary organic aerosol; isoprene epoxydiol; aqueous aerosol; cloudwater
1. Introduction
Aerosols are known to affect human health, air quality, and climate and are ubiquitous in the
atmosphere. They can also act as condensation nuclei to form cloud droplets, and evaporation of
liquid water from the cloud droplets allows for cycling between cloud droplets and aqueous aerosols
[1–4]. Cycling between these two aqueous regimes can occur on timescales of seconds to minutes,
significantly shorter than the typical lifetime of aerosols, which is roughly one week [5,6]. Although
the composition of aqueous aerosols can vary considerably, liquid water and aqueous organic
material are a significant portion of atmospheric aerosol mass [7–9], and much of the aqueous-phase
organic material that comprises aerosols is known to be secondary. The cycling between aqueous
aerosols and cloudwater provides two different aqueous environments in which aqueous secondary
organic aerosol material (aqSOA) can form [10,11]. Since both environments are aqueous, the same
chemical processes occur in both. However, different processes are dominant due to the difference in
water content and therefore dilution of nonvolatile components, with aqueous aerosols having less
water content per volume of air than cloudwater where clouds are present [12]. For example,
relatively lower water content and generally lower pH are typical of aqueous aerosols, and high
(non-photochemical) reactions, such as acid-catalyzed accretion reactions and organosulfate formation,
being more dominant in aerosol water than in cloudwater [8]. Typical cloudwater pH can range
between 3-6, as measured at the Whiteface Mountain Field Station summit observatory in
Wilmington, NY, USA [13,14], whereas aerosol particles tend to be considerably more acidic [15].
Isoprene is the most abundant nonmethane hydrocarbon gas in the atmosphere and a major
source of aqSOA [16–18]. One of the most significant pathways of aqSOA formation from isoprene is
through the gas-phase photo-oxidation of isoprene to form isoprene epoxydiols (IEPOX) [19,20].
IEPOX SOA, which in part consists of tetrols and organosulfates, is formed via the acid-catalyzed
ring-opening of the epoxide followed by nucleophilic addition of water or anions (e.g., HSO4-). In
laboratory studies, IEPOX SOA has been found to form most efficiently at low pH as a result of the
acid-catalyzed ring-opening step. The low pH and high nucleophile concentrations in aqueous
aerosol provide a favorable environment for IEPOX SOA formation [21]. However a number of
scenarios which are believed to be common for aqueous aerosols, such as organic coatings,
liquid-liquid phase separation or low-viscosity aerosols [22–29], are known to result in mass transfer
limitations which inhibit uptake of IEPOX into aqueous aerosols, limiting subsequent IEPOX SOA
formation. Despite this, IEPOX SOA is observed ubiquitously in the environment [19,20,29,30]. It is
therefore possible that cloudwater may be a greater source of IEPOX SOA than previously believed
[8]. Although the lower acidity and sulfate concentrations of cloudwater would make the rate of
IEPOX SOA formation in cloudwater lower than in aqueous aerosol, other factors, such as high liquid
water content and lack of organic coating- or viscosity-based mass transfer limitations, may promote
Currently, some regionals models cannot accurately predict atmospheric aqueous organic
material due to uncertainties in SOA production despite the availability of detailed chemical models
representative of atmospheric processes [3,7,33]. Such discrepancies between models and observed
measurements may be attributed, in part, to the lack of consideration of the cycling between
cloudwater and aqueous aerosol in the models. Although several models have shown that SOA
formation does occur in cloudwater, the extent to which SOA is produced as compared to formation
in aqueous aerosol is unclear since very few models represent both processes [8,34–37]. In this work,
we aim to compare IEPOX SOA production in both cloudwater and aqueous aerosols while
considering the cycling that can occur between the two phases upon evaporation or condensation of
water. We used a recently updated version of GAMMA (Gas-Aerosol Model for Mechanism
Analysis), a photochemical box model developed by the McNeill group, to quantify IEPOX SOA
formation. We previously used GAMMA and a related model, simpleGAMMA, for predicting IEPOX
SOA in aqueous aerosols, and the results were in good agreement with ambient measurements
[21,38–41]. The recent update to GAMMA includes uptake of IEPOX and subsequent formation of
SOA in cloudwater, allowing for the direct comparison of the efficiency of IEPOX SOA formation in
both aqueous environments, and captures the coupled effect of the two modes of processing in a
single simulation.
2. Methods
In this study, all simulations are based on conditions taken from ambient measurements at
Whiteface Mountain and performed in GAMMA, as described in the following sections [13].
GAMMA is a photochemical box model developed by the McNeill group, which includes gas
phase and aqueous phase species of organic material. The reactions and tracked species in GAMMA
are summarized and discussed by McNeill et al. (2012) [21]. The evolution of each species is
represented by
𝑑𝑃𝑖
𝑑𝑡 = −𝑘𝑚𝑡,𝑖𝑎𝐿𝑃𝑖+ 𝑘𝑚𝑡,𝑖𝑎𝐿
𝐻𝑖∗
𝐶𝑖+ ∑ 𝑟𝑖𝑗,𝑔𝑎𝑠+ 𝐸𝑖− 𝐷𝑖 (1) 𝑗
𝑑𝐶𝑖
𝑑𝑡 =
𝑘𝑚𝑡,𝑖
𝐑𝑇 𝑃𝑖− 𝑘𝑚𝑡,𝑖
𝐻𝑖∗𝐑𝑇𝐶𝑖+ ∑ 𝑟𝑖𝑗,𝑎𝑞 (2) 𝑗
where Piis the concentration of species i in the gas phase, Ci is the concentration of species i in the
aqueous phase, kmt,iis the gas-aqueous phase mass transfer coefficient, aLis the aqueous aerosol liquid
volume fraction, Hi* is the effective Henry’s Law constant, Ei is the emission rate, Di is the deposition
rate, R is the gas constant, T is temperature, and rij,gas and rij,aq are the gas and aqueous phase reactions
of species i respectively [42]. As seen in Equations 1 and 2, the gas and aqueous phases of a species i
are coupled in GAMMA by the mass transfer terms. In GAMMA 5.0, these equations represent the
temporal evolution of aqueous species in both aerosol and cloudwater and mass transfer of gas phase
species to and from aerosol and cloudwater. More detailed information regarding GAMMA,
including Henry’s constants used and equations calculating uptake of gas-phase species, can be
found in previous work using older versions of GAMMA [21,43].
For transitions between cloudwater and aqueous aerosols, a unitless scaling factor, fw, is
calculated as the ratio of the liquid water fraction in cloudwater to the liquid water fraction in
aqueous aerosol. This factor is assumed to be 5.9 × 10⁴ for this study, determined from ambient
measurements for cloudwater and from E-AIM model II, a thermodynamic model which can
liquid water fraction is assumed to be constant except at these transitions. When transitioning from
aqueous aerosol to cloudwater, all condensed phase species concentrations are scaled by a factor of
fw-1, except for water, which is set to 55.5 mol L-1. When transitioning from cloudwater to aqueous
aerosol, concentrations of condensed phase species, except water, are instead scaled by a factor of fw.
The water concentration and relative humidity are set back to the initial conditions determined from
E-AIM. The aerosol particle radius is set back to the initial radius, specified as 48 nm for this work,
as all simulations in this study start with aqueous aerosols before cycling. Both transitions are treated
as instantaneous by GAMMA, and chemistry of evaporation, other than that due to dilution and
concentration, is not considered. Conditions that differ for aqueous aerosol and cloudwater are
summarized in Table 1. All conditions shown in this table are specified for this work and can be
changed based on the aqueous system of interest, except for the water concentration and relative
humidity for cloudwater.
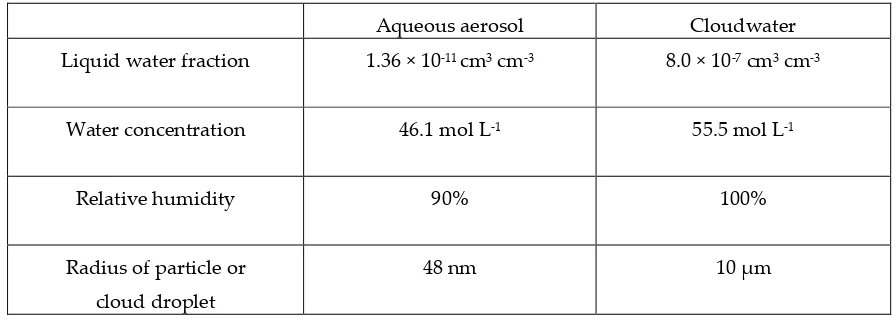
Table 1. Difference in conditions for aqueous aerosol mode and cloudwater mode for this study in
GAMMA 5.0
Aqueous aerosol Cloudwater
Liquid water fraction 1.36 × 10⁻¹¹ cm3 cm-3 8.0 × 10⁻⁷ cm3 cm-3
Water concentration 46.1 mol L-1 55.5 mol L-1
Relative humidity 90% 100%
Radius of particle or
cloud droplet
48 nm 10 μm
Aqueous processing of IEPOX is represented in GAMMA as a branching reaction with
[32], the branching ratio of 0.4 at highest measured acidity is used for IEPOX OS for each GAMMA
simulation. Additionally, 36% of the tetrols of IEPOX SOA is assumed to partition to the gas phase,
by taking an average of measured ambient data points from previous studies of volatility of these
species [46]. IEPOX OS is assumed to be nonvolatile, and as such serves as a proxy for other potential
low-volatility species such as IEPOX OS oligomers [28]. An effective Henry’s Law constant of 3 × 10⁷
mol L-1 atm-1 is used forIEPOX partitioning to the aqueous phase, based on GAMMA simulations of
the laboratory data of Nguyen et al. (2014) [31]. The formation of IEPOX SOA is dependent on pH
and sulfate concentration, both of which change during the aerosol-cloudwater cycling as previously
described [32,39]. Note that no mass transfer limitations are considered for the aerosol calculations,
making our calculations of IEPOX SOA formation during the aerosol portion of the aerosol-cloud
cycle an upper bound.
2.2. Simulation conditions
Initial conditions are based on published conditions for Whiteface Mountain, including initial
conditions for gas phase concentrations, temperature, pressure, and humidity summarized in Table
S1 and Table S2 [13]. Initial conditions for aqueous phase inorganic ion concentrations are determined
using E-AIM and the assumed initial aerosol pH. Each simulation was 12 hours long, from 6 AM to
6 PM. However, the times at which the aqueous aerosol and the cloudwater phases are present vary
between runs. In the first set of simulations, aqueous aerosols are present in the first six hours and
cloudwater is present in the final six hours, with the transition between the two occurring at 12 PM.
In the second set of simulations, aqueous aerosols are present in the first three hours and the last
consider cycling from cloudwater back to aqueous aerosol. The times at which GAMMA is in
cloudwater mode for these two sets of simulations is shown in Figure 1. In each set of simulations,
pH was varied between subsequent runs from 1 to 4 for aqueous aerosols and 3 to 6 for cloudwater,
which includes typical ranges for each, but set constant within each throughout the duration of each
aerosol or cloudwater phase [8,21,36,47,48]. Photolysis rates for Whiteface Mountain are determined
from Troposphere Ultraviolet and Visible (TUV) radiation model version 5.3 and are assumed to be
the same throughout the cloud parcel. These rates were updated for each minute of the GAMMA
simulations.
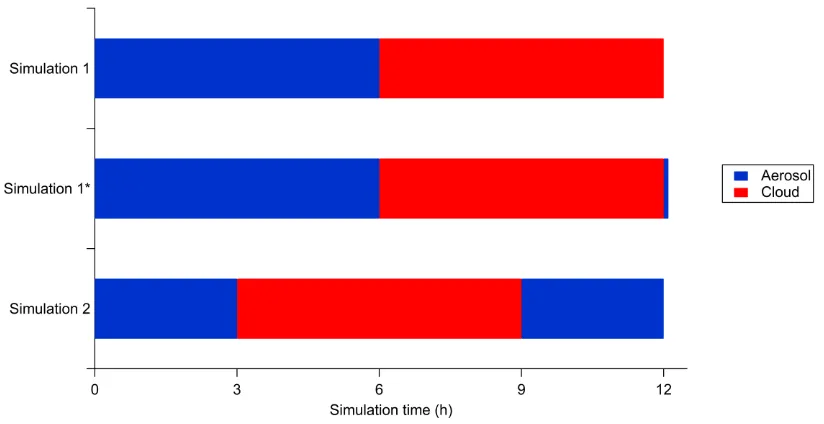
Figure 1. Times at which GAMMA is in each aqueous mode for the three sets of simulations
considered in this work.
Simulation 1 ends with the condensed phase as cloudwater while Simulation 2 ends with the
condensed phase as aqueous aerosol. The difference in aqueous environments results in difficulty in
comparing the final concentrations after 12 hours of simulation, due to the revolatilization of some
semivolatile organics that occurs upon transition from the cloud to the aerosol. For this reason,
on to the end of Simulation 1. The condensed phase transitions from cloudwater to aqueous aerosol
in that additional minute, similar to the 3 PM transition in Simulation 2, such that the two aqueous
aerosol phases at the end of simulations 1* and 2 are more easily compared.
3. Results
Concentrations of aqueous phase species throughout the 12 hours for all simulations are
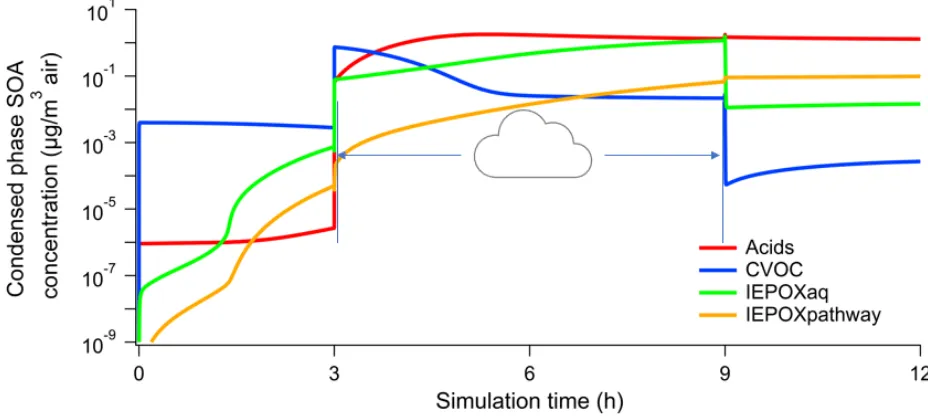
compared for different aerosol and cloud pH. Figure 2 shows the aqueous phase organic acids,
carbonyl-containing VOCs (CVOCs), IEPOX (labelled IEPOXaq), and IEPOX SOA (labelled
IEPOXpathway) for a Simulation 1 run with aerosol pH 1 and cloud pH 4. Organic acids include
glyoxylic acid, oxalic acid, pyruvic acid, acetic acid, formic acid, glycolic acid, succinic acid, and
malonic acid and their ionized forms. CVOCs include glyoxal, methylglyoxal, glycolaldehyde, and
other aldehydes.
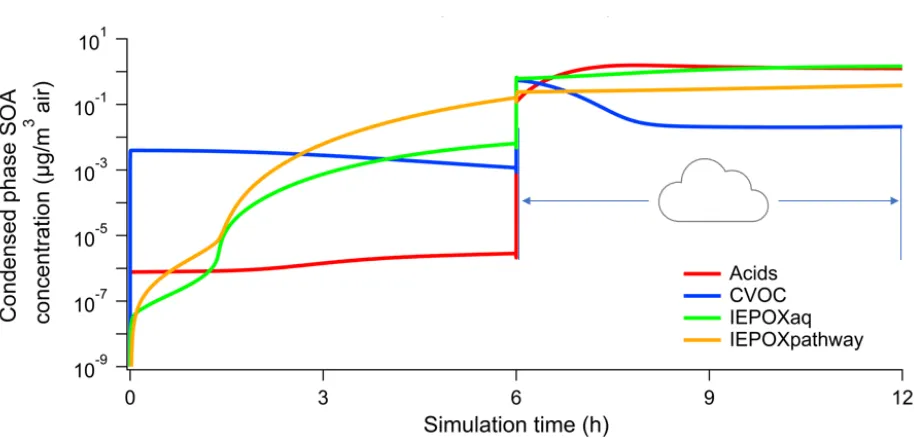
Figure 2. Organic acids, CVOCs, IEPOX, and IEPOX SOA mass concentrations in Simulation 1 with
aerosol pH 1 and cloud pH 4
IEPOX and organic acids need to form in the gas phase prior to partitioning to the aerosol phase,
After six hours of photochemistry in the gas and aqueous aerosol phases, IEPOX SOA largely
dominates, consistent with previous studies [21,38]. However, there is a sharp increase in the mass
of volatile species in the aqueous phase per volume of air following the transition to cloudwater.
Since the liquid water fraction for cloudwater is approximately 104 times greater than for aqueous
aerosol in this work, aqueous phase concentrations are diluted by this factor, fw, as well, creating a
large concentration gradient for mass transfer into the condensed phase. This behavior is observed
for both Simulations 1 and 2 at every pH considered. After one hour of cloudwater processing,
organic acids are the most abundant species of these four groups, also as expected due to the greater
availability of oxidants in cloudwater [8]. However, IEPOX SOA concentrations continue to increase
as well, due in part to gas-phase isoprene emissions that persist throughout the day.
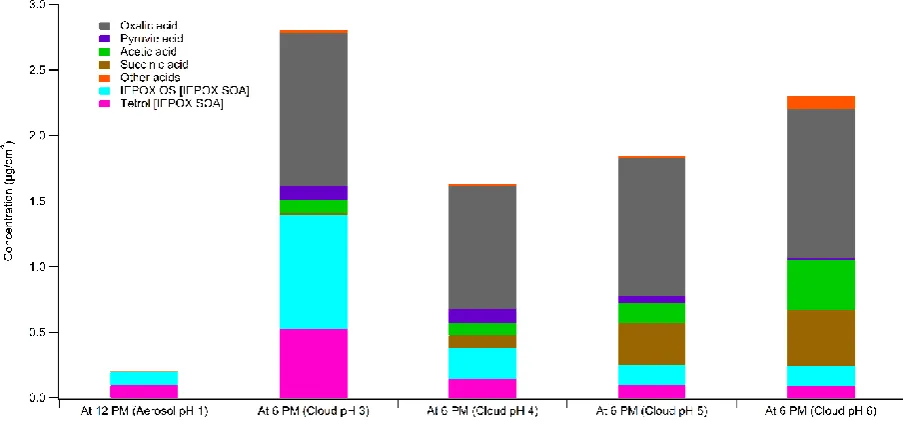
Due to the known dependence of IEPOX SOA formation on pH, varying cloud pH in the second
half of Simulation 1 is considered and shown in Figure 3. In this figure, only IEPOX SOA and organic
acids are compared since they are found to be the most abundant organic species besides IEPOX as
observed in Figure 2. The concentrations of these species are plotted after the first six hours of the
simulation (aqueous aerosol processing), and the organic mass is found to be 99% IEPOX SOA for
aerosols of pH 1. After the initial aqueous aerosol processing, the figure shows four separate cases of
cloud processing for the next six hours of the simulation, at cloudwater pH ranging from 3 to 6.
Although there is some IEPOX SOA formation at cloud pH 5 and 6, due to the acid catalysis
requirement of the IEPOX SOA mechanism it is more limited than the production of organic acids
via the oxidation of CVOCs. However, for more acidic cloudwater, IEPOX SOA formation increases
until it makes up almost 50% of aqSOA at the completion of the simulation, for cloudwater pH 3.
of simulation was formed during the first six hours of the simulation (i.e. in the aqueous aerosol
phase), suggesting the significance of cloudwater processes for IEPOX SOA formation.
Figure 3. Organic acids and IEPOX SOA in the aqueous phase in Simulation 1 with aerosol pH 1
and cloud pH 3 – 6. The graphs for cloud pH 3 – 6 indicate composition at the end of the simulation
at 6 PM. Concentrations are given in mass per volume of air parcel.
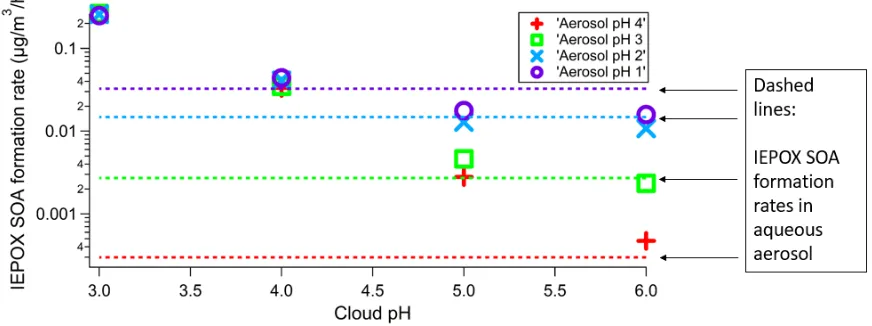
In comparing IEPOX SOA formation at various pH for Simulation 1, the average formation rates
at each pH for both aqueous aerosol and cloudwater were calculated. These results are plotted in
Figure 4. As expected due to the role of acid catalysis in aqueous-phase processing of IEPOX,
increasing pH in all cases for both cloudwater and aqueous aerosol while keeping the other constant
results in a slower rate of IEPOX SOA formation [19]. Additionally, for cloud pH 5 and 6, the
formation rates in cloudwater for every case are less than that of aerosol pH 1, consistent with
previous analysis [8]. However, this trend changes when cloud pH is reduced to 4, where formation
of IEPOX SOA in cloudwater at all pH is comparable to formation in aerosol pH 1. At cloud pH 3,
IEPOX SOA formation rates in cloudwater are approximately 10 times greater than in aerosol pH 1.
Thus, due to the relatively large liquid water content of clouds, cloudwater processing can be a
SOA formation in aqueous aerosols [21,22]. Although large IEPOX SOA production rates are
observed for cloudwater, it should be noted that the rates are taken as an average over the entire six
hours after cycling from aerosol. This includes the sharp increase due to rapid mass transfer of IEPOX
into the aqueous phase seen shortly after the six-hour point of the simulation. Since this sharp
increase does not occur again throughout the remainder of the six hours, the average formation rate
is skewed high due to the beginning of the six hours. If the cloudwater phase were to run for longer
than six hours, the average rate would decrease. On the other hand, aerosol-cloud cycling may occur
on shorter timescales [49,50], in which case this initial dilution effect would be more prominent. Even
a small amount of time of IEPOX processed in cloudwater can lead to considerable SOA growth.
Figure 4. Comparison of IEPOX SOA formation rates in Simulation 1 for aerosol pH 1 – 4 and cloud
pH 3 – 6. Rates are averaged over the entire six hours of the corresponding phase. Each individual
point corresponds to the IEPOX SOA formation rate in cloudwater in the second half of the
simulation with the pH of the aerosol in the first half of the simulation represented by the shape
and color of the point as described in the legend. The same colors are used in the horizontal dashed
lines corresponding to the formation in aqueous aerosols at the same pH in the first half of the
simulation.
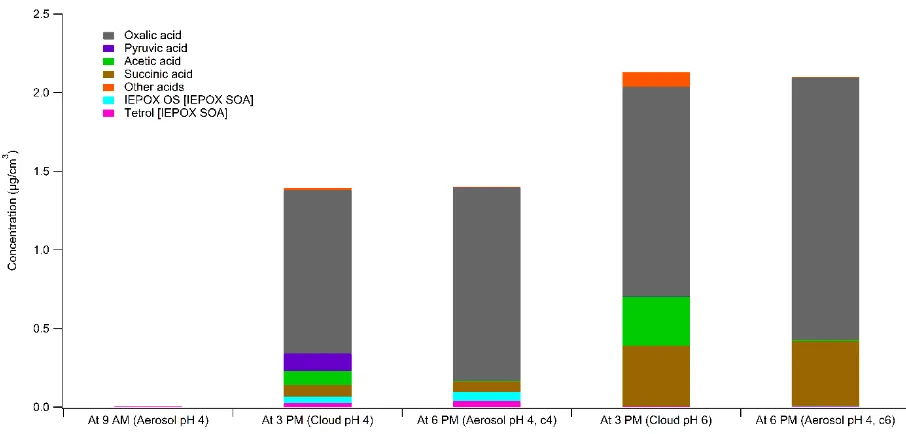
A similar analysis was performed for Simulation 2, where organic acids, CVOCs, IEPOX, and
IEPOX SOA concentrations were compared at aerosol-cloud transitions. Figure 5, which tracks these
transitioning to cloudwater, similar to Simulation 1. When cycling back to aqueous aerosol, a drop in
aqueous phase organic material is observed due to the decrease in water content in the aerosol,
creating a concentration gradient driving partitioning back to the gas phase. This drop is not observed
for all species due to varying volatilities of aqueous-phase organics. This is more clearly seen in
Figure 6, which shows the fraction of organic acids and IEPOX SOA for two cases of Simulation 2: (1)
aqueous aerosol processing at pH 4, cloudwater at pH 4, and aqueous aerosol again at pH 4; and (2)
aqueous aerosol processing at pH 4, cloudwater at pH 6, and aqueous aerosol again at pH 4. The
primary difference in composition between the initial and final composition of the aqueous aerosol
after cloudwater processing is the lack of more volatile acids, such as pyruvic acid, in the final
composition. The species that remain in the aqueous phase have higher Henry’s Law constants and
increases in concentration throughout the three hours of aqueous aerosol processing [21].
Figure 5. Organic acids, CVOCs, IEPOX, and IEPOX SOA mass concentrations in Simulation 2 with
Figure 6. Organic acids and IEPOX SOA in aqueous phase for Simulation 2 with aerosol pH 4 and
cloud pH 4 and 6. The two bars labeled c4 and c6 at 6 PM correspond to Simulation 2 with cloud
pH 4 and 6 respectively, as the starting and ending aerosol pH are the same while the intermediate
cloud pH differs. Concentrations are given in mass per volume of air parcel.
For Simulation 2, cloud pH is observed to be the most important variable for IEPOX SOA
formation. After three hours of aqueous aerosol processing, IEPOX SOA is more abundant than
organic acids, as seen in Figure 6. However, the total aqSOA mass is 5.25 × 10⁻⁵ μg m-3, which is
insignificant relative to a mass of 1.39 μg m-3 and 2.13 μg m-3 after cloudwater processing for cloud
pH 4 and 6 respectively. This is due to the high aerosol pH, which is not favorable for IEPOX SOA
formation. Meanwhile, the same pH for cloudwater is sufficient for some IEPOX SOA formation,
though organic acid formation is still more dominant.
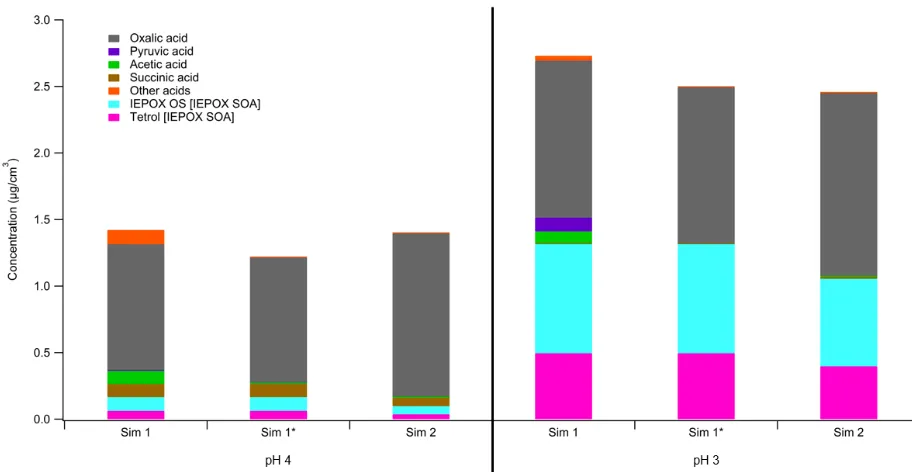
The final mass fractions of IEPOX SOA and organic acids for simulations 1, 1*, and 2 are shown
in Figure 7. As previously noted, the end of Simulation 1 has most of the acids produced in
cloudwater still in the aqueous phase, largely due to the relatively high water content in cloudwater.
However, extending the simulation by one minute to cycle back to aqueous aerosol is sufficient for
acid, and IEPOX SOA in the aqueous phase. Furthermore, comparing the final mass fractions in
simulations 1* and 2, the masses of these less volatile species are similar as well, with less than 15%
difference in composition, despite the difference in times specified for cloud times. This difference
can be attributed to several factors. Although isoprene emissions are assumed to be constant
throughout the duration of this daytime-only simulation, the different times specified for aqueous
aerosol and cloudwater results in the extent of partitioning to differ throughout the day. As more
isoprene has been emitted cumulatively towards later times in the day, this may result in a greater
accumulation of isoprene oxidation products when the liquid water fraction of the aqueous phase is
lower later in the day, ultimately resulting in variations in IEPOX SOA formation. Another factor
attributing to the difference in simulations 1* and 2 is the variation of photolysis rates throughout the
day. Photolysis rates are highest at solar noon. This is optimal for organic acid formation and
gas-phase IEPOX formation since the availability of oxidants drives both processes. Thus, cloudwater at
this time of day would produce more organic acids, corresponding to Simulation 2, which notably
has greater total organic acid mass than both simulations 1 and 1*. Nonetheless, the differences
between the conditions of these simulations only contribute to a minor difference in final composition.
As seen in Figure 7, pH has a much larger effect on composition than the times of day and sequence,
Figure 7. Mass of aqueous phase organic acids and IEPOX SOA at the end of simulations 1, 1*, and
2 for pH 3 and 4.
5. Conclusions
The results of this work indicate that aqueous-phase chemistry in clouds may be a more
significant source of IEPOX SOA than previously believed. Production in cloudwater could account
for the discrepancy between the expected efficiency of uptake of IEPOX to aqueous aerosols, given
mass transfer considerations, and the ubiquity of ambient IEPOX SOA. Since no aerosol-phase mass
transfer limitations were considered in our simulations, our calculations of IEPOX SOA formation in
aerosol water can be considered an upper bound.
Due to a lack of observations of IEPOX SOA tracers in cloudwater and the high variability of
liquid water content and pH in both the aerosol and cloud phases, the percentage of IEPOX SOA
produced in cloudwater and aqueous aerosol remains unclear [11,36,51]. The observed lack of
correlation between SOA mass and several aerosol properties, including liquid water content and pH,
large contribution to total SOA mass, cloudwater and its efficiency in producing IEPOX SOA and
other SOA should be considered when quantifying sources of organic aerosol.
Supplementary Materials: The following are available online at www.mdpi.com/xxx/s1, Table S1: Cloudwater simulation conditions, Table S2: Gas phase initial number concentrations specified in GAMMA
Author Contributions: V.F.M., J.L.W. and W.G.T. contributed to the GAMMA code. W.G.T. conducted the simulations discussed in this study. W.G.T. was the main author of the manuscript and V.F.M. and J.L.W. contributed in the writing process. V.F.M. acquired the funding for this work and supervised the research.
Funding: This research was funded by the NSF-USA, grant number AGS-1546136.
Conflicts of Interest: The authors declare no conflict of interest.
References
1. Kanakidou, M.; Seinfeld, J.H.; Pandis, S.N.; Barnes, I.; Dentener, F.J.; Facchini, M.C.; Dingenen, R. Van;
Ervens, B.; Nenes, A.; Nielsen, C.J.; et al. Organic aerosol and global climate modelling: a review. Atmos.
Chem. Phys 2005, 5, 1053–1123.
2. Nguyen, T.K. V.; Zhang, Q.; Jimenez, J.L.; Pike, M.; Carlton, A.G. Liquid Water: Ubiquitous Contributor
to Aerosol Mass. Environ. Sci. Technol. Lett. 2016, 3, 257–263.
3. Jimenez, J.L.; Canagaratna, M.R.; Donahue, N.M.; Prévôt, A.S.H.; Zhang, Q.; Kroll, J.H.; DeCarlo, P.F.;
Allan, J.D.; Coe, H.; Ng, N.L.; et al. Evolution of Organic Aerosols in the Atmosphere. Science 2009, 326,
1525–1529.
4. de Gouw, J.A.; Jimenez, J.L. Organic Aerosols in the Earth’s Atmosphere. Environ. Sci. Technol. 2009, 43,
7614–7618.
5. Chuang, P.Y. Measurement of the timescale of hygroscopic growth for atmospheric aerosols. J. Geophys.
Res. Atmos. 2003, 108, 4282.
6. Jacob, D.J. Introduction to atmospheric chemistry; Princeton University Press, Princeton, New Jersey, USA,
1999
7. Hallquist, M.; Wenger, J.C.; Baltensperger, U.; Rudich, Y.; Simpson, D.; Claeys, M.; Dommen, J.; Donahue,
N.M.; George, C.; Goldstein, A.H.; et al. The formation, properties and impact of secondary organic
aerosol: current and emerging issues. Atmos. Chem. Phys. 2009, 9, 5155–5236.
8. McNeill, V.F. Aqueous Organic Chemistry in the Atmosphere: Sources and Chemical Processing of
Organic Aerosols. Environ. Sci. Technol. 2015, 49, 1237–1244.
9. Zhang, Q.; Jimenez, J.L.; Canagaratna, M.R.; Allan, J.D.; Coe, H.; Ulbrich, I.M.; Alfarra, M.R.; Takami, A.;
Middlebrook, A.M.; Sun, Y.L.; et al. Ubiquity and dominance of oxygenated species in organic aerosols
10. Herckes, P.; Valsaraj, K.T.; Collett, J.L. A review of observations of organic matter in fogs and clouds:
Origin, processing and fate. Atmos. Res. 2013, 132–133, 434–449.
11. Ervens, B.; Sorooshian, A.; Aldhaif, A.M.; Shingler, T.; Crosbie, E.; Ziemba, L.; Campuzano-Jost, P.;
Jimenez, J.L.; Wisthaler, A. Is there an aerosol signature of chemical cloud processing? Atmos. Chem. Phys
2018, 18, 16099–16119.
12. Seinfeld, J.H.; Pandis, S.N. Atmospheric Chemistry and Physics, 3rd Edition. John Wiley & Sons, Inc.,
Hoboken, New Jersey, USA. 2016.
13. Lance, S.; Barth, M.; Carlton, A.; Lance, S.; Barth, M.; Carlton, A. Multiphase Chemistry: Experimental
Design for Coordinated Measurement and Modeling Studies of Cloud Processing at a Mountaintop. Bull.
Am. Meteorol. Soc. 2017, 98, ES163–ES167.
14. Adirondack Lakes Survey Corporation - Whiteface Mountain Cloud Monitoring Available online:
http://www.adirondacklakessurvey.org/wfc.shtml.
15. Pye, H.O.T.; Nenes, A.; Alexander, B.; Ault, A.P.; Barth, M.; Clegg, S.; Collett Jr., J.L.; Fahey, K.M.;
Hennigan, C.J.; Herrmann, H.; et al. The State of Acidity in the Atmosphere: Particles and Clouds. Atmos.
Chem. Phys. Discuss. (in review) 2019
16. Henze, D.K.; Seinfeld, J.H. Global secondary organic aerosol from isoprene oxidation. Geophys. Res. Lett.
2006, 33, L09812.
17. Guenther, A.; Karl, T.; Harley, P.; Wiedinmyer, C.; Palmer, P.I.; Geron, C. Estimates of global terrestrial
isoprene emissions using MEGAN (Model of Emissions of Gases and Aerosols from Nature). Atmos.
Chem. Phys. 2006, 6, 3181–3210.
18. Carlton, A.G.; Wiedinmyer, C.; Kroll, J.H. A review of Secondary Organic Aerosol (SOA) formation from
isoprene. Atmos. Chem. Phys. 2009, 9, 4987-5005.
19. Surratt, J.D.; Lewandowski, M.; Offenberg, J.H.; Jaoui, M.; Kleindienst, T.E.; Edney, E.O.; Seinfeld, J.H.
Effect of acidity on secondary organic aerosol formation from isoprene. Environ. Sci. Technol. 2007, 41,
5363–5369.
20. Surratt, J.D.; Chan, A.W.H.; Eddingsaas, N.C.; Chan, M.; Loza, C.L.; Kwan, A.J.; Hersey, S.P.; Flagan,
R.C.; Wennberg, P.O.; Seinfeld, J.H. Reactive intermediates revealed in secondary organic aerosol
formation from isoprene. Proc. Natl. Acad. Sci. U. S. A. 2010, 107, 6640.
21. McNeill, V.F.; Woo, J.L.; Kim, D.D.; Schwier, A.N.; Wannell, N.J.; Sumner, A.J.; Barakat, J.M.
Aqueous-Phase Secondary Organic Aerosol and Organosulfate Formation in Atmospheric Aerosols: A Modeling
Study. Environ. Sci. Technol. 2012, 46, 8075–8081.
22. Gaston, C.J.; Riedel, T.P.; Zhang, Z.; Gold, A.; Surratt, J.D.; Thornton, J.A. Reactive Uptake of an
Isoprene-Derived Epoxydiol to Submicron Aerosol Particles. Environ. Sci. Technol. 2014, 48, 11178–11186.
K.W.; Budisulistiorini, S.H.; et al. On the implications of aerosol liquid water and phase separation for
organic aerosol mass. Atmos. Chem. Phys. 2017, 17, 343–369.
24. Schmedding, R.; Ma, M.; Zhang, Y.; Farrell, S.; Pye, H.O.T.; Chen, Y.; Wang, C. tsan; Rasool, Q.Z.;
Budisulistiorini, S.H.; Ault, A.P.; et al. α-Pinene-Derived organic coatings on acidic sulfate aerosol
impacts secondary organic aerosol formation from isoprene in a box model. Atmos. Environ. 2019, 213,
456–462.
25. Shiraiwa, M.; Berkemeier, T.; Schilling-Fahnestock, K.A.; Seinfeld, J.H.; Pöschl, U. Molecular corridors
and kinetic regimes in the multiphase chemical evolution of secondary organic aerosol. Atmos. Chem.
Phys 2014, 14, 8323–8341.
26. Song, M.; Liu, P.F.; Hanna, S.J.; Li, Y.J.; Martin, S.T.; Bertram, A.K. Relative humidity-dependent
viscosities of derived secondary organic material and atmospheric implications for
isoprene-dominant forests. Atmos. Chem. Phys. 2015, 15, 5145–5159.
27. Reid, J.P.; Bertram, A.K.; Topping, D.O.; Laskin, A.; Martin, S.T.; Petters, M.D.; Pope, F.D.; Rovelli, G.
The viscosity of atmospherically relevant organic particles. Nat. Commun. 2018, 9, 956.
28. D’ambro, E.L.; Schobesberger, S.; Gaston, C.J.; Lopez-Hilfiker, F.D.; Lee, B.H.; Liu, J.; Zelenyuk, A.; Bell,
D.; Cappa, C.D.; Helgestad, T.; et al. Chamber-based insights into the factors controlling epoxydiol
(IEPOX) secondary organic aerosol (SOA) yield, composition, and volatility. Atmos. Chem. Phys 2019, 19,
11253–11265.
29. Hu, W.; Palm, B.B.; Day, D.A.; Campuzano-Jost, P.; Krechmer, J.E.; Peng, Z.; de Sá, S.S.; Martin, S.T.;
Alexander, M.L.; Baumann, K.; et al. Volatility and lifetime against OH heterogeneous reaction of
ambient isoprene-epoxydiols-derived secondary organic aerosol (IEPOX-SOA). Atmos. Chem. Phys. 2016,
16, 11563–11580.
30. Hu, W.W.; Campuzano-Jost, P.; Palm, B.B.; Day, D.A.; Ortega, A.M.; Hayes, P.L.; Krechmer, J.E.; Chen,
Q.; Kuwata, M.; Liu, Y.J.; et al. Characterization of a real-time tracer for isoprene epoxydiols-derived
secondary organic aerosol (IEPOX-SOA) from aerosol mass spectrometer measurements. Atmos. Chem.
Phys. 2015, 15, 11807–11833.
31. Nguyen, T.B.; Coggon, M.M.; Bates, K.H.; Zhang, X.; Schwantes, R.H.; Schilling, K.A.; Loza, C.L.; Flagan,
R.C.; Wennberg, P.O.; Seinfeld, J.H. Organic aerosol formation from the reactive uptake of isoprene
epoxydiols (IEPOX) onto non-acidified inorganic seeds. Atmos. Chem. Phys. 2014, 14, 3497–3510.
32. Eddingsaas, N.C.; VanderVelde, D.G.; Wennberg, P.O. Kinetics and Products of the Acid-Catalyzed
Ring-Opening of Atmospherically Relevant Butyl Epoxy Alcohols. J. Phys. Chem. A 2010, 114, 8106–8113.
33. Heald, C.L.; Jacob, D.J.; Park, R.J.; Russell, L.M.; Huebert, B.J.; Seinfeld, J.H.; Liao, H.; Weber, R.J. A large
organic aerosol source in the free troposphere missing from current models. Geophys. Res. Lett. 2005, 32.
34. Blando, J.D.; Turpin, B.J. Secondary organic aerosol formation in cloud and fog droplets: a literature
35. Carlton, A.G.; Turpin, B.J.; Altieri, K.E.; Seitzinger, S.P.; Mathur, R.; Roselle, S.J.; Weber, R.J. CMAQ
Model Performance Enhanced When In-Cloud Secondary Organic Aerosol is Included: Comparisons of
Organic Carbon Predictions with Measurements. Environ. Sci. Technol. 2008, 42, 8798–8802.
36. Ervens, B.; Turpin, B.J.; Weber, R.J. Secondary organic aerosol formation in cloud droplets and aqueous
particles (aqSOA): a review of laboratory, field and model studies. Atmos. Chem. Phys 2011, 11, 11069–
11102.
37. Ervens, B. Modeling the Processing of Aerosol and Trace Gases in Clouds and Fogs. Chem. Rev. 2015,
115, 4157–4198.
38. Woo, J.L.; McNeill, V.F. simpleGAMMA v1.0 – a reduced model of secondary organic aerosol formation
in the aqueous aerosol phase (aaSOA). Geosci. Model Dev. 2015, 8, 1821–1829.
39. Budisulistiorini, S.H.; Nenes, A.; Carlton, A.G.; Surratt, J.D.; McNeill, V.F.; Pye, H.O.T. Simulating
Aqueous-Phase Isoprene-Epoxydiol (IEPOX) Secondary Organic Aerosol Production During the 2013
Southern Oxidant and Aerosol Study (SOAS). Environ. Sci. Technol. 2017, 51, 5026–5034.
40. Budisulistiorini, S.H.; Li, X.; Bairai, S.T.; Renfro, J.; Liu, Y.; Liu, Y.J.; Mckinney, K.A.; Martin, S.T.; Mcneill,
V.F.; Pye, H.O.T.; et al. Examining the effects of anthropogenic emissions on isoprene-derived secondary
organic aerosol formation during the 2013 Southern Oxidant and Aerosol Study (SOAS) at the Look
Rock, Tennessee ground site. Atmos. Chem. Phys 2015, 15, 8871–8888.
41. Shrivastava, M.; Andreae, M.O.; Artaxo, P.; Barbosa, H.M.J.; Berg, L.K.; Brito, J.; Ching, J.; Easter, R.C.;
Fan, J.; Fast, J.D.; et al. Urban pollution greatly enhances formation of natural aerosols over the Amazon
rainforest. Nat. Commun. 2019, 10, 1–12.
42. Schwartz, S.E. Mass-transport considerations pertinent to aqueous phase reactions of gases in
liquid-water clouds. In NATO ASI Series, Vol. G6; Jaeschke, W., Ed.; Springer-Verlag: Berlin Heidelberg, 1986;
pp. 425–471.
43. Tsui, W.G.; Rao, Y.; Dai, H.-L.; McNeill, V.F. Modeling Photosensitized Secondary Organic Aerosol
Formation in Laboratory and Ambient Aerosols. Environ. Sci. Technol. 2017, 51, 7496–7501.
44. Clegg, S.L.; Brimblecombe, P.; Wexler, A.S. Thermodynamic Model of the System H + -NH 4 + -SO 4
2--NO 3 --H 2 O at Tropospheric Temperatures. J. Phys. Chem. A 1998, 102, 2137–2154.
45. Clegg, S.L.; Seinfeld, J.H.; Brimblecombe, P. Thermodynamic modelling of aqueous aerosols containing
electrolytes and dissolved organic compounds. J. Aerosol Sci. 2001, 32, 713–738.
46. Isaacman-VanWertz, G.; Yee, L.D.; Kreisberg, N.M.; Wernis, R.; Moss, J.A.; Hering, S. V.; de Sá, S.S.;
Martin, S.T.; Alexander, M.L.; Palm, B.B.; et al. Ambient Gas-Particle Partitioning of Tracers for Biogenic
Oxidation. Environ. Sci. Technol. 2016, 50, 9952–9962.
47. Anastasio, C.; Faust, B.C.; Rao, C.J. Aromatic carbonyl compounds as aqueous-phase photochemical
sources of hydrogen peroxide in acidic sulfate aerosols, fogs, and clouds. 1. Non- phenolic
1997, 31, 218–232.
48. Weber, R.J.; Guo, H.; Russell, A.G.; Nenes, A. High aerosol acidity despite declining atmospheric sulfate
concentrations over the past 15 years. Nat. Geosci. 2016, 9, 282–285.
49. Xue, H.; Feingold, G.; Xue, H.; Feingold, G. Large-Eddy Simulations of Trade Wind Cumuli:
Investigation of Aerosol Indirect Effects. J. Atmos. Sci. 2006, 63, 1605–1622.
50. Feingold, G.; McComiskey, A.; Rosenfeld, D.; Sorooshian, A. On the relationship between cloud contact
time and precipitation susceptibility to aerosol. J. Geophys. Res. Atmos. 2013, 118, 10,544-10,554.
51. Sareen, N.; Waxman, E.M.; Turpin, B.J.; Volkamer, R.; Carlton, A.G. Potential of aerosol liquid water to
facilitate organic aerosol formation: assessing knowledge gaps about precursors and partitioning.
Environ. Sci. Technol. 2017, 51, 3327–3335.
52. Xu, L.; Guo, H.; Boyd, C.M.; Klein, M.; Bougiatioti, A.; Cerully, K.M.; Hite, J.R.; Isaacman-VanWertz, G.;
Kreisberg, N.M.; Knote, C.; et al. Effects of anthropogenic emissions on aerosol formation from isoprene