POWELL, ELIZABETH ERIN M.S. An Analysis of Project Management Methodology as Applied to Demand Forecasting Software Implementation within a Leading Apparel
Corporation. (Under the direction of Dr. Nancy L. Cassill and Dr. Jeffrey A. Joines.)
The purpose of this study was to identify formal project management methodology as well as to investigate a forecasting software implementation project. As companies face challenges of improving supply chain performance and creating cost effective business strategies, projects emerge for process improvement. Formal project management has developed to successfully guide and complete projects of any kind on time and on budget, but also to incorporate change management for thorough alignment. The Project
Management Institute’s methodology provided the conceptual framework for this study. A sample of one software implementation project from a division of an industry-leading apparel manufacturing and marketing corporation was examined. Using a case study approach, project team members were interviewed via an email questionnaire. Respondents were asked to identify and explain the components of formal project management that were developed and used during the software project.
AN ANALYSIS OF PROJECT MANAGEMENT METHODOLOGY AS APPLIED TO DEMAND FORECASTING SOFTWARE IMPLEMENTATION WITHIN A
LEADING APPAREL CORPORATION
by
ELIZABETH ERIN POWELL
A thesis submitted to the Graduate Faculty of North Carolina State University
in partial fulfillment of the requirements for the Degree of Master of Science
TEXTILE TECHNOLOGY AND MANAGEMENT
Raleigh
2004
APPROVED BY:
_____________________________________________ Dr. Nancy L. Cassill, Co-Chair of Advisory Committee
_____________________________________________ Dr. Jeffrey A. Joines, Co-Chair of Advisory Committee
_____________________________________________ Dr. Robert Handfield
BIOGRAPHY
The author, Erin Powell was born in Raleigh, NC on April 10, 1980 to M.A. “Kim” and Rori Powell. She has one younger brother, Sam.
Erin grew up in Bonsal, NC and graduated from Northwood High School in Pittsboro, NC in 1998. She received her Bachelor of Science degree from North Carolina State
University in Textile Technology with a concentration in Polymer Chemistry in 2002. She was then accepted into the graduate school at NCSU to earn a master’s degree in Textile Technology and Management from the College of Textiles with a minor in Business Management from the College of Management. She is currently completing the
TABLE OF CONTENTS
LIST OF FIGURES ...v
LIST OF TABLES ...vi
1.0 CHAPTER I - INTRODUCTION ...1
1.1 INTRODUCTION ... 1
1.2 PURPOSE ... 2
1.3 RESEARCH OBJECTIVES ... 3
1.4 SIGNIFICANCE OF THE STUDY... 4
1.5 LIMITATIONS OF THE STUDY... 5
2.0 CHAPTER 2 - REVIEW OF LITERATURE...6
2.1 GLOBAL APPAREL INDUSTRY ... 6
2.2 SUPPLY CHAIN MANAGEMENT ... 9
2.3 PROJECT MANAGEM ENT... 11
2.3.1 Definitions ... 11
2.3.2 Historical Development ... 13
3.3.3 Technology Advancement ... 13
3.3.4 Project Management Methodology/Framework ... 14
2.3.5 Roles/Responsibilities of Stakeholders ... 28
2.3.6 Change Management ... 31
2.3.7 Success Factors and Evaluation... 34
2.3.8 Macro/Micro Influences upon Project Management ... 37
2.3.9 New Ideas for Project Management... 38
2.4 FORECASTING ... 39
2.4.1 Historical Development ... 39
2.4.2 Methodology ... 40
2.4.2.1 Statistical/Judgmental Methodology... 40
2.4.3 Forecast Accuracy... 50
2.4.4 IT Innovations – New Forecasting Methodology ... 51
3.0 Chapter 3 - Research Methodology ...52
3.1 RESEARCH OBJECTIVES ... 52
3.2 RESEARCH DESIGN ... 53
3.3 INSTRUMENT DEVELOPMENT ... 53
3.4 SAMPLE SELECTION ... 55
3.5 DATA COLLECTION ... 56
3.6 DATA ANALYSIS... 57
4.0 CHAPTER 4 - RESULTS ...58
4.1 SAMPLE DESCRIPTION... 58
4.2 RESULTS ... 58
5.0 Chapter 5 - Conclusions and Recommendations ...78
5.1 SUMMARY... 78
5.2 CONCLUSIONS... 83
5.3 RECOMMENDATIONS... 84
5.4 FUTURE WORK ... 86
REFERENCES ...87
SUPPLY CHAIN MANAGEM ENT ... 88
PROJECT MANAGEMENT... 88
CHANGE MANAGEMENT ... 91
FORECASTING ... 92
CPFR... 94
LIST OF FIGURES
LIST OF TABLES
Table 1. Collection of Project Management Definitions ...12
Table 2. Mapping of Project Management Processes to the Process Groups and Knowledge Areas ...23
Table 3. Organizational Structure Influences on Projects...30
Table 4. Top Reasons for Problems ...35
Table 5 Results – Organizational Structure Influences on Projects...71
1.0 CHAPTER I - INTRODUCTION
1.1 INTRODUCTION
Competition within the apparel industry has grown more intense with increased global sourcing prospects. A company’s competitive strategy defines the set of customer needs that it seeks to satisfy through its products and services (Chopin, 2001). Alternative business strategies evolve through this examination in order to remain competitive. The make or buy decision becomes exposed as an obvious business opportunity by finding the optimal combination of global sourcing and “in house” and/or vertically integrated
manufacturing. The product development strategy specifies the portfolio of new products that a company will try to develop and dictates whether the development effort will be made internally or outsourced (Chopin, 2001). Accurate business planning and product forecasting is critical in the equation to remain competitive. All supply chain design and planning decisions are based on a forecast of customer demand (Chopin, 2001).
An inaccurate, under-forecast presents the situation to chase popular apparel items. By the time demand is realized, the company must include lead times to procure additional raw materials and successfully increase manufacturing capacities in the decision to chase the product. The company is left with the decision to assume demand will still be present after these lead times, or realize a missed opportunity. Full-product sourcing does not bode well for chasing products, due to increased lead times.
An inaccurate, over-forecast creates excess, obsolescent inventory. There may not always be discount retail outlets for sales due to unique customer manufacturing
Technological advancements of the time have created formal business and supply chain planning software packages designed for large corporations. Among these is
forecasting software that creates a statistical baseline forecast that might be incorporated with judgmental elements to finalize a product forecast. This software has the capability to utilize extravagant quantities of data to potentially create more accurate forecasts. Popularity of software packages has grown for many reasons. One is that companies lack the internal resources and time to develop the software on their own (Lientz & Rea, 2002).
The implementation of a software package is not a simple undertaking, especially for a large, established corporation. Failure occurs often because of the faulty assumption where Management views these packages as a rapid fix to both business processes and systems, where you push the package and fit the process around it (Lientz & Rea, 2002). In most cases, this requires formal project management to be successful. In a survey conducted by KPMG Management Consulting in 1994, respondents were asked which of a range of remedies had been applied to “runaway projects.” Three of the top four were to apply additional time, money, and people. The second resolution behind additional time was to practice better project management procedures (Smith, 2001).
1.2 PURPOSE
improving customer service levels. New technology is a constant focus and software is continuously upgraded to offer the best opportunity to gain an advantage over the
competition. Oftentimes, several different vendors may have systems running together for various areas of one business, and all must work together harmoniously. Legacy systems within an established corporation also present a challenge with the introduction of new technology. The successful completion of improvement projects, and especially new software implementation is essential, but is rarely completed within original budget or time projections.
The United States corporation used in this case study has multiple business divisions. One of its manufacturing divisions is a forecast driven apparel supply chain. Historically, the forecasting department has not utilized formal forecasting software. The forecasting
accuracy was evaluated as lacking in performance and executive management issued mandatory improvement. A well known and industry leading forecasting software package was chosen for implementation in an effort to deliver increased forecast accuracy.
The implementation was not only a change for the forecasting department, but was also a drastic change for the overall division of the corporation. Formerly, senior
management mandated the final forecast according to corporate sales goals. With this new software implementation came a change in corporate culture to rely more on a realistic volume demand forecast.
1.3 RESEARCH OBJECTIVES
Project Management Framework was utilized and to assess the success of the project given this proven methodology. The specific objectives are to:
1. Identify and document the phases and participants of the forecasting software implementation project from beginning to end hereafter referred to as Software. 2. Understand organizational, behavioral, and systems restrictions and catalysts for each of the Software implementation phases and participants.
3. Develop a learning critique that determines the effectiveness of each phase of the project.
4. Establish recommendations for a repeatable process that companies with similar challenges may use for more efficient transition and successful implementation.
1.4 SIGNIFICANCE OF THE STUDY
The case study approach will provide greater insight for the corporation into the level of project management incorporated into their systems implementation project. Perspectives from project members can potentially be correlated to the success rate of the project.
1.5 LIMITATIONS OF THE STUDY
One limitation of the research is it focused solely upon one department in one division of one corporation. Initially it was to be an evaluation from two different business divisions, but only one replied. Evaluation of similar Software implementation projects across different corporations would provide greater basis for recommendations.
Generalizations may not be made for divisions within the corporation or for outside corporations, but will be specific to this project.
Research conducted relied on the memory of project participants. The sections of the data collection instrument that evaluated the degree of specific project management utilized attempted to filter bias results through questions not requiring opinion. However, memory recall may be influenced by opinion in other questionnaire sections. The project success rate at the time of the questionnaire completion may have also biased the answers of the
Respondents.
The questionnaire was distributed individually to company employees for the
forecasting division. These employees were hand picked and chosen from multiple business departments including Forecasting, Sales Planning, Supply Cha in, and Information
Technology. Not all Respondents were members of the project team, but eventually were affected by the Software implementation project.
2.0 CHAPTER 2 – REVIEW OF LITERATURE
2.1 GLOBAL APPAREL INDUSTRY
Mounting global tensions and continued economic decline raise questions about where to invest the next dollar. The global manufacturing, marketing, and retail environment must be ever more closely monitored. One steadfast clause is still that no matter how tough times get, the consumer is still going to eat, drink and get dressed (Mourtada, 2003). This is good news for the apparel industry.
“Think Globally, Act Locally” is the catch phrase of current competition. This is the practice of customizing product and services for regional consumption in accordance with the local languages, currency, culture, and regulatory climate (Miranda, 2003). There is a
to understand two moments of truths. One is the moment when the consumer opens the good and uses it at home. The second, which is actually the first moment of truth, is the moment when a consumer chooses a product in the store. The advice given by Coca-Cola Great Britain & Ireland president Tom Long is to spend less time in their offices and go out and meet the consumer. Another piece of advice is that as brands expand around the world, the idea of making the product relevant to the day is important. He disagrees with the concept of global vs. local and says that the question really is “why should I buy your products today” (Benady, 2003).
Gaining and then maintaining consumers through service is the goal of the retailer. Recently, the retailer has assumed greater responsibility for consumer satisfaction. It used to be that the manufacturer determined the needs of the consumer. Now, the retailer is no longer viewed as the intermediary between the manufacturer and the consumer, but is now much more responsible for consumer satisfaction. Therefore, the retailer will have greater interest and influence over its manufacturer (Dawson, 2000).
The balance of power among members of the supply chain is undergoing greater scrutiny in recent times. “A critical factor in channel relationships between manufacturers and retailers is the relative bargaining power of both parties. Greater retailer power promotes channel coordination. There are conditions in which the presence of a powerful retailer might actually be beneficial to all channel members” (Iyer & Villa-Boas, 2003, pg. 80).
relative to manufacturers of consumer products.” Research to determine the power of Wal-Mart was performed to determine whether the retail giant is wielding power in ways that hurt or help the financial fortunes of its suppliers. “The results show that Wal-Mart suppliers that hold a small share of their respective markets do not perform as well financially as small-share suppliers not identifying Wal- Mart as a primary customer. On the other hand, large-share suppliers to Wal-Mart perform better than their large-large-share counterparts. This indicates that there are opportunities for suppliers to become beneficiaries of Wal-Mart’s power, not just be victims of this power. Indeed, small- share suppliers may find it an attractive strategy to partner with Wal-Mart, to trade off initial financial suffering for the enjoyment of the fruits of the partnership later” (Bloom et al, 2001, pg.296).
A Japanese retailer striving to stay ahead of Wal-Mart’s move into Japan is moving aggressively to squeeze out the middleman, whereby persuading the supplier to discontinue dealing with wholesaler and deal with it directly (Zimmerman & Fackler, 2003). Remaining competition in any marketplace pushes the need for lean supply chain operations to achieve exceptional customer service. There is always an opportunity for improvement to reach that goal at each stage of the supply chain. A well-defined project is often the result of a
recognized needed improvement. Structured Project Management emerged as a solution for the most time and cost efficient results toward sustained and increased competitiveness. With constant push toward lean operations, supply chains and manufacturing “must do more with less” (Lientz & Rea, 2002).
2.2 SUPPLY CHAIN MANAGEMENT
The alignment of processes within an organization, taking a product from ideation to customer, includes all areas of what is known today as the supply chain. Supply chain
management has grown over the past decade into the best practices methodology for business management. As the world has become not only global in marketplace, but also presents global production opportunities, the realization of possible supply resources enhances the need for supply chain manage ment. According to Chopin (2001), the ultimate goal of every supply chain is to maximize the overall value generated. Therefore, closely managing every stage, directly or indirectly, that contributes to fulfilling a customer’s request meets the purpose of supply chain management (Chopin, 2001).
Supply chain performance evaluation is crucial for a company’s success.
increasing profit margins as well as customer satisfaction. Most likely upon evaluation, projects will emerge for supply chain improvement.
“Strategic fit requires that a company achieve a balance between responsiveness and efficiency in its supply chain that best meets the needs of the company’s competitive
strategy” (Chopin, 2001, pg 49). The four drivers of the supply chain, inventory, transportation, facilities, and information, must be examined to determine potential improvement areas. Information is potentially the biggest driver of performance in the supply chain as it directly affects each of the other drivers (Chopin, 2001).
“Project Management is a valuable skill for supply chain managers to have since more and more work is being structured as a project. Projects have certain characteristics that make them unique compared with other forms of work. A project is a series of tasks that require the completion of specific objectives within a certain time frame; has defined start and stop dates; consumes resources, particularly time, personnel, and budget; and operates with limited resources” (Monczka, Trent, and Handfield, 2002, pg. 375).
2.3 PROJECT MANAGEM ENT
2.3.1 Definitions
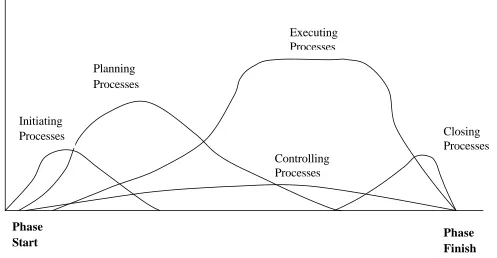
Table 1. Collection of Project Management Definitions
Concept Definition Source
Responsibility
“(Project Management is) the exercise of responsibility and decisio n- making about a project, the authority to execute within the boundaries of the project, and the accountability
to deliver the results of a project in the context of agreed- upon customer expectations, commitments, and constraints.”
(Mullaly, 2003, pg. 2) Basic Thought
Process
“Project management includes the application of simple, but not always obvious, rules of common sense to uncommon and complex situations, with deadlines and tight budgets.”
(Kimmons, 1990, pg. 5) Systems
Management
“Project management is the application of the systems approach to the management of technologically complex tasks or projects whose objectives are explicitly stated in terms of
the time, cost, and performance parameters.”
- Cleland and King (Kimmons, 1988, pg. 5) Commitment
for Results
“Establishing a committee is not project management. Just about everything that characterizes committees is prejudicial to good project management…A committee is oriented toward recommendations; a project is oriented to results…Appointing a project
manager is not, by itself, establishing a project.
- Martin (Kimmons,1
976, pg. 5) “The professional activity of designing, structuring, scheduling, organizing, managing and
2.3.2 Historical Development
“Managing projects is one of the oldest and most respected accomplishments of mankind. We stand in awe of the achievements of the builders of the pyramids, the architects of ancient cities, the masons and craftsmen of great cathedrals and mosques; of the might and labor behind the Great Wall of China and other wonders of the world” (Morris, 1994, pg.1). Project management dates back to the first engineering structures of the world and has evolved to include not only new technological advancements, but defined interactive roles of those that make it happen.
Other than aerospace, defense and construction, the majority of the companies in the 1960s maintained an informal method for managing projects. Through the 1970s and then the 1980s, more companies moved to more structured methodologies mostly due to the complexity of the projects (Rich, 2003).
3.3.3 Technology Advancement
New technology has opened unfathomable doors in the most recent decades. Continuous improvements demand that companies upgrade regularly to stay competitive. “Project management in the early 1990s was between a company and a contractor” (Kimmons, 1990, pg.15). Today, project management can include process improvement projects within a company. It will include the interaction of numerous company
employees and most likely an on-site contractor. In the case of information technology installations or upgrades, an employee of the software company will stay onsite
3.3.4 Project Management Methodology/Framework
The Project Management Institute (PMI) is currently the authority in the field of project management. It publishes the guide to the Project Management Book of Knowledge (PMBOK) and currently owns the rights to the Approved American National Standard (ANSI). There are more than 45,000 members in the Project Management Institute.
Early project management was seen as solely scheduling or as estimating and cost control of the work (Kimmons, 1994). PMI breaks down project management groups and knowledge areas. The knowledge areas are: integration management, scope management, time management, risk management, cost management, quality management, human resources management, communications management, and procurement management. The five project phases of the methodology and framework are: initiating, planning, controlling, executing, and closing. Just as there are many definitions of project management, there are various methodologies per each expert’s definition. By and large, they are simply unique twists to the generally accepted methodology.
all projects; the project team is always responsible for determining what is appropriate for any given project” (PMBOK Guide 2000, pg 7).
2.3.4.1 Project Phases
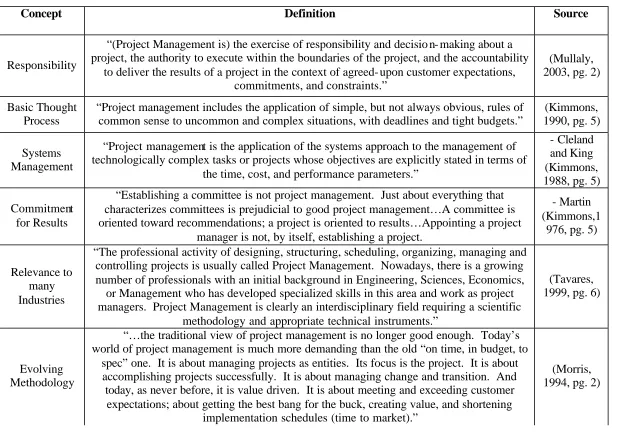
As shown below in Figure 1, “(P)rojects are generally divided into three major project phases as a means to improve management control. Each project phase is marked by completion of one or more deliverables. A deliverable is a tangible, verifiable work project such as a feasibility study, a detail design, or a working prototype. The
Cost and Staffing
Level
Intermediate Phases (one or more)
“A needs assessment or a feasibility study is generally the first step toward a project when a company identifies an area of opportunity. The phase sequence defined by most project life cycles generally involves some form of technology transfer or handoff such as requirements to design, construction to operations, or design to manufacturing” (PMBOK Guide 2000, pg. 12). Deliverables are usually approved before work starts on the next phase. The project life cycles generally define the
technical work that should be done in each phase and the persons that should be involved (PMBOK Guide 2000).
“Most project life-cycle descriptions share a number of common characteristics: cost and staffing levels are low at the start, higher toward the end, and drop rapidly as the project draws to a conclusion, the probability of successfully completing the project is lowest, and hence risk and uncertainty are highest, at the start of the project where the probability of successful completion generally gets progressively higher as the project continues, and finally, the ability of the stakeholders to influence the final characteristics of the project’s product and the final cost of the project is highest at the start and gets progressively lower as the project continues” (PMBOK Guide 2000, pg. 12). A major contributor to this occurrence is that the cost of changes and error correction generally increase as the project increases in time (PMBOK Guide 2000).
sacrificing performance in another. Successful project management requires actively managing these interactions” (PMBOK Guide 2000, pg. 29).
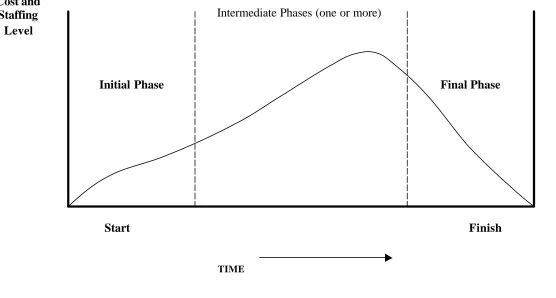
The interactive processes, taken from PMBOK (2000, pg.13) are shown above in Figure 2. “Projects are composed of processes. Project management processes may be organized into five groups of one or more processes each:
- Initiating processes. Authorizing the project or phase
- Planning processes. Defining and refining objectives and selecting the best of the alternative courses of action to attain the objectives that the project was
undertaken to address.
- Executing processes. Coordinating people and the resources to carry out the plan. - Controlling processes. Ensuring that project objectives are met by monitoring and
measuring progress regularly to identify variances from plan so that corrective action can be taken when necessary.
Figure 2. Links among Process Groups in a Phase
A Guide to the Project Management Body of Knowledge (PMBOK Guide), 2000 Edition. Newtown Square, Pennsylvania: Project Management Institute, 2000, pg. 31 Initiating
Processes
Arrows
represent flow
of information
Planning Processes
Controlling
Processes Executing Processes
Phase
Start Phase
Finish Level of
Activity
Initiating Processes
Planning Processes
Controlling Processes
Executing Processes
Closing Processes
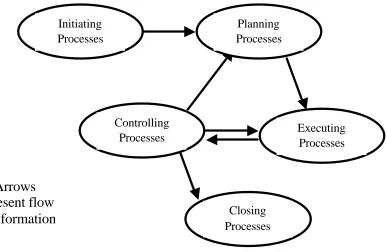
Figure 3. Overlap of Process Groups in a Phase
“Within each process group, the individual processes are linked by their inputs and outputs. Inputs are documents or documentable items that will be acted upon. Tools and techniques are mechanisms applied to the inputs to create the outputs. Outputs are documents or documentable items that are a result of the process” (PMBOK Guide 2000, pg. 32).
2.3.4.2 Knowledge Areas
Process
Knowledge Area
Initiating Planning Executing Controlling Closing
Project Integration Management
- Project Plan Development
- Project Plan Execution
- Integrated Change Control
Project Scope Management
- Initiation - Scope Planning - Scope Definition
- Scope Verification - Scope Change Control Project Time Management - Activity Definition - Activity Sequencing - Activity Duration Estimating - Schedule Development - Schedule Control Project Cost Management - Resource Planning
- Cost Estimating - Cost Budgeting
- Cost Control
Project Quality Management
- Quality Planning - Quality Assurance - Quality Control Project Human Resource Management - Organizational Planning
- Staff Acquisition
- Team Development Project Communicatio ns Management - Communications Planning - Information Distribution - Performance Reporting - Administrative Closure Project Risk Management - Risk Management Planning - Risk Identification - Qualitative Risk Analysis
- Quantitative Risk Analysis
- Risk Response Planning - Risk Monitoring and Control Project Procurement Management - Procurement Planning - Solicitation Planning - Solicitation - Source Selection - Contract Administration
- Contract Closure
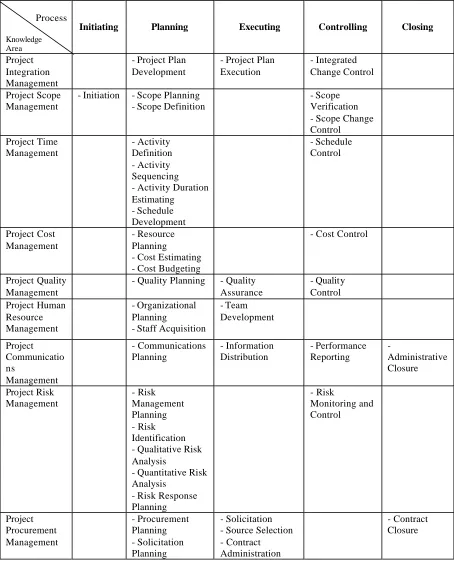
Table 2. Mapping of Project Management Processes to the Process Groups and Knowledge Areas
Table 2 was a graphical format of the Project Management Knowledge Areas and the phases in which they belong. The following is an explanation and description of each of the Nine Project Management Knowledge Areas and the components of which they are comprised. (PMBOK Guide 2000, pg. 189-191)
2.4.1.2.1 Project Integration Management
A subset of project management that includes the processes required to ensure that the various elements of the project are properly coordinated. It consists of:
- Project plan development. Integrating and coordinating all project plans to create a consistent, coherent document.
- Project plan execution. Carrying out the project plan by performing the activities included therein.
- Integrated change control. Coordinating changes across the entire project.
2.4.1.2.2 Project Scope Management
A subset of project management that includes the processes required to ensure that the project includes all the work required, and only the work required, to complete the project successfully. It consists of:
- Initiation. Authorizing the project or phase.
2.4.1.2.3 Project Time Management
A subset of project management that includes the processes required to ensure timely completion of the project. It consists of:
- Activity definition. Identifying the specific activities that must be performed to produce the various project deliverables.
- Activity sequencing. Identifying and documenting interactivity dependencies. - Activity duration estimating. Estimating the number of work periods that will be
needed to complete individual activities.
- Schedule development. Analyzing activity sequences, activity durations, and resource requirements to create the project schedule.
- Schedule control. Controlling changes to the project schedule.
2.4.1.2.4 Project Cost Management
A subset of project management that includes the processes required to ensure that the project is completed within the approved budget. It consists of:
- Resource planning. Determining what resources (people, equipment, materials) and what quantities of each should be used to perform project activities.
- Cost estimating. Developing an approximation (estimate) of the costs of the resources needed to complete project activities.
- Cost budgeting. Allocating the overall cost estimate to individual work activities. - Cost control. Controlling changes to the project budget.
2.4.1.2.5 Project Quality Management
A subset of project management that includes the processes required to ensure that the project will satisfy the needs for which it was undertaken. It consists of:
- Quality assurance. Evaluating overall project performance on a regular basis to provide confidence that the project will satisfy the relevant quality standards. - Quality control. Monitoring specific project results to determine if they comply
with relevant quality standards and identifying ways to eliminate causes of unsatisfactory performance.
2.4.1.2.6 Project Human Resource Management
A subset of project management that includes the processes to make the most effective use of the people involved with the project. It consists of:
- Organizational planning. Identifying, documenting, and assigning project roles, responsibilities, and reporting relationships.
- Staff acquisition. Getting the needed human resources assigned to and working on the project.
- Team development. Developing individual and group skills to enhance project performance.
2.4.1.2.7 Project Communications Management
A subset of project management that includes the processes required to ensure timely and appropriate generation, collection, dissemination, storage, and ultimate disposition of project information. It consists of:
- Administrative closure. Generating, gathering, and disseminating information to formalize phase or project completion.
2.4.1.2.8 Project Risk Management
Risk management is the systematic process of identifying, analyzing, and responding to project risk. It includes maximizing the probability and consequences of positive events and minimizing the probability and consequences of adverse events to project objectives. It includes:
- Risk management planning. Deciding how to approach and plan the risk management activities for a project.
- Risk identification. Determining which risks might affect the project and documenting their characteristics.
- Qualitative risk analysis. Measuring the probability and consequences of risks and estimating their implications for project objectives.
- Risk response planning. Developing procedures and techniques to enhance opportunities and reduce threats from risk to the project’s objectives.
- Risk monitoring and control. Monitoring residual risks, identifying new risks, executing risk reduction plans, and evaluating their effectiveness throughout the project life cycle.
2.4.1.2.9 Project Procurement Management
A subset of project management that includes the processes required to acquire goods and services to attain project scope from outside the performing organization. It consists of:
- Procurement planning. Determining what to procure and when.
- Solicitation. Obtaining quotations, bids, offers, or proposals, as appropriate. - Source selection. Choosing from among potential sellers.
- Contract administration. Managing the relationship with the seller. - Contract closeout. Completion and settlement of the contract, including
resolution of any open items.
2.3.5 Roles/Responsibilities of Stakeholders
“Project stakeholders are individuals and organizations that are actively involved in the project, or whose interests may be positively or negatively affected as a result of project execution or project completion; they may also exert influence over the project and its results. The project management team must identify the stakeholders, determine their requirements, and then manage and influence those requirements to ensure a successful project. Stakeholders identification is often especially difficult, but key stakeholders on every project include:
- Project Manager – the individual responsible for managing the project. - Customer – the individual or organization that will use the project’s product.
- Sponsor – the individual or group within or external to the performing organization that provides the financial resources, in cash or in kind, for the project” (PMBOK Guide 2000, pg. 11).
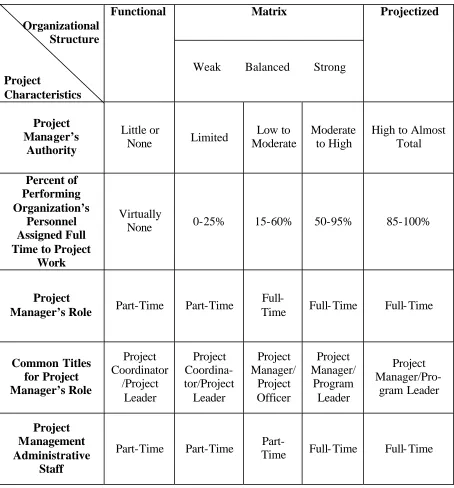
“The structure of the performing organization often constrains the availability or terms under which resources become available to the project. Organizational structures can be characterized as spanning a spectrum from function to projectized, with a variety of matrix structures in between. The classic functional organization is a hierarchy where each employee has one clear superior. Staff members are grouped by specialty, such as production, marketing, engineering, and accounting at the top level, with engineering further subdivided into functional organizations that support the business of the larger organization” (PMBOK Guide 2000, pg. 19).
“At the opposite end of the spectrum is the projectized organization. In this
Organizational Structure Project Characteristics
Functional Matrix
Weak Balanced Strong
Projectized
Project Manager’s
Authority
Little or
None Limited
Low to Moderate
Moderate to High
High to Almost Total Percent of Performing Organization’s Personnel Assigned Full Time to Project
Work
Virtually
None 0-25% 15-60% 50-95% 85-100%
Project
Manager’s Role Part-Time Part-Time
Full-Time Full- Time Full- Time
Common Titles for Project Manager’s Role Project Coordinator /Project Leader Project Coordina-tor/Project Leader Project Manager/ Project Officer Project Manager/ Program Leader Project Manager/Pro-gram Leader Table 3. Organizational Structure Influences on Projects
“For years, project management was derided as a low-tech, low-value, questionable activity. Only recently has it been recognized as a central management discipline” (Morris, 1994, pg.1). “The Project Manager must have authority. Without it, he/she will not be effective. A potentially good project manager will try to achieve results, but without authority, all he will do is upset himself, other managers, and the organization in general. In addition to assigning him decision-making authority, top management must assign the project manager control over the resources to do the job” – Charles Martin (Penner, 1994, pg. 11). “If you are a project manager, you are proactive, not reactive” (Lewis, 2001, pg 72). “The project team manages the work of the projects, and the work typically involves competing demands for: scope, time, cost, risk, and quality, involves stakeholders with differing needs and expectations, and involves identified requirements” (PMBOK Guide 2000, pg. 6).
2.3.6 Change Management
“There are many different human factors that are a part of project management. The stumbling block to introducing a rigorous or structured approach to projects is that it requires a cultural change by internal users. However, one of the reasons for the high rate of project failures today is due to a lack of a disciplined use of the best organizational practices and the effective management of resources” (Monczka, Trent, and Handfield, 2002, pg. 374).
There are several facets of change within an organization, trickling down from top executives through to the lower-ranking employees. The complexity includes political battle, cultural barriers, inertia of organization structures and systems, and bounded rationality of managers (Heracleous, 2000). Change is viewed differently at each level.
Three things to consider on how to deal with change include recognizing ho w most people deal with change haphazardly; understanding why change is so difficult, and understanding the relationship between change and transition (Wirtz, 2001).
The role of a CEO should act less as commanders or architects and more as coordinators, coaches and premise-setters. The reason is that the first two roles separate thinking and acting, strategy formulation and implementation. A strategy or change program formed in the mid of one individual is much more problematic to implement than one, which encompasses the input of people who have to live with it (Heracleous, 2000).
achievers comprise ~20% and will quickly embrace the change. Adopters are the majority at ~ 60% and will take the middle road. These employees will embrace the change as long as it is well handled. And finally the abstainers are about 20% of employees. They do not want anything to do with the change and keep their distance from the processes (St-Amour , 2001).
Throughout each level of management, though, there are three primary areas that must be managed with the ending of the old era. People feel losses – loss of attachments, turf, structure, future, meaning, and control. Then the “neutral zone” must be managed, where there is support through chaos and confusion from ending to new beginning. Finally, the new beginning must be managed while new attitudes should be developed and rewarded (Wirtz, 2001).
Culture change of the company is often simultaneously integrated with the tangible change associated with projects. “Culture is the set of shared attitudes, values, goals, and practices that characterizes an organization” (Lientz & Rea, 2002, pg. 251). “You can’t make project management work in an organization in which nobody believes in project management” (Lewis, 2001, pg 58).
“Einstein once said, ‘You can’t solve a problem using the thinking that created it in the first place’. If you are going to make project management work in your
“When you undertake a project, it is within the context of an organization. The people who are involved in the project and the organization exist within a wider culture. The culture of the organization includes how issues are addressed, how decisions are made, how actions are taken, the extent to which the organization supports initiative and empowerment versus control, how the work is organized, how the work is reviewed, the value placed on project management, the degree of flexibility and structure in work, and the approach and attitude toward technology” (Lientz & Rea, 2002, pg 251).
“(In the area of technology)…companies can be grouped into categories. Innovators are companies who embrace new technology before it is widely in use. They tolerate a high degree of failure if they can achieve a few successes. Dabblers are organizations that test out new technology, but fail to adopt anything new. This is due to fear. The Followers are organizations that wait until a firm in their industry adopts and shows success of the new technology. The category of your firm greatly impacts the nature of the project and that of project management” (Lientz & Rea, 2002, pg 252).
2.3.7 Success Factors and Evaluation
“Organizations have come to rely on technological innovation as a central component of their competitive strategy” (Reddy, 1990). The costs of failed
In 1993, Griffith and Northcraft developed a proposed model to understand cognitive determinants of technology implementation success. “Their model emphasizes that differences in cognitions (thoughts, perception, and constructed understandings) among users, designers, and implementers are critical determinants of implementation success.”
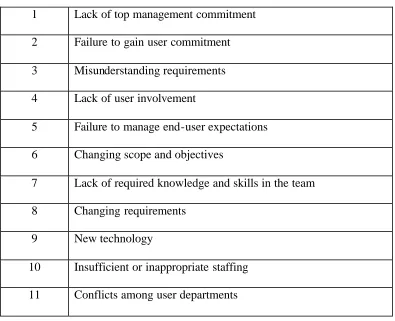
Table 4. Top Reasons for Problems (Lientz & Rea, 2002, pg. xviii) 1 Lack of top management commitment
2 Failure to gain user commitment 3 Misunderstanding requirements 4 Lack of user involvement
5 Failure to manage end-user expectations 6 Changing scope and objectives
7 Lack of required knowledge and skills in the team 8 Changing requirements
9 New technology
10 Insufficient or inappropriate staffing 11 Conflicts among user departments
keeping new versions of the software compatible with various customized efforts. Vendors only make profits in overhead on time and materials for customization. It is often more fruitful to devote these resources to new releases and versions of the core software” (Lientz & Rea, 2000, pg. 9).
According to the Standish Group’s Chaos Report, which surveys the results of IT implementation projects, it should be almost understood that projects will exceed original time and budget expectations. In a survey of 365 responding companies, 16.2%
completed their projects on-time and on-budget with all features and functions as initially specified. In the survey, 52.7% reported that the project was completed and operational, but over-budget, over the time estimate, and offered fewer features and functions than originally specified. Finally, 31.3% reported that projects were altogether cancelled at some point during the development cycle. “In the United States, we spend more than $250 billion each year on IT application development of approximately 175,000 projects. In 1994, the average cost of a development project for a large company is $2,322,000; for a medium company, it is $1,331,000; and for a small company, it is $434,000” (Standish Group’s Chaos Report, pg.2).
Evaluation, as with roles throughout the entire project, may be viewed at their respective levels. Individual, team, and organizational competence may be evaluated (Frame, 1999). User and implementer understandings influence implementation success. One interesting point is the “paradox of positive value (where) an implementer’s
positively biased presentation of a technology makes negative surprises inevitable; the paradox of negative experience is that these negative surprises, if managed well, become valuable positive learning experiences for users” (Griffith & Northcraft, 1996, pg. 101).
The old adage that an output is only as good as its inputs is quite relevant here. The effect of training users of the outcome of the project is important to the success of the project. But, perhaps more important to success is the level of project ma nagement training per project participant. The project must be successfully completed before anyone may be trained on its results.
“Innovativeness, experience, and academic skill may affect the success of the project. Innovativeness measures subjects’ flexibility and willingness to challenge paradigms. It controls for subjects’ propensity to push the software to its limits or to try new approaches. Experience controls for subjects’ general skill in using systems in creating the forecast. Academic Skill measures each subject’s previous performance and controls for ability, and/or motivation to perform well on the project” (Griffith &
Northcraft, 1996).
2.3.8 Macro/Micro Influences upon Project Management
possibilities to remain competitive. Increased global markets and manufacturing has widened profit margins in the short term of the initial exploring companies and therefore increased the need for lean operations of remaining companies to stay competitive.
“Because projects are becoming more global in nature, and teams are often more culturally diverse than in past years, it is important that project managers learn about and value cultural difference and how to deal with them” (Lewis, 2001, pg 36).
Not only must the global influences of the employees be taken into consideration, but also expansion into a global marketplace and global supply base in the manufacturing environment. “Another observation is that project management is much more than a group of people working on something according to a plan. It is much more dynamic in terms of organization, external factors, methods, and tools. If we treat projects as static, we will lose” (Lientz & Rea, 2002, pg 45). One reason for change includes the move towards that global supply chain and lean operations in times of economic troubles (Rich, 2003).
Micro, internal, influences on project management includes the previously discussed need for change management including hidden agendas for various
It has been “reveal(ed) that project management has moved beyond its traditional concern with the famous triple constraints of time, budget, and specifications and that the skills and insights required of effective project personnel are far broader today than in the past” (Frame, 1999, pg. xv).
2.4 FORECASTING
2.4.1 Historical Development
Forecasting is a relatively new distinct functioning department within the corporate business world. On the average, the forecasting function is 5.6 years old, meaning it was 5.6 years ago when the average company hired one or more full- time forecasters (Jain, 2002). Businesses now recognize the importance of a formal
forecasting department (Jain, 2002). Allocation of resources to this function is vital for success and continuous improvements. The forces that have brought the forecasting function to the forefront are:
ú Recognition by business that they need better forecasts for better decisions
ú Development in technology for processing, storing, and accessing data
ú Willingness among business partners to share information
ú An increase in competition
ú Shorter product life cycles. (Jain, 2002)
2.4.2 Methodology
2.4.2.1 Statistical/Judgmental Methodology
Forecasts improve when human judgment and market data are properly combined (Burruss, 2003). One way to categorize forecasting models is to group them into three sections. Time series, cause-and-effect, and judgmental models are used across many industries. Time series models assume that the past trend will predict and continue into the future. Cause-and-effect models incorporate a driver or independent variable, which will result in an effect, or a dependent variable. Judgmental models are set procedures that are used to arrive at forecasts and utilize expert advice (Jain, 2002).
In a survey conducted and reported in the Journal of Business Forecasting, time series models are the most often used (61.33%), cause-and-effect models follow
which are derived from judgmental sources and the following six are derived from statistical sources.
The judgmental sources include an intentions survey, role playing, expert opinions, conjoint analysis, and judgmental bootstrapping. The following is an explanation of each of the sources and its relationship to one another.
1. Intentions surveys are used to ask people to predict how they would behave in various situations. These are widely used when sales data are not available.
2. Role playing is a relatively new concept and is especially useful in negotiation situations. It is a method that has considerable potential for forecasting, although is seldom used (Armstrong, 1999).
3. Expert opinion studies are different from the intentions surveys. An expert is assumed to have an edge on the issue at hand and may be combined with other experts to develop a forecast.
4. A Delphi procedure is an iterative survey procedure in which experts make forecasts for a problem, receive anonymous summary feedback on the forecasts made by other experts, and then make a further forecast. A Delphi technique offers a useful way to implement many of the basic principles for expert forecasting. It uses more than one expert, unbiased experts, structured questions, and equal weights for each expert’s fo recast (Armstrong, 1999).
that describe the situation. Regressing intentions against factors is the procedure known as conjoint analysis.
6. Judgmental bootstrapping is the last method based on judgmental sources. This approach converts subjective judgments into objective procedures. Experts are asked to make predictions for a series of conditions and these conditions are then converted into a series of rules by regressing the forecasts against the information used by the forecaster. It is a low-cost procedure for making forecasts.
The methods that are based on statistical sources include extrapolation, rule-based forecasting, analogies, expert systems, multivariate time series methods, and econometric methods. The following is a description of each.
3. Expert Systems are rule based systems typically created from protocols or experts (forecasters). Based on certain conditions, rules are fixed and combined to produce the forecast.
4. Multivariate time series methods have not been proven to provide significant benefits for forecasting.
5. Econometric methods use prior knowledge (theory) to construct a model. This involves selecting causal variables, identifying the expected
directions of the relationships, imposing constraints on the relationships to ensure they are sensible, and selecting functional forms. Often, these models can directly relate to planning and decision making. These models are most accurate when strong causal relationships can be established.
2.4.2.2 80/20 Rule/Pareto Principle
This rule was developed by Dr. Joseph Duran whereby he investigated his theory that a small percentage of the population typically accounts for a majority of the wealth. The principle now states that a small number of causes are responsible for a large
2.4.2.3 Collaborative Planning Forecasting & Replenishment (CPFR)
Collaborative Planning Forecasting & Replenis hment is somewhat of a project in itself. CPFR is simply the latest embodiment of knowledge and experience that has been compiled to continually improve a company’s internal efficiencies while increasing external effectiveness (CPFR.org). These elements of increased efficiencies and effectiveness are to be improved through an increase in forecast accuracy and ultimate customer satisfaction.
“CPFR is the 21st Century’s most powerful process for consumer satisfaction. Giving strategy, purpose, and structure to retailer-vendor partnerships, it is the
culmination of years of struggle between their competing priorities” (Peterson, 2003) . “To its founders, CPFR is an outgrowth of Vendor-Managed Inventory (VMI) programs that did not perform adequately. It could be argued that CPFR is an evolved form of VMI” (CPFR.org). Regardless, CPFR is a means of increased communication and cooperation between entities in the supply chain that should result in higher customer satisfaction.
Planning: “Joint business planning (categories, brands, assortments, skus, key
items, etc.) and financials (sales, fill rates, pricing, inventory, safety stock, gross margin, etc.) assures both parties of equal skin in the game and forces common goals for each. In addition, the joint project team develops plans for promotions, inventory policy changes, product introduction and discontinuations, and store groupings” (Peterson, 2003).
Forecasting: This is the key value to which both parties must agree and assume
responsibility. Sales and promotions must be integrated into the production plans for increased forecast accuracy. “Even the best forecast will need to be monitored and adjusted in-season, as this is where two sets of eyes, focused on the customers’ reaction, can be twice as effective. Any of the certified interoperable software packages can trigger forecast differences between vendor and manufacturers systems. Rules need to be determined on how to resolve those variances, but the basic premise of CPFR is that you solve those differences jointly, with the same end goals” (Peterson, 2003).
Replenishment: “An expected benefit of close collaboration and partnership
should be flexibility and joint reaction to surprises.” (Peterson, 2003) Retailers should not be held to longer forecast lead times and in return, manufacturers should be able to ship items in short supply to retailers with whom they have entered a CPFR agreement.
This facet of forecasting methodology has shown great promise for mass market retailing giants, Target and Wal-Mart. It will continue to grow in popularity with those trying to stay competitive in this market.
2.4.2.4 New Products and Forecasting
require a different strategy (cost improvement, product improvement, line extensions, market extensions, new category entries, and new-to-the-world).
The cost improvement new product incorporates reduced cost or price versions of the product for the existing market. The product improvement new products are new, improved versions of existing products/services, targeted to the current market. Line extensions are incremental innovations added to existing product lines and targeted to the current market. Market extensions involve taking existing products/services to new markets. New category entries are company product and new-to-the-company market, but not new to the general market. New-to-the-world products are radically different products/services versus current offerings and markets served (Kahn, 2002).
2.4.2.4.1 Innovation: Initiating Factors
Forecasting historically stable demand patterns, styles and colors is a difficult challenge within itself, without the innovative new products. However, those new products drive the business and ensure customer satisfaction and brand loyalty. In demand forecasting, statistical models present the basis for predicting consumer demand based on historical demand. However, the need for the judgmental influence arises when predicting the variations of demand and the launch of new products.
When only considering the US, idea generation must revolve around and account for the 113,969,175 million women that are over age 14 (Census, 2002). In the global marketplace however that number is much greater and race, religion, income, and social elements are factors in predicting demand. Each of these will play a role in forecasting products in the apparel industry. Symptoms manifested by inaccurate demand prediction and ultimately poor forecasting include out of stocks, markdowns, spoilage, returns, distribution, and assortment gaps and new product failures (Census, 2002). It is
imperative that as much information as possible, both quantitative and qualitative, be fed into a forecasting model for accurate demand measurement to minimize these symptoms. New product forecasts drive a variety of multifunctional decisions. These include manufacturing decisions on raw materials procurement, manufacturing schedules, and finished goods inventory levels; logistics decisions on physical distribution planning and transportation schedules; marketing decisions on marketing budgets and promotion schedules; sales decisions on support materials and salespeople training; and finance decisions on corporate budgets and financial expectations for the new product.
2.4.2.4.2 Strategic: Reactive
Chasing a style that has performed better than expected is a classic symptom of a reactive implication, but not necessarily a planned business strategy. There could be other factors involved to create the situation such as material availability and production capacity, but if the style is being chased there most likely has been a forecasting error. The risk associated with using this reactive strategy is losing customers, which results in an inaccurate measurement of demand for future similar styles. Not only is demand difficult to calculate, but once the customers are not satisfied competitors are given the opportunity to improve performance. One method by which the chase can be minimized is to keep a small amount of materials available for emergency situations for primary accounts, such as Wal-Mart.
2.4.2.4.3 Proactive
A proactive strategy is to allocate resources to preempt future events (Urban, 1993), whether positive or negative. In this industry, inventory is often more costly than expediting materials, but neither is desirable. More accurate forecasting may level the two evils. Sales and marketing predicts that every single new product will be the next outrageous success. This may be used as an input to the forecast, but tempering the excitement to form a realistic number may avoid excess inventory.
2.4.2.4.4 Competition
new product can be assessed within an existing product category and thus represent and ambiguous attack. Both innovative and imitative new products meet reaction in this case (Debruyne, 2002).
2.4.2.4.5 Cross-Functional Integration
Cross-functional teams are needed to develop new products so that a coordinated set of resources, skills, perspectives, and activities may assist in forecasting the
performance of new products. Design, engineering, finance, marketing, sales, and production departments often have separate forecasting methods, technologies and agendas. The truth is that any business that forecasts demand in “silos” is just guessing. Objective opinions and fact-based data must be presented before products are approved. Unfortunately, this is not always the case as was demonstrated with intimates that incorporate a vast number of SKUs. Sharing information results in more accurately forecasting demand and ultimate cost savings.
There are two main benefits from holding consensus meetings to review statistically generated forecasts. One of which indicates that all functions within the business are involved in the forecast process as well as aware of the issues involved. The second benefit is that judgment plays a large role in the forecast and overlaying more ideas onto the statistics. At adjournment, all areas of the business own the forecast and may take responsibility (Jain, 2002).
elements of an S&OP process that should be evaluated and are required for success. These three elements are preparation for the meeting, what transpires during the meeting, and the actions after the meeting (Lapide, 2002).
An unconstrained demand forecast is brought into the meeting, which is generally statistically generated. This should incorporate historical demand as well as all known impacts to future demand including competitor actions, future marketing promotions and pricing strategies. Shipment data alone should not be used as a factor in the
“unconstrained” forecast generation. This could underestimate actual demand. The forecast must be presented in a manner that everyone present may understand the values.
The sequence of events during and after the meeting should document the changes made to the baseline forecast and the reasons for the alterations. The resulting
constrained forecast will take into account the supply side of the business including material availability, production capacity, and transportation issues. This is another aspect of the cross-functional team described in the generic new product development process.
2.4.3 Forecast Accuracy
aggregate level and then apply a product mix by percentage to generate a SKU level forecast. Top management will often make recommendations at the aggregate levels.
Forecast errors will generally increase as the forecast is projected further into the future. Just the same, some products are easier to forecast than others. Forecasts of non-matured products have larger errors than non-matured products; forecasts of promoted products have larger errors than non-promoted products and forecasts of new products have larger errors than existing products (Jain, 2002).
The revisions of forecasts can also effect the accuracy measurement. Ideally, the forecast will be revised up to the last possible time frame. Manufacturing lead times, time to market, and product life cycles will all play a role in the feasibility of updating forecasts. Executive decisions and politics may also make a large difference in the revisions of forecasts.
One issue always remains, what can we do to reduce forecast error (Jain, 2002)? 2.4.4 IT Innovations – New Forecasting Methodology
3.0 CHAPTER 3 - RESEARCH METHODOLOGY
The purpose of this investigation is to understand formal Project Management methodology and document an application of this strategy in an apparel industry setting.
3.1 RESEARCH OBJECTIVES
Research objectives of this study are designed to understand project management and accurately review the application of a case study project in a textile industry setting. In particular, the objectives will identify the extent to which the Project Management Institute’s Project Management Framework was utilized and to assess the success of the project given this proven methodology. The specific objectives are to:
1. Identify and document the phases and participants of the forecasting software implementation project from beginning to end hereafter referred to as Software. 2. Understand organizational, behavioral, and systems restrictions and catalysts for each of the Software implementation phases and participants.
3. Develop a learning critique that determines the effectiveness of each phase of the project.
3.2 RESEARCH DESIGN
The case study approach was employed to understand formal project management and its utilization for the software implementation project. Qualitative data collection was best suited for this study. Respondents were asked to elaborate upon answers to questions to provide greater insight to the project.
Initially, the Vice President of Demand Planning was involved with research design at a broad level. However, the Director of Forecasting was instrumental in research design development and construction. The Director focused the research upon the division with an on-going project that could be examined from a formal project management perspective. The research objectives were developed with the intent to provide feedback and lessons learned from a position external to the project. The Director identified respondents according to their project roles to most accurately gather data. This ranged from team members on the task force involved in the initial needs assessment to remaining team members resolving administrative closure.
3.3 INSTRUMENT DEVELOPMENT
Qualitative data was gathered through interviews conducted with project team members. The data collection instrument, found in Appendix A, was developed by the researcher to determine the level of formal project management utilized during the forecasting software implementation project. Questions in sections I through IV
Table 1. These nine areas are incorporated in the five stages of project management, as shown in Figure 3.
Sections I and II of the data collection instrument determine demographics of the respondent. The basic employee information and technical qualifications of each team member is gathered in these sections. The enter and exit dates of each project team member to the company and specifically to the project is critical to establish the knowledge base for each stage of the project. Section II applies more directly to the Information Technology team members, but is also applicable to the overall information systems understanding of each team member given the nature of the project. The researcher developed these sections for statistical and follow-up purposes.
Sections III and IV of the data collection instrument determine part of the needs assessment for the project. This section is more specifically for the original Forecasting department and Software selection process. The purpose of the Software implementation was to improve quantitative forecast accuracy. Given more time, the impact and success of the project may be determined. However, this is the beginning of qualitative
educational background from Sections I through IV of the project team members is important to determine the qualification of answers in this section.
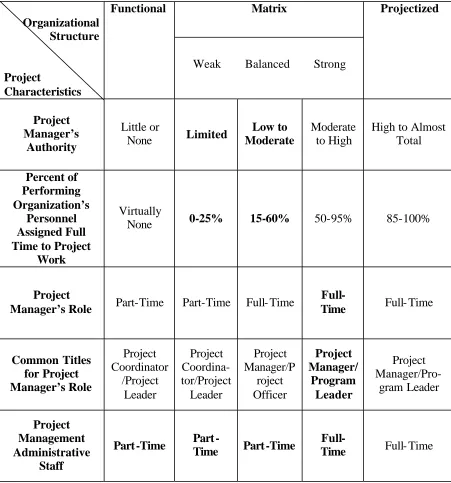
Section VI of the data collection instrument determines the approach to change manage ment and directly relates to roles and responsibilities (Section I). Successful project implementation can be simultaneously associated with proactive change management direction. This section will also determine, through the Organizational Structure Matrix, the state of the department during implementation. It may also correlate to the project success rate by determining receptiveness to the project. This section of the questionnaire was developed by the researcher to determine receptiveness to the project and possibly directly correlate project success rate. The Organizational Structure Matrix is directly from the Project Management Institute (PMBOK 2000).
Section VII of the data collection instrument provides additional qualitative feedback from project team members. This is the opportunity for team members to make recommendations for future project undertakings. It was developed by the Researcher to allow respondent to elaborate upon issues faced during implementation with regard to the individua l, the project, or the company.
3.4 SAMPLE SELECTION
The project team was identified including executive s, project managers, and project team members from the forecasting, sales planning, supply chain, and information technology departments. Since this was an information technology project, there was close interaction between the individual departments.
A task force was originally created to evaluate candidates for software selection. Sales pitches were given and a four-hour demonstration was also given for each
candidate. One software was specifically chosen. Four of eight respondents were members of this task force.
Although only one company was chosen, a good evaluation of the research objectives was achieved due to the size and complexity of the company. The SKU
proliferation provided additional variables that a smaller company could not have offered. 3.5 DATA COLLECTION
questionnaire may have seemed too time consuming and negatively affected the response rate. Also, it was evident that some respondents only nominally answer questions with yes/no responses, but others may have not separated bias emotions they developed during the project to objectionably answer the questionnaire.
Note: Another division within the same corporation initially agreed to participate in the study. This division also manufactures and markets industry leading apparel items. The same Software was implemented in this division. However, at the time of the study, the division was not able to participate due to imminent departmental due dates and obligations.
3.6 DATA ANALYSIS
4.0 CHAPTER 4 - RESULTS
4.1 SAMPLE DESCRIPTION
Sample respondents were contacted across several functional departments within their divisions. The functional departments included information technology, supply chain management, sales planning, production planning, and forecasting. Each played a different role in the overall project team. The project titles ranged from observer to participant to executive leadership. The sample size of respondents was eight.
4.2 RESULTS – RESPONDENT PROFILE, QUESTIONNAIRE SECTIONS I - IV
Respondents ranged in length of participation time on the Software project. One respondent was specifically hired to perform duties for the software project, but hired several months after the project had started. One respondent was hired simultaneously with Software selection. Six respondents were previous corporate employees and assumed roles in the project in addition to normal responsibilities. These respondents ranged in time with the company from twenty-eight years to only a few months.