78: 6-13 (2016) 75–80 | www.jurnalteknologi.utm.my | eISSN 2180–3722 |
Jurnal
Teknologi
Full Paper
A
MODIFIED
KOHONEN
SELF-ORGANIZING
MAP
(KSOM)
CLUSTERING
FOR
FOUR
CATEGORICAL
DATA
Azlin Ahmad
a, Rubiyah Yusof
b*a
Faculty of Computer and Mathematical Science, Universiti
Teknologi MARA, Selangor, Malaysia
b
Center of Artificial Intelligence and Robotics (CAIRO),
Malaysia-Japan International Institute of Technology (MJIIT), Universiti
Teknologi Malaysia, Kuala Lumpur, Malaysia
Article history Received 15 November 2015 Received in revised form
24 March 2016 Accepted 05 April 2016
*Corresponding author
[email protected]
Graphical abstract
Abstract
The Kohonen Self-Organizing Map (KSOM) is one of the Neural Network unsupervised learning algorithms. This algorithm is used in solving problems in various areas, especially in clustering complex data sets. Despite its advantages, the KSOM algorithm has a few drawbacks; such as overlapped cluster and non-linear separable problems. Therefore, this paper proposes a modified KSOM that inspired from pheromone approach in Ant Colony Optimization. The modification is focusing on the distance calculation amongst objects. The proposed algorithm has been tested on four real categorical data that are obtained from UCI machine learning repository; Iris, Seeds, Glass and Wisconsin Breast Cancer Database. From the results, it shows that the modified KSOM has produced accurate clustering result and all clusters can clearly be identified.
Keywords: Kohonen Self-Organizing Map (KSOM); clustering, categorical data; Ant Colony Optimization (ACO)
© 2016 Penerbit UTM Press. All rights reserved
1.0 INTRODUCTION
Clustering is widely used in many data mining applications, which involves large databases with different kind of attributes. Technically, it can be defined as a process of grouping similar objects into several groups called clusters. These clusters consist of objects that are similar to one another in the same cluster and dissimilar to the objects of another cluster. From machine learning perspective, the clusters resemble the hidden patterns in the data set while the resulting system represents a data concept. The searching process of clusters is categorized as unsupervised learning [1]. Unlike classification, this technique requires no-pre-classified data; where it will search for clusters of data that exhibit similar behavior or feature through the data set. The distance measure is used as a standard measurement in clustering
reference vectors or weights that are defined for each partition.
There are a few factors that might influence the KSOM clustering result; such as learning parameters and topology map sizes. Therefore, the dataset is trained repetitively using different map sizes, to find the most suitable map size that can represent the clusters for the data set, accurately. This algorithm is also capable of processing high dimensional data because it is designed to group data into clusters that exhibit some similarities. Each cluster with similar features is projected onto the same node on the map. Otherwise, the dissimilarity increases with the distance that separates two objects on the map. Thus, the cluster space is identified on the map, so that the object enables simultaneous visualization and observation of the cluster [3].
Nowadays, the KSOM is hybridized with other methods, algorithms or filtering techniques to solve complex problems, such as signal and image processing. For example, it has been applied in transient crack-related signal detection that can recognize the presence of strong time-varying noise or interferences [4],[5]. Also, the KSOM has also been widely used as a visualization tool for dimensionality reduction. Its unique topology preserving property can be used to visualize the relative mutual relationships among the data. It has been applied to organize and visualize the vast amount of textual information, for example, the SOM that organizes massive document collection, which named as WEBSOM [6]. Razaei et al. [22] have demonstrated that KSOM is not applicable in segmenting the Virtual Histology-Intravascular Ultrasound (VH-IVUS) images, because of there is no pre-defined number of the cluster that represents the color component in detecting the vulnerable plagues. However, there is one of KSOM advantages; it does not require prior knowledge of the number of clusters. The main benefit of KSOM is the topology preservation of an input space, which makes a similar object appear closely on the map, and differentiate the clusters effectively [7],[21]. Most of these applications are based on 2D grids and map. The KSOM can deal with incomplete and noisy data [8], and can transform a non-linear statistical data pattern in multidimensional data space into a simple geometric relation of their images in two or three-dimensional output space[9]. Moreover, this is why it has become one of the conventional clustering techniques and being implemented in various fields.
2.0 THE MODIFIED KSOM ALGORITHM
Regardless of all these advantages, the KSOM has a few drawbacks; such as overlapped clusters, non-linear separable problem and the distribution of clustering data. These problems need to be solved, and if not, it might influence the algorithm performance. Because of that, lots of researches have been done to overcome
the mentioned problems. The KSOM is modified to improve the clustering performance.
The Growing Self-Organizing Map or also known as GSOM was introduced to improve and optimize the neighborhood preservation, by optimizing the weight vectors in the input and output space, even if the dimension of the input set is unknown. This algorithm has been applied in solving various types of problems in many areas. For example; in the classification of protein sequences [10], discovering the temporal input pattern [11] and semantic acquisition modeling [12]. However, this GSOM algorithm has certain weaknesses, such as projection distortion and incapable of dealing with high-dimensional data. Therefore, Amarasiri et al. [13] proposed a High Dimensional Growing Self-Organizing Map (HDGSOM) to deal with high dimensional. This proposed algorithm could solve the problem faced by GSOM in handling the high dimensional data, where the clustering process is more efficient than GSOM. While a year later, Hsu et al. [14] introduced Generalized Visualization-Induced Self-Organizing Map (GViSOM) to overcome the projection distortion in clustering and this proposed algorithm was able to handle mixed data, hence preserve the topological structure of the data. Compared to KSOM, GSOM, and ViSOM, this GViSOM has able to reveal the structure of the data accurately.
Furthermore, ViSOM was introduced by Yin [10] in the year 2002, to solve the data cluster structures in visualization, where the shape of the clusters are often distorted. This algorithm implemented the inter-neuron distance with a parameter to control the map resolution. The computational complexity is also simpler even when it handles training or new data. However, the ViSOM was derived from heuristic. The Probabilistic Regularized SOM (PRSOM) was proposed by Wu and Chow [11] to improve the visualization effect. The cost function is used for weight updating, and this is predefined before the training process. On the other hand, Hadzic and Dillon [12] proposed a Continuous Self-Organizing Map (ContSOM) to extract the input data pattern. The connection weights are replaced by ranges, to influence the change in weight updates process and also in competition phase; to determine the best matching unit. On the other hand, the Concurrent Self-Organizing Map (ConcSOM) classifier was proposed by Emil et al. to detect the changes in remote sensing images [13] and recognize the automatic target in SAR images[14]. The ConcSOM is able to classify images accurately compared to Multilayer Perceptron Neural Network (MLP-NN), Support Vector Machine (SVM) and Principle Component Analysis (PCA).
3.0 PROPOSED METHODOLOGY
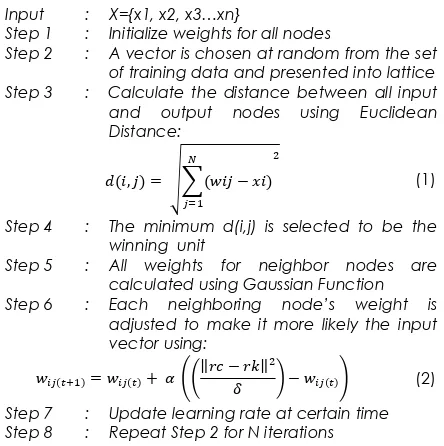
the distance between cluster nodes in the topographic map. These nodes are arranged in the two-dimensional lattice, and each of the nodes is fully connected to input nodes in the input layer. The distance between these nodes is calculated using Euclidean Distance. Usually, the Euclidean Distance is used to measure the distance in the plane using (1) [16], [17].
Input : X={x1, x2, x3…xn}
Step 1 : Initialize weights for all nodes
Step 2 : A vector is chosen at random from the set of training data and presented into lattice Step 3 : Calculate the distance between all input
and output nodes using Euclidean Distance:
𝑑(𝑖, 𝑗) = √∑(𝑤𝑖𝑗 − 𝑥𝑖)
𝑁 𝑗=1
2
(1)
Step 4 : The minimum d(i,j) is selected to be the winning unit
Step 5 : All weights for neighbor nodes are calculated using Gaussian Function Step 6 : Each neighboring node’s weight is
adjusted to make it more likely the input vector using:
𝑤𝑖𝑗(𝑡+1)= 𝑤𝑖𝑗(𝑡)+ 𝛼 ((
‖𝑟𝑐 − 𝑟𝑘‖2
𝛿 ) − 𝑤𝑖𝑗(𝑡)) (2)
Step 7 : Update learning rate at certain time Step 8 : Repeat Step 2 for N iterations
Figure 1 The Original KSOM Algorithm
It is shown in many kinds of research that this algorithm is capable of clustering various data sets into desired groups or categories. Even though all data is clustered and grouped into the corrected cluster, the data is scatteredly mapped onto the lattice. Hence, every cluster is located close to each other, and it has caused some issues, such as overlapped cluster and nonlinearly separable problem.
Because of the Euclidean Distance has only calculated the distance between nodes, the overlapped clusters are formed. For some data sets, this issue is crucial, where the number of dislocated data that form the overlapped clusters are many and this has led to a separation problem amongst clusters.
Therefore, to produce better results and to reduce the problem mentioned, we propose a modification to the existing KSOM algorithm. Figure 2 shows the flow process of the proposed methodology. The modification is based on pheromone approach in Ant Colony Algorithm, and it is called Pheromone-Density Measure (PDM) [18] and this is shown in (3). The PDM also uses the Euclidean Distance to calculate the distance between objects, but it has some additional parameters in it.
Figure 2 The original ksom flow process
Figure 3 The proposed methodology flow process
𝑓(𝑖) = 1
𝛿2 ∑ (1 −
𝑑(𝑖, 𝑗)
𝛼 )
𝑁
𝑖=1
(3)
Euclidean Distance, and it calculates the distance between objects. N is the number of samples or instances in the data set. However, the other processes in this proposed algorithm are retained as the original KSOM algorithm.
If Euclidean Distance calculates the distance between the objects, the PDM focuses on the average distance between the objects, and this is shown in (3)[19][20]. Even though both objects are considered similar (based on the distance calculated by Euclidean Distance), they are not necessarily the same species. This is because the calculated distance is only a distance between two objects. However, by measuring the average distance of the current object with all neighbors will help the KSOM to find the most similar cluster species, accurately. In this case, if the value of
f(i) is small, it shows that the current object is similar with
the surrounding objects in its neighbors, and vice versa.
4.0 RESULTS AND ANALYSIS
The main reason KSOM is selected to cluster all these four data sets is because of its ability to reveal and visualize the hidden pattern of these data sets. Iris, Seeds, Glass and Wisconsin Breast Cancer Database, are among standard categorical data sets that are usually used in testing and validating the proposed algorithm in many types of research. Therefore, several experiments have been conducted to investigate the effectiveness of this modified KSOM algorithm. The results are then compared with the original KSOM results for every dataset.
From the experiments, the KSOM was seen able to cluster all data sets into the desired clusters; Iris (3 groups of clusters), Seeds (3 groups of clusters), Glass (2 groups of clusters) and Wisconsin Breast Cancer Database (2 groups of clusters). Figure 4 shows the results for Iris data set using both algorithms. The KSOM algorithm has produced three groups of clusters, which represent the species of Iris; Setosa, Versicolor, and Virginica. However, the data is scatteredly mapped on the topological map, and the boundaries amongst the clusters are difficult to identify. All clusters are closely located, and there exist some overlapped clusters, due to feature similarity. However, the modified KSOM was able to cluster the data set into three clusters successfully, with a clear separation boundary, even though the cluster for Versicolor and Virgnica are located next to each other.
(a) (b)
Figure 4 The results for Iris data using (a) Original KSOM and
(b) Modified KSOM
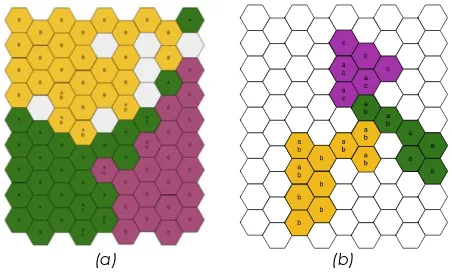
While, for Seeds data set, KSOM has also clustered this data into three types of Seeds; Kama, Rosa and Canadian (as shown in Figure 5). Compared to KSOM, the modified KSOM are able to refine the three clusters, where the data are closely located in one small cluster. However, there are a few overlapped clusters for all types of seeds. This is shown in Figure 4 (b).
(a) (b)
Figure 5 The results for Seeds data using (a) Original KSOM
and (b) Modified KSOM
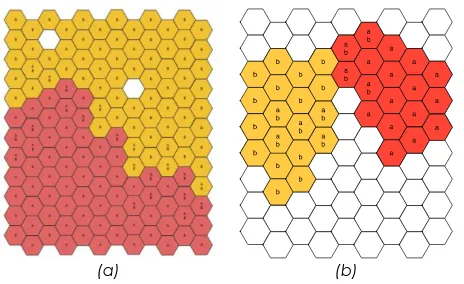
(a) (b)
Figure 6 The results for Glass data using (a) Original KSOM
and (b) Modified KSOM
(a) (b)
Figure 7 The results for Wisconsin Breast Cancer Database
data using (a) Original KSOM and (b) Modified KSOM
Conclusively, the modified KSOM algorithm has improved the result by refining the data scatterings during the clustering process. The separation boundary amongst clusters can clearly be seen, where data with similar features and in the same categories or species are located in one area or groups.
5.0 CONCLUSION
The KSOM algorithm has succeeded in clustering and solving complex problems in many areas, especially when they involve high dimensional data. However, this KSOM algorithm is incapable of handling the feature similarity problem efficiently; which leads to the scattered distribution of data in the clustering results. Thus, the modification of the distance measurement in KSOM algorithm using pheromone approach from Ant Colony Optimization helps to cluster the datasets efficiently. All data with similar features are closely grouped and located in one cluster. While the other dissimilar data are clustered in another cluster, separately. However, even though all datasets clustered correctly, there are a few overlapped clusters in the results and the separation boundaries between clusters are still very close. Furthermore, this modified algorithm will be fine-tuned to improve the clustering
result and reduce the overlapped cluster, hence improve the cluster’s separation boundary.
Acknowledgement
The authors would like to thank Malaysia-Japan International Institute of Technology (MJIIT) for funding this research project thru a research grant with vote number 10H9.
References
[1] R. Rojas. 1996. Unsupervised Learning and Clustering Algorithms. in Neural Networks. 99–121.
[2] J. a Kangas, T. K. Kohonen, and J. T. Laaksonen. 1990. Variants of self-organizing maps. IEEE Trans. Neural Netw. Berlin: Springer Berlin Heidelberg. Jan 1990. 1(1): 93–9. [3] T. Kohonen. 2000. Self-organizing Maps of Massive Document
Collections. In Neural Comput. New Challenges Perspect. New Millenn. Proc. IEEE-INNS-ENNS Int. Jt. Conf. Neural Networks. 2: 3–9.
[4] V. Emamian, M. Kaveh, and A. H. Tewfik. 2003. Robust Clustering of Acoustic Emission Signals Using the Kohonen Network. EURASIP J. Appl. Signal Processing. 3: 276–286. [5] V. Emamian, M. Kaveh, and a. H. Tewfik. 2000. Robust
clustering of acoustic emission signals using the Kohonen network. IEEE Int. Conf. Acoust. Speech, Signal Process. Proc. 6: 3891–3894.
[6] K. Lagus, T. Honkela, and S. Kaski. 2000. WEBSOM for Textual Data Mining. 345–364.
[7] E. A. Uriarte and F. D. Martín. 2005. Topology Preservation in SOM. 19–22.
[8] S. Negri and L. A. Belanche. 2001. Heterogeneous Kohonen networks. In Connectionist Models of Neurons Learning Processes and Artificial Intelligence. 6th International WorkConference on Artificial and Natural Neural Networks IWANN 200. 243–252.
[9] H. Merdun. 2010. Self-organizing Map Artificial Neural Network Application in Multidimensional Soil Data Analysis. [10] H. Yin. 2002. ViSOM - A Novel Method for Multivariate Data
Projection and Structure Visualization. IEEE Trans. Neural Netw. 13(1): 237–43.
[11] S. Wu and T. W. S. Chow. 2005. PRSOM: A New Visualization Method by Hybridizing Multidimensional Scaling and Self-Organizing Map. IEEE Trans. Neural Networks. 16(6): 1362– 1380.
[12] F. Hadzic and T. S. Dillon. 2005. CSOM: self-Organizing Map for Continuous Data. In Industrial Informatics. 3rd IEEE International Conference on, 2005 INDIN '05. 740-745. [13] V. Neagoe, S. Member, R. Stoica, and A. Ciurea. 2014.
Concurrent Self-Organizing Maps for Supervised / Unsupervised Change Detection in Remote. IEEE J. Sel. Top. Appl. Earth Obs. Remote Sens.. 7(8): 3525–3533.
[14] V. E. Neagoe, S. V. Carata and A. D. Ciotec. 2015. Automatic Target Recognition in SAR Imagery Using Pulse-Coupled Neural Network Segmentation Cascaded With Virtual Training Data Generation CSOM-based classifier. Geoscience and Remote Sensing Symposium (IGARSS), 2015 IEEE International, Milan. 3274-3277.
[15] T. Kohonen. 1982. Self-Organized Formation Of Topologically Correct Feature Maps. Biol. Cybern. 69: 59–69.
[16] Banerjee, C. Krumpelman, and R. J. Mooney. 2005. Model-Based Overlapping Clustering. In Proceedings of the eleventh ACM SIGKDD International Conference On Knowledge Discovery In Data Mining (KDD '05). ACM, New York, NY, USA. 532-537.
[17] S. Maps and T. Kohonen. 1996. New Developments and Applications of. 1: 164–172.
Ant Colony. J. Comput. Apr 2010. 5(4): 598–605.
[19] J. Handl and B. Meyer. 2002. Improved Ant-Based Clustering and Sorting in a Document Retrieval Interface. 913–923. [20] J. Handl, J. Knowles, and M. Dorigo. 2004. Strategies for the
Increased Robustness of Ant-Based Clustering. in Engineering Self-Organising Systems. Berlin: Springer Berlin Heidelberg. 90-104.
[21] Bohari, Z. H., Ghani, S. A., Baharom, M. F., Nasir, M. N. M., Jali,