Colloidal effects of acrylamide polyampholytes. Part 1, Electrokinetic behavior
21
0
0
Full text
(2) Keywords: Adsorption, colloidal titrations, polyampholytes, amphoteric polymers, streaming current, isoelectric, pH, salt. 1. Introduction. Part 1 of this series1 considered colloidal aspects of certain high-mass acrylamide-based polyampholyte terpolymers, similar to those that have been used by the paper industry to increase the strength of fiber-to-fiber bonding. The charged nature and various colloidal attributes of the polyampholytes were found to depend on pH, salt concentration, and the molar ratio of cationic to anionic groups. The present article considers how changes in these conditions affect the terpolymers’ ability to adsorb onto cellulosic fibers. A motivating question concerns whether the main colloidal behavior of this type of macromolecules, including their adsorption only cellulosic fibers, can be explained in terms of their net charge. In other words, is it necessary to consider both positive and negative groups to understand the effects of such polymers? In addition to the scientific significance of this issue, our work is also motivated by a need to increase the efficiency of chemical treatments designed to enhance the dry-strength of paper.2 This need has become increasingly important with the increased recycling of paper. Various polyelectrolytes, including cationic starch,3-4 copolymers of acrylamide,5-6 and sequential addition of positively and negatively charged additives7 have been used to overcome deficiencies in the wetted fibers’ ability to bond to each other when the paper is dried. Amphoteric terpolymers, which also can be added to the fibrous suspension in a paper mill,8 represent an additional option to increase paper strength. Aspects of polyelectrolyte adsorption onto cellulosic fibers recently were reviewed by. 2.
(3) Wågberg,9 who paid particular attention to some recent advances.10-11 These articles document success in accounting for effects of charge densities, salt concentrations, pH, and other variables on the adsorbed amounts and conformations of polyelectrolytes, especially those that contain only a single type of charged group. For example, it has been shown that the adsorption of polyelectrolytes onto surfaces of opposite charge frequently are maximized when the charge density of the polyelectrolyte is quite low,12 a circumstance that often favors a three-dimensional conformation of the polyelectrolyte in the adsorbed state.11,13-15 Increased levels of salt addition typically result in increased adsorbed amounts, though the adsorption usually falls again or is effectively eliminated at very high levels of electrical conductivity of the solution.16 Adsorption characteristics of polyampholytes have been considered in various theoretical17-20 and experimental studies.21-22 Although the theoretical studies using a mean-field approach18 have arrived at conclusions that are slightly different from the data treated by Monte Carlo simulations,20 most of the predictions are in agreement with experimental results. Their predictions coincide with the fact that polyampholyte chains tend to collapse and precipitate at their iso-electric pH, and addition of salt can lead to the expansion of the collapsed state. Furthermore, it has been predicted that even neutral and similarly charged polyampholytes can adsorb onto charged surfaces. These characteristics are unique to polyampholytes and are not observed in simple polyelectrolytes.. 2. Experimental The polyampholytes considered in this work were the same as those used in Part 1.1 As described earlier, the monomer units used in the preparation were acrylamide, N,Ndimethylaminoethyl acrylate (cationic monomer), and itaconic acid (anionic monomer), and the. 3.
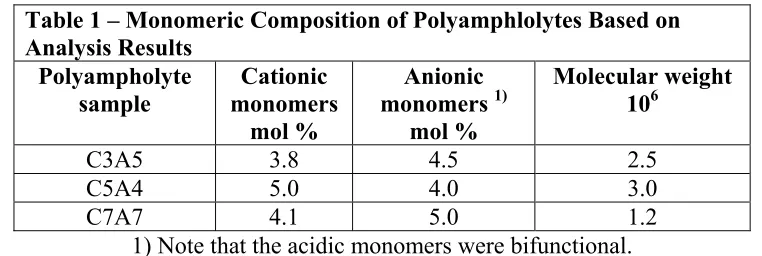
(4) contents of cationic and anionic monomer units are shown in Table 1. All the samples were provided by Harima Chemicals, Inc. Table 1 – Monomeric Composition of Polyamphlolytes Based on Analysis Results Polyampholyte Cationic Anionic Molecular weight 1) sample monomers monomers 106 mol % mol % C3A5 3.8 4.5 2.5 C5A4 5.0 4.0 3.0 C7A7 4.1 5.0 1.2 1) Note that the acidic monomers were bifunctional. The cellulosic fibers used in the experiments described were obtained from conventional bleached hardwood (HW) kraft pulp, which was supplied in the form of dry-lap sheets. Pulp disintegration and refining were carried out according to TAPPI Method T248. A batch of 30.0 oven-dry grams of HW pulp sheet was soaked in 2000 mL of deionized water for more than 4 hours. The soaked sheet was disintegrated for 15,000 revolutions (revs). The slurry was drained and the total mass was adjusted to 300 g (10% consistency). It was refined with a PFI mill for 5000 revs. The refined pulp was diluted to 2000 mL with deionized water and disintegrated for 15,000 revs (CSF 400 mL). Fines were removed form the pulp by using a modification of TAPPI Test Method T233. Different conditions (sample amount, flow rate, and time) were used. Each 30 g oven-dry subbatch of pulp was put in the final container of a Bauer-McNett classifier, which was fitted with a 100-mesh screen. Tap water was allowed to flow at 6 L/min for 30 min. The fines-free fibers (72 % retained, percent fines measured by the Fiber Quality Analyzer (FQA): 2.5 % based on arithmetic amounts, 0.4 % based on length-weighted amounts) were taken from the container. The selected criterion for fines, when running tests with the FQA, was anything smaller than 0.2 mm that still was detectable by the equipment. The tap water was replaced with deionized water.. 4.
(5) The resulting Canadian Standard Freeness of the fines-free suspension was 680 mL. The consistency was adjusted to 0.5 % with deionized water. The procedure used to determine adsorbed amounts of adsorbed polyampholytes was based on the principles of colloidal titration23 and streaming current analysis.24 However, based on results that were shown in Part 1, the new procedure also involved pH adjustments to convert the polyampholytes into either their fully cationic or fully anionic forms. For those experiments in which the amine groups were used for quantification, the pH was adjusted to 3.0 with HCl, after sufficient sodium sulfate had been added to achieve a solution conductivity of 1000 µS/cm prior to pH adjustment. For experiments based on the carboxyl content of the polyampholytes, the pH was adjusted to 11 with NaOH, in the presence of the same background electrolyte. Both pH and conductivity of the fines-free pulp slurry (consistency 0.5 %) were adjusted by addition of NaOH or H2SO4. The 0.1 % PAM solution also was adjusted to the same values of pH and conductivity as the slurry. 200 g of the slurry was placed in a 250 mL glass beaker. The slurry was stirred with a mechanical stirrer at a given speed (default value = 500 rpm). A given amount of PAM solution was added to the slurry (1 % of fiber). The mixture was stirred for a given time (5 min). The slurry was filtered with 400-mesh screen. The amount of PAM copolymer in the filtrate was determined by colloidal titration. The pH of the filtrate was adjusted to 3.0, and the conductivity was adjusted to 2000 µS/cm with Na2SO4. 10 mL of the sample was placed in the measuring cell of a Mütek particle Charge Detector (PCD 03 pH) and 0.001N PVSK solution was added slowly until the streaming current value reached zero. The amount of the titrant added was thus recorded. This value was compared with that of a blank test, in which no fiber was used, allowing the calculation of the adsorbed amount of PAM.. 5.
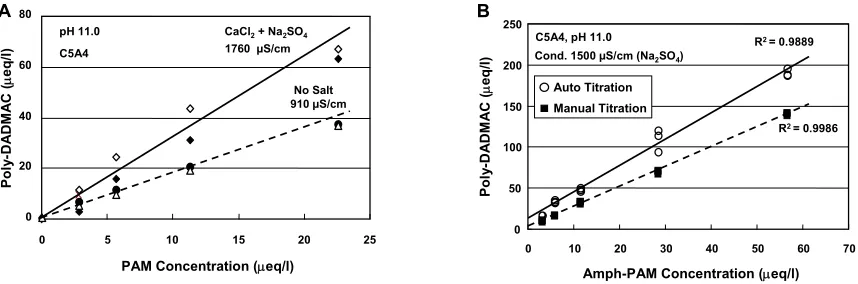
(6) 3. Results and Discussion 3.1. Method Development The first goal was to develop a new method for the quantification of polyampholyte concentrations in solution. Such a test was needed in order to later determine adsorbed amounts, based on concentrations of amphoteric polymers remaining in solution, compared to suitable control tests. Baseline calibrations were carried out at a conductivity of 1000 µS/cm and a pH of 5.3 with the titrants used in streaming current (SC) tests. Solutions of poly-vinylsulfate, potassium salt (PVSK), with concentrations ranging between zero and 35 µeq/L, were titrated with polydiallyldimethylammonium chloride (poly-DADMAC). Results were highly linear with PVSK concentration, yielding an R2 value of 0.999 for the linear regression of the SC endpoint values. These results are consistent with previous work with polyelectrolytes, showing an approximately 1:1 stoichiometry of charged groups, especially under conditions of relatively low ionic strength.25-27 More importantly, the stoichiometry of the endpoints did not depend on the initial concentration of the sample, within the range of this study. 3.2 Calibration Tests at pH 11 The idea behind carrying out titrations at pH 11 was to ensure that essentially all of the carboxyl functions were in their ionized form, whereas essentially all of the amino groups were in their respective neutral form. The polyampholyte sample C5A4 was selected for purposes of method development.1 Fig. 1 (A), shows that the ratio of poly-DADMAC to polyampholyte, at the streaming current endpoints, depended on the concentration of monomeric electrolytes. Better reproducibility was obtained in the case where no salts were added, other than those. 6.
(7) originally present in the polyampholyte products. The endpoint values increased linearly with increasing polyampholyte concentration in the initial solution. Titration results were more scattered when they were carried out in the presence of an additional 100 ppm calcium chloride plus sufficient sodium sulfate to bring the final electrical conductivity to 1760 µS/cm after the pH adjustment. B. 80. 60. pH 11.0. CaCl2 + Na2SO4. C5A4. 1760 µS/cm. Poly-DADMAC (µeq/l). Poly-DADMAC (µeq/l). A. No Salt 910 µS/cm. 40. 20. 250. C5A4, pH 11.0. R2 = 0.9889. Cond. 1500 µS/cm (Na2SO4). 200. Auto Titration 150. Manual Titration R2 = 0.9986. 100 50. 0 0. 5. 10. 15. 20. 0. 25. 0. PAM Concentration (µeq/l). 10. 20. 30. 40. 50. 60. 70. Amph-PAM Concentration (µeq/l). Fig. 1. Concentrations of poly-DADMAC at the titration endpoint corresponding to the initial amphoteric polyacrylamide (sample C4A4) concentrations at pH 11: (A) Effect of different salt concentrations; (B) Effect of different titration procedures. Preliminary titrations suggested that the scatter of data shown in Fig. 1 (A) might be at least partly due to the time needed to obtain a steady streaming current signal. This possibility was evaluated by comparing results of relatively rapid titrations, using an auto-titrator, with manual titrations in which streaming current signals were observed 5 minutes after each addition of titrant. A typical automatic titration took approximately 1 to 2 minute to complete, while a typical manual titration took 20 to 40 minutes. Figure 1 (B) shows a new series of experiments in which the slower rate of titration yielded results that were consistently different. For reasons of relatively high linearity and reproducibility, the manual titration method was thus selected for further work involving adjustment of pH to 11. Periods of conformational adjustment in the range of almost zero to 30 seconds have been suggested in a recent review.28. 7.
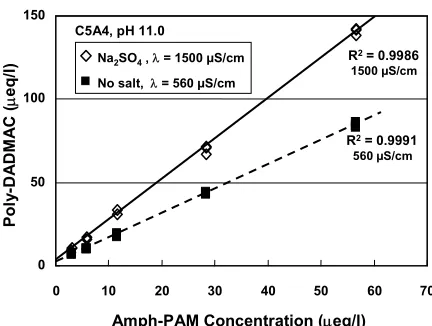
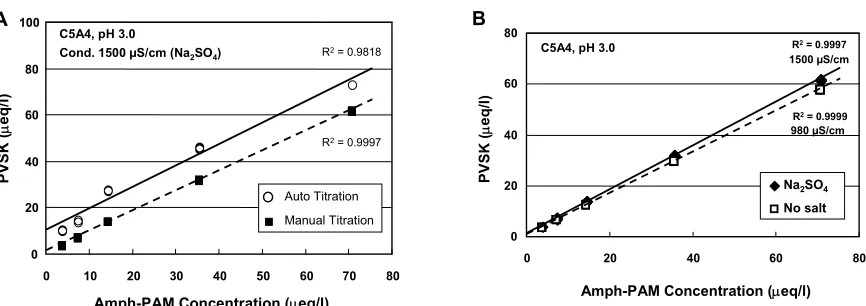
(8) 150. Poly-DADMAC (µeq/l). C5A4, pH 11.0 R2 = 0.9986. Na2SO4 , λ = 1500 µS/cm. 1500 µS/cm. No salt, λ = 560 µS/cm. 100. R2 = 0.9991 560 µS/cm. 50. 0 0. 10. 20. 30. 40. 50. 60. 70. Amph-PAM Concentration (µeq/l). Fig. 2. Concentrations of poly-DADMAC at the titration endpoint corresponding to the initial amphoteric polyacrylamide (sample C4A4) concentrations at pH 11 in different salt concentrations using the manual titration method Using the manual titration method just described, the conditions represented in Fig. 1 (A) were then repeated. As shown in Fig. 2 the main trends agreed with Fig. 1 (A), but the reproducibility was improved, as shown by the high values of the coefficients of determination. 3.3 Calibration Tests at pH 3 Figure 3 (A) shows the results of automatic and manual titrations with PVSK carried out at pH 3 (conditions intended to convert the polyampholytes into their most fully cationic form). Data from the auto-titration showed some of the same non-linear tendencies apparent in the upper curve of Fig. 1 (A). Again, the manual titration involved more efficient utilization of the titrant.. 8.
(9) A. 100. B. C5A4, pH 3.0. 80. Cond. 1500 µS/cm (Na2SO4). R2 = 0.9997. C5A4, pH 3.0. R2 = 0.9818. 1500 µS/cm. 80. PVSK (µeq/l). PVSK (µeq/l). 60. 60 R2. = 0.9997. 40 Auto Titration. 20. R2 = 0.9999. 980 µS/cm. 40. Na2SO4. 20. No salt. Manual Titration 0. 0. 0. 0. 10. 20. 30. 40. 50. 60. 70. 80. 20. 40. 60. 80. Amph-PAM Concentration (µeq/l). Amph-PAM Concentration (µeq/l). Fig. 3. Concentrations of PVSK at the titration endpoint corresponding to the initial amphoteric polyacrylamide (sample C4A4) concentrations at pH 3: (A) Effect of different titration procedures; (B) Effect of salt. Figure 3 (B) shows that titrations carried out at pH 3 were less affected by salt, compared to the pH 11 data shown in Figs. 1 (A) and 2. Based on the excellent linearity and reproducibility of these data, the condition represented by the upper curve was selected for all of the adsorption experiments that are to follow. The reason for adding background electrolyte was to reduce the relative change in ionic strength that results from ions that enter the mixture with the titrant solution during the course of a titration. Up to this point, all of the data shown have involved just one of the three polyampholyte samples considered. Figure 4 compares the calibration curves for polyampholytes having three different monomeric compositions. Since the titrations represented in the figure were carried out at pH 3, one would anticipate the results to depend on the content of amine groups in each product. Based on an assumption that the stoichiometry of interactions between the titrant anionic groups and the amine groups on the samples, the relative positions of the plotted curves were in the same order as predicted by the NMR analyses reported in Part 1.1. 9.
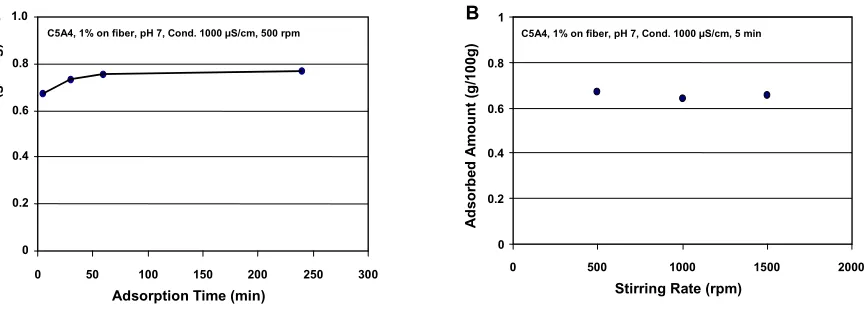
(10) 100. pH 3.0, 1500 µS/cm (Na2SO4). PVSK (µeq/l). 80. C5A4 C3A5. 60. R2 = 0.9997. C7A7. 40 R2 = 0.9998 20 R2 = 0.9987 0 0. 20. 40. 60. 80. 100. 120. Amph-PAM Concentration (µeq/l). Fig. 4. Concentrations of PVSK at the titration endpoint corresponding to the initial amphoteric polyacrylamide concentrations at pH 3 using different polyacrylamide products. 3.4 Results of Adsorption Experiments In view of the demonstrated significance of the titration rate, it is reasonable to expect that the adsorbed amount of polyampholyte onto cellulosic fibers may depend on the time of mixing. Figure 5 shows such an effect, but it also shows that the adsorbed amount already had reached about 90% of its plateau value after 5 minutes. Subsequent tests were carried out at the same five-minute mixing condition. A. B. 1.0. 1 C5A4, 1% on fiber, pH 7, Cond. 1000 µS/cm, 5 min. Adsorbed Amount (g/100g). Adsorbed Amount (g/100g). C5A4, 1% on fiber, pH 7, Cond. 1000 µS/cm, 500 rpm. 0.8. 0.6. 0.4. 0.2. 0.8. 0.6. 0.4. 0.2. 0. 0 0. 50. 100. 150. 200. 250. 0. 300. 500. 1000. 1500. Stirring Rate (rpm). Adsorption Time (min). Fig. 5. Adsorption of the amphoteric polyacrylamide onto cellulosic fibers. (A) Effect of adsorption time. (B) Effect of stirring rate.. 10. 2000.
(11) Rates of adsorption from solution sometimes are limited by slow convection or diffusion from the bulk solution onto the surfaces.28 To examine this possibility, experiments were repeated at different rates of agitation with an impeller stirrer. As shown in Fig. 5 (B), such variations in stirring rate did not affect the adsorbed amounts. The adsorbed amounts shown in Fig. 5 were higher than might be expected based on a simple model of flat macromolecular adsorption. While the fiber surface area was not evaluated in the present study, past studies based on hydrodynamic flow resistance,29 as well as on nitrogen adsorption,30-31 suggest values in the range of 0.5 to 2 m2 per gram of fiber. The use of BET data, which involve dried fibers, can be justified for evaluation of external area. The very small pores that are subject to closure upon drying are not expected to be readily accessible to highmass polymers such as used in the present study. Based on the upper end of the described range, results in Fig. 5 imply an adsorbed amount of ca. 4 mg/m2. This is about twenty times higher than the values obtained in a study of polyelectrolyte monolayer adsorption onto molecularly smooth cellulose.32 On this basis it can be concluded that the polyampholytes maintained a three-dimensional structure upon adsorption. Multi-layer adsorption and colloidal deposition cannot be ruled out as alternative explanations.. 3.5 Effect of Salt Effects of increasing salt (sodium sulfate) are shown in Fig. 6. The fact that adsorption increased with increasing electrical conductivity is an example of what has been called “ordinary polyelectrolyte behavior”.16 In other words, the results are consistent with a trend towards less extended molecular conformations with increasing shielding of charged groups within. 11.
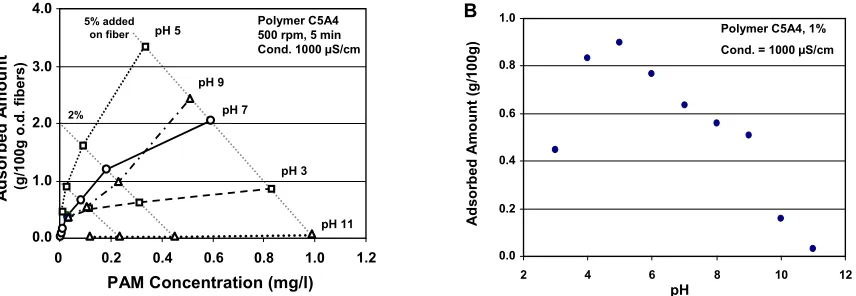
(12) polyelectrolytes by monomeric ions. Under some conditions polyampholytes swell with increasing salt, presumably due to a weakening of intra-molecular associations between charged groups,33 an effect that is especially anticipated in the case of interactions of block copolymer polyampholytes. The fact that the present results are better described by ordinary polyelectrolyte considerations suggests that the degree of ion pairing within a given molecule did not change greatly at the selected ionic conditions. Though it has been suggested that ions pairs within a polyampholyte molecule may be effectively unavailable for interaction,34 the results in Fig. 6 do not provide a sufficient basis to judge this issue.. Adsorbed Amount (g/100g). 1 C5A4, 1% on fiber, pH 7, 5 min, 500 rpm. 0.8. 0.6 0.4. 0.2. 0 10. 100. 1000. Conductivity (µS/cm). Fig. 6. Adsorption of the amphoteric polyacrylamide onto cellulosic fibers: Effect of conductivity. 3.6 Effects of pH Figure 7 shows data from adsorption experiments carried out at different pH values, with the titrations performed after adjustment of the filtrate pH to 3. Part (A) of the figure presents the adsorbed amounts relative to the final concentrations in solution. The most efficient adsorption was observed at pH 5. Also, it is apparent that the plateau adsorption values were not yet reached under the conditions of testing (except possibly at the extreme pH values of 3 and 11). Values of adsorbed amounts above 2% are noteworthy in light of the fact that fiber fines. 12.
(13) had been removed from the fiber suspension (see Experimental), a procedure that is expected to reduce the overall surface area per unit mass of cellulosic materials.35-36 Even in the presence of fiber fines, other papermaking additives such as cationic starch usually do not adsorb efficiently onto fibers at quantities greater than 2%.37 5% added on fiber. B. Polymer C5A4 500 rpm, 5 min Cond. 1000 µS/cm. pH 5. Adsorbed Amount (g/100g). 4.0. (g/100g o.d. fibers). Adsorbed Amount. A. 3.0 pH 9 pH 7. 2%. 2.0. pH 3. 1.0. pH 11. 0.0 0. 0.2. 0.4. 0.6. 0.8. 1.0. 1.0. Polymer C5A4, 1% Cond. = 1000 µS/cm. 0.8. 0.6. 0.4. 0.2. 0.0. 1.2. 2. PAM Concentration (mg/l). 4. 6. 8. 10. 12. pH. Fig. 7. Adsorbed amounts of amphoteric polyacrylamide C5A4 onto cellulosic fibers at various pH values: (A) As a function of final polymer concentration. (B) As a function of pH at the 1% level of polymer addition. Figure 7 (B) shows data from adsorption tests carried out with the same polyampholyte sample over a range of different pH values. As shown, the maximum adsorption took place at a pH of 5, which was a little lower than the iso-electric pH. As the pH was increased, the adsorbed amount decreased gradually up to about pH 9, and then it fell rapidly. The decrease in adsorbed amount also was relatively abrupt as the pH was decreased below 5 to yet lower values. To understand the data of Fig. 7, note that three different types of charged groups are expected to govern adsorption under such circumstances. In addition to the carboxyl and amino groups on the polyampholyte molecules, one also needs to consider carboxyl groups that mainly determine the charged nature of bleached kraft fibers in aqueous media.38 The latter provide a net negative charge suitable for adsorption of net cationic polymers. However, the pKa value of such surface-bound carboxyl groups is expected to be near to 4.4. Since even the maximum charge density at the surfaces of bleached kraft fibers already is quite low,39 it is reasonable to. 13.
(14) expect the charge density of the fibers to become a limiting factor in adsorption, especially as the pH is decreased below the pKa value of those groups. On the other hand, as pH is increased above 5, the majority of carboxyl groups already are expected to be in their negative, carboxylate form. As shown in Part 1 of this series, the predominant pKb value of the amine groups in the polyampholytes under consideration was approximately 9. Thus, a steep fall-off in adsorption at pH values higher than 9 is consistent with increasing neutralization of the amine groups on the polyampholyte. The iso-electric point of the polyampholyte examined here was 6.0, as measured in the previous study. In a pH range above 6.0, both the polyampholyte and fibers are expected to be negative in net charge. However, the polyampholyte still had an ability to adsorb onto similarly charged fibers. This result coincides with a recent theoretical study with regard to adsorption of polyampholytes on charged surfaces.19 Though the results in Fig. 7 may be rationalized in terms of simple adsorption of individual solubilized macromolecules, one cannot rule out a mechanism in which polyampholytes form unstable colloidal aggregates that subsequently precipitate onto the cellulosic surfaces. As shown in Part 1 of this series,1 the turbidities of polyampholyte aqueous mixtures were maximized and the viscosities were minimized in the neighborhood of the isoelectric pH. These results suggest a tendency towards a globular macromolecular conformation and relative insolubility in water at the isoelectric pH. Hence, relative insolubility can be used as a further way to explain the effect of pH on the adsorbed amount of polyampholyte. A colloidal deposition mechanism of adsorption also helps to reconcile the relatively high adsorbed amounts, relative to what would be expected for a flat adsorbed monolayer.. 14.
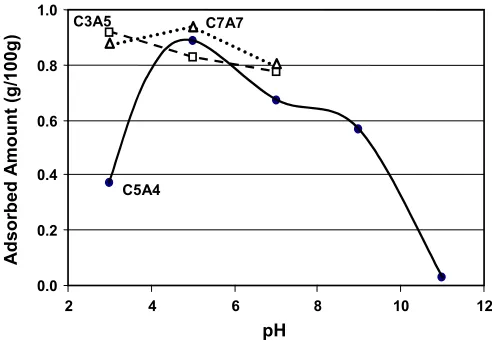
(15) Figure 8 shows results that are closely related to those in Fig. 7, except that a fresh batch of hardwood fibers was used. Excellent agreement was obtained between the results shown for the C5A4 sample in Figs. 7 and 8. For the other two polyampholyte samples no results are shown above pH 7 because the SC endpoints were not sufficiently distinct. The most important differences between the respective polyampholyte samples were observed at a pH value of 3. Surprisingly, the adsorbed amounts did not correspond in a clear way to the respective cationic charge densities of the adsorbing polymers. Rather, the trend is roughly consistent with how the polymers interacted with PVSK at pH 3, as was shown in Fig. 4. Again, such results suggest that charge interactions are not the only factor governing the stoichiometry of interaction. Rather, future work should also consider structural factors such as details that pertain to random or block polymer distributions of different polyampholyte samples. To rationalize the contrasting results corresponding to pH=3 in Fig. 8, it is useful to note that sample C5A4 was the most cationic of the three polyampholytes, having the highest ratio of basic to acidic groups. The negative charge of cellulosic fibers becomes weaker with decreasing pH.38-39 Thus, it is reasonable to expect adsorption of C5A4 at pH=3 to be limited by a build-up of positive charge. The findings in Fig. 8 also help to support one of the conclusions of Part 1.1 Namely, it is reasonable to expect that adsorptive interactions of polyampholytes are dominated by polymer segments located towards the outer edges of a dissolved macromolecule, and charged groups within the interior of a polyampholyte have a tendency toward 1:1 stoichiometric interactions. These tendencies can be expected to amplify the effects of differences in ratios of basic to acidic groups.. 15.
(16) Adsorbed Amount (g/100g). 1.0. C3A5. C7A7. 0.8. 0.6 0.4. C5A4. 0.2. 0.0 2. 4. 6. 8. 10. 12. pH. Fig. 8. Adsorption of the amphoteric polyacrylamide onto cellulosic fibers using different polyampholytes. 4. Conclusions 1. A new procedure for streaming current (SC) titrations was found to be effective for quantifying solution concentration of amphoteric acrylamide-based terpolymer samples. Measurements at high pH (aimed at detecting only the carboxyl functional groups) and low pH (aimed at detecting only the amine functional groups) were in excellent agreement with each other. 2. Increased accuracy of SC titrations involving the polyampholytes was achieved when using a longer equilibration time, rather than using a typical automatic titration rate, consistent with relatively slow macromolecular rearrangements. 3. Adsorbed amounts of the polyampholytes onto cellulose tended to be maximized near to, but not quite equal to their iso-electric points. Maximum adsorption favored conditions where the net charge of the polyampholyte was relatively low and opposite in sign to that of the substrate surface.. 16.
(17) 4. Polyampholytes with negative net charge also adsorbed onto negatively charged fibers, though at lower amounts compared to cases in which the net charges were opposite.. Acknowledgements. The authors wish to acknowledge the support of the National Research Initiative of the USDA Cooperative State Research, Education and Extension Service, grant number 2004-35504-14655. The acrylamide-based polyampholyte samples were provided by Harima Chemicals, Inc. of Osaka, Japan. Financial support by Harima for graduate educational support is gratefully acknowledged. The authors are indebted to an anonymous reviewer for suggesting an adsorption mechanism based on the deposition of destabilized colloidal associations of polyampholyte molecules.. References [1]. T. Sezaki, M.A. Hubbe, D.S. Argyropoulos, Colloidal effects of acrylamide polyampholytes. Part 1. Electrokinetic behavior, Colloids Surf. A ___ (200_) _____________.. [2]. H. Tanaka, Strength development from polymer additives for paper, Japan Tappi J. 48 (1994) (5) 16-24.. [3]. R.C. Howard, C.J. Jowsey, The effect of cationic starch on the tensile strength of paper, J. Pulp Pap. Sci. 15 (1989) J225-J229.. [4]. D. Glittenberg, Starch alternatives for improved strength, retention, and sizing, Tappi J. 76 (1993) (11) 215-219.. [5]. G. Carlsson, T. Lindström, C. Söremark, The effect of cationic polyacrylamides on some dry strength properties of paper, Svensk Papperstidn. 80 (1977) (6): 173-177.. [6]. C.E. Farley, Polyacrylamide dry strength resin applications, Tappi Proceedings: Papermakers Conf. 1986, 147-150.. [7]. M.E. Carr, B.T. Hofreiter, M.I. Schulte, C.R. Russell, A starch polyampholyte for paper, Tappi 60 (1977) (10) 66-69.. 17.
(18) [8]. H. Tanaka, K. Suzuki, R. Senju, Preparation of cationic polymers and their applications. Part 3. Effects of the partially aminated polyacrylamides on the improvement of paper strength, Japan Tappi J. 30 (1976) 492-500.. [9]. L. Wågberg, Polyelectrolyte adsorption onto cellulose fibers – a review, Nordic Pulp Paper Res. J. 15 (2000) 586-597.. [10]. M.R. Böhmer, O.A. Evers, J.M.H.M. Scheutjens, Weak polyelectrolytes between two surfaces: adsorption and stabilization, Macromolecules 23 (1990) 2288-2301.. [11]. G.J. Fleer, M.A. Cohen-Stuart, J.M.H.M. Scheutjens, T. Cosgrove, B. Vincent, B., (Eds.), Polymers at Interfaces, Chapman and Hall, London, 1993, pp. 343-375.. [12]. R.W. Davison, R.E. Cates, Electrokinetic effects in papermaking systems – theory and practice, Paper Technol. Ind. 16 (1975) (2) 107-114.. [13]. L. Ödberg, S. Sandberg, S. Welin-Klintström, H. Arwin, Thickness of adsorbed layers of high molecular weight polyelectrolytes studied by ellipsometry, Langmuir 11 (1995) 2621-2625.. [14]. S.A. Sukhishvili, S. Granick, Polyelectrolyte adsorption onto an initially-bare solid surface of opposite electrical charge, J. Chem. Phys., 109 (1998) 6861-6868.. [15]. K. Vermohlen, H. Lewandowski, H.D. Narres, M.J. Schwuger, Adsorption of polyelectrolytes onto oxides – the influence of ionic strength, molar mass, and Ca2+ ions, Colloids Surf. A 163 (2000) 45-53.. [16]. T. Lindström, L. Wågberg, Effects of pH and electrolyte concentration on the adsorption of cationic polyacrylamides on cellulose, Tappi J., 66 (1983) (6) 83-85.. [17]. J.-F. Joanny, Adsorption of a polyampholyte chain, J. Phys. II 4 (1994) 1281-1288.. [18]. A.V. Dobrynin, M. Rubinstein, J.-F. Joanny, Adsorption of a polyampholyte chain on a charged surface, Macromolecules 30 (1997) 4332-4341.. [19]. A.V. Dobrynin, S.P. Obukhov, M. Rubinstein, Long-range multichain adsorption of polyampholytes on a charged surface, Macromolecules 32 (1999) 5689-5700.. [20]. M.O. Khan, T. Åkesson, B. Jönsson, Adsorption of polyampholytes to charged surfaces, Macromolecules 34 (2001) 4216-4221.. [21]. F. Ozon, J.-M. di Meglio, J.-F. Joanny, Adsorption of polyampholytes on charged surface, Eur. Phys. J. E 8 (2002) 321-330.. 18.
(19) [22]. J. Yoshizawa, A. Isogai, F. Onabe, Analysis and retention behavior of cationic and amphoteric starches on handsheets, J. Pulp Paper Sci. 24 (1998) 213-218.. [23]. H. Terayama, Method of colloidal titration (A new titration between polymer ions), J. Polym. Sci. 8 (1952) 243-253.. [24]. P.H. Cardwell, Adsorption studies using a streaming current detector, J. Colloid Interface Sci. 22 (1966) 430-437.. [25]. J. Chen, J.A. Heitmann, M.A. Hubbe, Dependency of polyelectrolyte complex stoichiometry on the order of addition. 1. Effect of salt concentration during streaming current titrations with strong poly-acid and poly-base, Colloids Surf. A 223 (2003) 215230.. [26]. S.H. Tse, The effects of ionic spacing and degree of polymerization on the stoichiometry of polyelectrolyte interactions in dilute aqueous solutions, Ph.D. Diss., Inst. Paper Chem., Appleton, WI, 1979.. [27]. P. Haronska, J. Kötz, B. Philipp, Interpretation of the deviation of simplex stoichiometry from 1:1 ratio, Acta Polymerica 40 (1989) 110-112.. [28]. A. Swerin, L. Ödberg, Some aspects of retention aids, in: C.F. Baker (Ed.), The Fundamentals of Papermaking Materials, Vol. 1, Pira, Leatherhead, UK, 1997.. [29]. W.L. Ingmanson and B.D. Andrews, The effect of beating on filtration resistance and its components of specific surface and specific volume, Tappi 42 (1959) 29-35.. [30]. W.R. Haselton, Gas adsorption by wood, pulp, and paper. 2. The application of gas adsorption techniques to the study of the area and structure of pulp and the unbonded and bonded area of paper, Tappi 28 (1955) 716-723.. [31]. R. Marton and J.D. Robie, Characterization of mechanical pulps by a settling technique, Tappi 52 (1969) 2400-2406.. [32]. O.J. Rojas, M. Ernstsson, R.D. Neuman, P.M. Claesson, X-ray photoelectron stectroscopy in the study of polyelectrolyte adsorption on mica and cellulose, J. Phys. Chem. B 104 (2000) 10032-10042.. [33]. A.B. Lowe, N.C. Billingham, S.P. Armes, Synthesis and properties of low-polydispersity poly(sulfopropylbetaine)s and their block copolymers, Macromolecules 32 (1999) 21412148.. [34]. E. Gruber, T. Ott, Determination of ionic groups in cationic pulps – colorimetric analysis of polyelectrolyte titration, Papier 49 (1995) (6) 289-296.. 19.
(20) [35]. J. Marton, The role of surface chemistry in fines-alum interactions; in fines-cationic starch interactions, Tappi 63 (1980) (2) 121-125; (4) 87-91.. [36]. J. Marton, Practical aspects of alkaline sizing: alkylketene dimer in mill furnishes, Tappi J. 74 (1991) (8) 187-191.. [37]. J. Marton, T. Marton, Wet end starch: adsorption of starch on cellulosci fibers, Tappi 59 (1976) (12) 121-124.. [38]. G. Bygrave, P. Englezos, Fiber charge from potentiometric titration of kraft pulp and donnan equilibrium theory, Nordic Pulp Pap. Res. J. 13 (1998) 220-224.. [39]. J.A. Lloyd, C.W. Horne, The determination of fiber charge and acidic groups of radiata pine pulps, Nordic Pulp Paper Res. J. 8 (1993) 48-52, 67.. 20.
(21) FIGURE CAPTIONS Fig. 1. Concentrations of poly-DADMAC at the titration endpoint corresponding to the initial amphoteric polyacrylamide (sample C4A4) concentrations at pH 11: (A) Effect of different salt concentrations; (B) Effect of different titration procedures. Fig. 2. Concentrations of poly-DADMAC at the titration endpoint corresponding to the initial amphoteric polyacrylamide (sample C4A4) concentrations at pH 11 in different salt concentrations using the manual titration method Fig. 3. Concentrations of PVSK at the titration endpoint corresponding to the initial amphoteric polyacrylamide (sample C4A4) concentrations at pH 3: (A) Effect of different titration procedures; (B) Effect of salt. Fig. 4. Concentrations of PVSK at the titration endpoint corresponding to the initial amphoteric polyacrylamide concentrations at pH 3 using different polyacrylamide products. Fig. 5. Adsorption of the amphoteric polyacrylamide onto cellulosic fibers. (A) Effect of adsorption time. (B) Effect of stirring rate. Fig. 6. Adsorption of the amphoteric polyacrylamide onto cellulosic fibers: Effect of conductivity. Fig. 7. Adsorbed amounts of amphoteric polyacrylamide C5A4 onto cellulosic fibers at various pH values: (A) As a function of final polymer concentration. (B) As a function of pH at the 1% level of polymer addition. Fig. 8. Adsorption of the amphoteric polyacrylamide onto cellulosic fibers using different polyampholytes.. 21.
(22)
Figure
+5

Related documents
Fourth, each individual mRNA (cDNA) may have different functions when it is pre- sent alone and when it is accompanied by its sibling mRNAs and/or intron-derived regulatory
Bioleaching at different initial pH and ferrous ion (Fe 2+ ) concentrations were carried out, and electrochemical behavior of LiCoO 2 dissolution was examined to study the effect
The pH of a buffer solution depends upon the pK a or pK b of the acid or base and the ratio of the initial concentrations of the?. salt/acid or
Frequency bands in satellite communications Types of satellite communication networks List of useful WEB pages for satellite information Potential marine application of
Another meditation teacher, who has facilitated meditation teachers training, has also worked with vulnerable populations in San Francisco including those with psychiatric
The developed greenness-duration irrigated area model performs with an improved level of skill, compared to the widely accepted method of using single date imagery to
Recurrent mutations in GNAQ, GNA11, CYSLTR2, PLCB4, BAP1, EIF1AX, and SF3B1 are described as well as non-random chromosomal aberrations.. Chromothripsis is a rare event in which
The effect of different initial concentrations of ampicillin on photocatalytic degradation was considered using concentrations in the range between 30 and 70 ppm with
