CHAUDHARI, KAUSTUBH ONKAR. Closed-Loop Non-Invasive Brain Stimulation and Recording Solution. (Under the direction of Dr. Flavio Frohlich and Dr. Alper Bozkurt).
Electroencephalography (EEG) is a monitoring method to record spontaneous electrical
activity in the brain. Even though it has a low spatial resolution, it is used to diagnose brain
disorders like sleep disorders, coma, encephalopathies and brain death and most often used to
diagnose epilepsy which causes abnormalities in EEG readings. The hardware costs for EEG are
significantly lower than those of most other techniques, so it provides a pretty good solution in
high traffic hospitals and is required to diagnose disorders like epilepsy which are mostly present
in developing countries. Many past and current studies have tried to perfect ways to detect,
diagnose or monitor Epileptic EEG in patients. Although, there are many EEG devices available
in the market, most of them are bulky or they are not built to record continuously for a long duration
of time. So, for prolonged research, treatment and diagnosis it is necessary to develop new EEG
devices which can be used to monitor the EEG from patients or users for a long time and which
can be easily manufactured on a large scale for hospitals and areas where it is needed the most.
This thesis tries to tackle this requirement by providing an EEG monitoring solution which fulfills
these requirements while consuming minimal resources.
This thesis also contributes to the field of closed loop brain stimulation by modifying a
transcranial current stimulation device to move on from the traditional direct current and
alternating current stimulation to performing stimulation based on different fundamental
parameters of the stimulated region by using a custom-made waveform with a trigger from an
by
Kaustubh Onkar Chaudhari
A thesis submitted to the Graduate Faculty of North Carolina State University
in partial fulfillment of the requirements for the degree of
Master of Science
Computer Engineering
Raleigh, North Carolina 2019
APPROVED BY:
_______________________________ _______________________________ Dr. Alper Bozkurt Dr. Flavio Frohlich
Co-Chair of Advisory Committee Co-Chair of Advisory Committee
ii
Kaustubh Onkar Chaudhari received the B.E. degree in Electronics and communication
Engineering from Shri Ramdeobaba College of Engineering and Management in 2016. In the fall
of 2017, he joined the graduate program in Electrical and Computer Engineering department to
pursue M.S. in Electrical and Computer Engineering specializing in VLSI design and embedded
systems with a focus in medical device design. From the spring 2018 he began working towards
developing and advancing devices in Neuro-tech as a research assistant in Dr. Flavio Frohlich’s
lab. He also worked as an FPGA design Intern developing part of a brain implant during his
iii
ACKNOWLEDGEMENTS
I would like to thank my supervisor Dr. Flavio Frohlich for providing me the opportunity to work
with him and the Frohlich Lab. He has provided me support and guidance as I progressed towards
the completion of my Master’s degree. I would also like to thank the Frohlich Lab members,
especially Sangtae Ahn who I got to work with and get valuable advice from. I would like to thank
the committee members, Dr. Alper Bozkurt and Dr. Alexander Dean for their time, valuable
feedbacks and comments. I would like to give a special thanks to Dr. Alper Bozkurt for showing
iv
TABLE OF CONTENTS
LIST OF TABLES ... vi
LIST OF FIGURES ... vii
Chapter 1 INTRODUCTION...1
1.1 Motivation ...1
1.2 Objective ...5
Chapter 2 EEG MONITORING DEVICE DEVELOPMENT ...6
2.1 Device Components ...6
2.1.1 EEG Sampling Frontend ...8
2.1.2 ‘EASE’ Module ...15
2.1.3 Docking Station ...16
2.2 System Architectures ...16
2.2.1 ‘EASE’ Module Architecture ...20
2.2.2 Docking Station Architecture ...24
2.3 Hardware Interfacing and Design ...29
2.3.1 Interfacing and Design Choices ...29
2.3.2 Circuit Description ...32
2.4 Result ...35
Chapter 3 NON-INVASIVE BRAIN STIMULATION DEVICE DEVELOPMENT ..47
3.1 Device Components ...47
3.2 Device Architecture ...49
3.3 Result ...67
REFERENCES ...70
APPENDIX ...76
Appendix A Programs Used ...77
A.1 Program for ATMEGA328PB on the ‘EASE’ Module ...77
A.1.1 ‘main.ino’ ...77
A.1.2 ‘gpio.h’ ...80
A.2 Programs for Raspberry Pi on the Docking Station ...81
A.2.1 ‘main.py’ ...81
A.2.2 ‘./rtc/settime.py’ ...84
A.2.3 ‘./sdsrcmod/main.c’ ...86
A.2.4 ‘./sdsrcmod/mmcbb.c’ ...89
A.3 Programs used for analysis of the Recorded Data ...90
A.3.1 ‘multipleanalysis.m’ ...90
v
vi
LIST OF TABLES
Table 2.1 TGAM Specifications ... 9
vii
LIST OF FIGURES
Figure 1.1 Changes in EEG signal during onset of Epileptic seizure ... 2
Figure 1.2 Alpha-Stim custom stimulation waveform ... 4
Figure 2.1 Block diagram of the EEG monitoring system ... 7
Figure 2.2 Think Gear ASIC Module Front and Back ... 8
Figure 2.3 TGAM frequency response for input 30sec, 2mV peak to peak signals ... 11
Figure 2.4 TGAM recorded signal in time, 30sec 2Hz ... 11
Figure 2.5 Records of the Berger rhythm made with pad electrodes on the head (vertex and occiput), with the subjects sitting with the eyes closed ... 12
Figure 2.6 Frequency response for 30 sec eyes closed occipital lobe data using TGAM ... 13
Figure 2.7 Recorded, low pass filtered signal at 50Hz for eyes closed occipital lobe data using TGAM ... 13
Figure 2.8 Frequency response of TGAM over 0.1Hz – 140Hz input ... 14
Figure 2.9 EEG System Architecture ... 17
Figure 2.10 EEG System Flowchart ... 19
Figure 2.11 EASE module flowchart ... 23
Figure 2.12 Docking Station flowchart ... 28
Figure 2.13 EASE module GPIO and support circuitry ... 32
Figure 2.14 EASE module peripherals, Real Time Clock, Level Converter and SD housing ... 33
Figure 2.15 EASE module connector for headset and Docking Station ... 35
Figure 2.16 EASE module front view ... 37
Figure 2.17 EASE module back view ... 37
Figure 2.18 Docking Station with the 14-pin header ... 38
viii
Figure 2.20 Reference and ground electrodes connected to the ear with a clip ... 39
Figure 2.21 Modified NeuroSky’s Mindwave headset to use the TGAM directly ... 39
Figure 2.22 EEG system’s response with applied signal at 7Hz frequency at ±1mVp ... 40
Figure 2.23 EEG system’s response with applied signal at different frequencies at ±500uVp . 41 Figure 2.24 EEG system’s maximum error response for signals applied at ±10uVp ... 41
Figure 2.25 EEG system’s maximum error response for signals applied at ±50uVp ... 42
Figure 2.26 EEG system’s maximum error response for signals applied at ±100uVp ... 42
Figure 2.27 EEG system’s response for unfiltered eyes closed occipital lobe data ... 43
Figure 2.28 EEG system’s current consumption over time... 44
Figure 3.1 XCSITE 100, by Pulvinar Neuro ... 48
Figure 3.2 XCSITE 100 System Architecture ... 51
Figure 3.3 XCSITE 100 software flow ... 53
Figure 3.4 XCSITE 100 main state machine ... 56
Figure 3.5 Applied custom waveform ... 67
Figure 3.6 Output custom waveform result ... 68
Figure 3.7 Output custom waveform with a different time-base ... 69
Figure B.1 EASE Module Front Layout ... 95
Figure B.2 EASE Module Back Layout... 96
Figure B.3 Docking Station Header Front Layout ... 97
1
CHAPTER 1
INTRODUCTION
1.1. Motivation
Electroencephalography (EEG) is a monitoring method to record electrical activity in the
brain. EEG is a record of spontaneous activity in the brain over a period of time, which cannot be
localized to a few neurons [INTR1] [INTR2]. Even though it has a low spatial resolution and it
cannot precisely measure neural activity, it is used to diagnose brain disorders like sleep disorders,
coma, encephalopathies, brain death and most often used to diagnose epilepsy which causes
abnormalities in EEG readings [INTR3]. Epilepsy is a common, deadly brain disorder; for
example, as of 2015 about 39 million people had epilepsy [INTR5], and it resulted in around
125,000 deaths [INTR6]. The hardware costs for EEG are significantly lower than those of most
other techniques [INTR4], because of which it provides a cost-effective solution in high traffic
hospitals. EEGs are also having very high temporal resolution because of relatively higher
sampling frequencies for noninvasive monitoring techniques [INTR7]. EEG is also relatively
tolerant of movement, although it does cause artifacts, they can be minimized using various
methods available. Because of various advantages EEG is an effective multifaceted, versatile
solution to diagnose patients with brain disorders. Especially when considering 80% of the
Epilepsy cases occur in developing countries [INTR8], a cost-effective method like EEG to
monitor or diagnose a brain disorder like Epilepsy would prove very beneficial.
There are many studies that have been done and many that are being done for perfecting
2
[INT11] [INT12]. And there are new techniques emerging which are making use of artificial
intelligence and machine learning for the same cause [INTR9] [INT13]. Fig 1.1 shows an Epilepsy
seizure marker where we can see how the EEG suddenly changes as soon as there is an onset of
seizure [INTR9].
Figure 1.1 Changes in EEG signal during onset of Epileptic seizure [INTR9].
Similarly, while there are many EEG devices in the market, most of them are either bulky
EEG devices or the devices which are not exactly built to record for a long duration of time
continuously. For example, let’s consider devices which could be used for conducting a big study
which would mean the devices have to be comparatively cheaper and be able to provide research
3
[INT14]. It requires a single AAA battery, but runs for 8 hours at a time. Moreover, the module
cannot store data locally, it can simply acquire the EEG data and transmit it via Bluetooth. The
output signal is of research grade quality, but in order to record and analyze the data it requires
mindset research tools which cost more than 10 times the device itself [INT15]. Another such
device is EMOTIV Insight 5 [INT16]. This device samples at 128 sample per second, with a
14-bit resolution which is sufficient getting research grade EEG data. The frequency response is
0.5-43Hz which is in a good range considering brainwave analysis. Built in sinc filter, input range goes
to 8400uVpp. The module again only transmits the data at 2.4GHz band or with Bluetooth. It has
an inertial measurement unit for user motion tracking which is also a great option for tracking user
movements during the recording. But it can again run only for 4 hours only on Bluetooth and 8
hours on 2.4GHz transmitter with a 480mAh built in lithium polymer battery. So, this device would
need external components again to record and store the data.
So, if there was a research study which needed to monitor patient/subject EEG for a long
duration of time going on for days after a new treatment or for diagnosing, the patient or the subject
would need to switch batteries or charge the devices often and that would mean extra care is
required for the device along with intermittent data collection which wouldn’t be such a great
experience. Along with that they might need another device or media to record the EEG data since
most of the devices available are simply EEG acquisition devices and need external recording
equipment like a Bluetooth connected device. So, it appears there is a need for devices which can
acquire and store the data while keeping the power consumption under control so they can be used
for a long time without needing a battery change.
Closed-loop brain monitoring systems also involve brain stimulation techniques such as
4
uses constant, low direct current delivered via electrodes on the head for brain stimulation [INT17].
tDCS works by changing the neuron’s resting membrane potential to depolarize or hyperpolarize
based on whether a positive or negative stimulation is applied causing the neurons to either fire
spontaneously or reduce the spontaneity respectively. Similarly, transcranial alternating current
stimulation or tACS is a form of neurostimulation that delivers a small, pulsed, alternating current
via electrodes on the head [INT18]. Both of these techniques have been promising for treatment
of some brain disorders. But there are some concerns coming up about the adverse effects of these
techniques. As [INT19] notes, the persistent events associated with tCS consist of skin lesions
similar to burns, which can arise even in healthy subjects, and mania or hypomania in patients with
depression. One paper discussed in the review reported a pediatric patient presenting with seizure
after tDCS, although the connection between stimulation and seizure hasn’t been made for this
particular case. But rarely devices or research talk about stimulating with custom waveform
different from the normal DC or AC stimulation waveforms. One such device is Alpha Stim
[INT20] which shows promise for pain relief and depression treatment.
5
1.2. Objective
The devices discussed in this thesis mainly targets the points presented above while trying
to keep the system open ended so it can be integrated with other system at the same time. So, the
main objectives for the EEG monitoring system are:
1. The device should be able to perform long term EEG monitoring with research grade EEG.
2. The device should be cost effective, or at least be able to be easily built and distributed.
3. The device should be portable and less bulky.
4. The device should be easy to set up and use and shouldn’t require any expert knowledge.
Designing a system with these criteria would enable us to achieve goals such as getting a
large amount of EEG user data which can facilitate algorithm development and testing; long term
monitoring of clinical trial participants with an experimental treatment; long-term monitoring or
diagnosing patients with brain disorders and studying effects of certain techniques for teaching or
studying by monitoring data from a lot of users. These goals and objectives for the EEG monitoring
system are visited in the chapter 2.
The brain stimulation platform being developed and modified here is on already present
tACS/tDCS hardware, so the main objective regarding this device is to first get the required custom
waveform stimulation output and keep a hardware trigger so that either the EEG monitoring system
or any other system can be used to trigger the stimulation platform based on its own signal
processing technique/hardware. The non-invasive brain stimulation platform is visited in the
chapter 3.
6
CHAPTER 2
EEG MONITORING DEVICE DEVELOPMENT
2.1. Device Components
The main functions of the device designed here is to obtain user EEG, record it and store
it or send it to a common storage location. Since this device is different from the stimulation
platform, and only deals with the frontend of EEG storage, it should obtain reliable EEG data with
low error, while keeping the power consumption, data overhead, user intervention low for
continuous usage.
The device consists of two main parts which combine together with the “Docking Station”
(DS) to form the final working system. The two main parts are the “EEG Acquisition and Storage
Equipment” (EASE) unit and the headset unit which contains the “ThinkGear ASIC Module”
(TGAM). The EASE unit is the offline data recorder for user EEG which can be battery operated
and which the user can carry around with them. The headset unit is the frontend of EASE unit and
forms the EEG acquisition equipment as it is used to sample and digitize the EEG signal. The
Docking Station unit is used to parse the recorded data and store it in MATLAB MAT file format
to be easily analyzed and stored/uploaded to the main server. The Docking Station has been
implemented until the analysis and storage so that the server upload can be integrated with a system
7
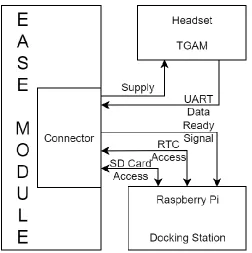
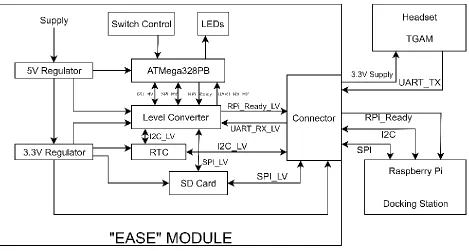
Figure 2.1 Block diagram of the EEG monitoring system.
Fig 2.1 shows the block diagram for the system, with the interconnections between the
EASE module, TGAM unit and the Docking Station. A brief description for the parts of this system
shown in the diagram, the EASE module consists of the battery-operated device which also powers
the headset. The headset containing the TGAM unit samples the user EEG and performs some
operations on it and sends the data out via Universal Asynchronous Receiver/Transmitter (UART)
protocol. The storage unit or the EASE module consists of a micro-controller which obtains the
EEG data from the serial output from the TGAM module and stores it to a micro-SD card. After
that, at the end of the storage cycle or when the user wants all the locally recorded data to be parsed
and stored, the EASE module is connected to the Docking Station and the data is parsed and stored
in the MAT format and then can be uploaded to the main server. More details about the device
8 2.1.1. EEG Sampling Frontend
The goal of the EEG sampling frontend was to obtain reliable research grade with easy to
wear electrodes and as low development time as possible. With this goal in mind the ThinkGear
ASIC Module was selected as the sampling frontend. The TGAM is NeuroSky’s primary
brainwave sensor ASIC module designed for mass market applications. The TGAM processes and
outputs EEG frequency spectrums according to established brainwave bands, EEG signal quality,
raw EEG, and three NeuroSky eSense meters attention, meditation, and eyeblinks. The module
works well with simple dry electrodes, and has a low rated power consumption, which is suitable
for portable battery-driven applications like the system planned here [TGAM1]. The EEG
sampling frontend or the headset consists of the TGAM module which performs the analog
sampling of the EEG data based on the placement of EEG electrode, processes it and forms it into
a packet based on the configuration of the device and sends it as serial UART data.
Figure 2.2 ThinkGear ASIC Module Front and Back.
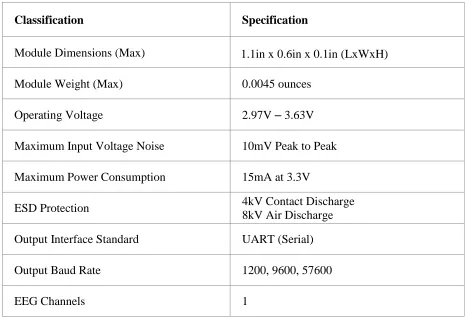
Fig 2.2 shows the TGAM unit. Some of the important specifications of the TGAM unit are
9
Table 2.1 TGAM Specifications.
Classification Specification
Module Dimensions (Max) 1.1in x 0.6in x 0.1in (LxWxH)
Module Weight (Max) 0.0045 ounces
Operating Voltage 2.97V – 3.63V
Maximum Input Voltage Noise 10mV Peak to Peak
Maximum Power Consumption 15mA at 3.3V
ESD Protection 4kV Contact Discharge 8kV Air Discharge
Output Interface Standard UART (Serial)
Output Baud Rate 1200, 9600, 57600
EEG Channels 1
The TGAM unit is small, light-weight, operates at the SD Card voltage range (SD card for
storage), and outputs data via UART which are great common characteristics for mobile device
and for easy interfacing. This is accompanied by the already present ESD protection which makes
it easier to integrate as a wearable device. The TGAM’s power consumption is low enough to be
able to use it as a battery-operated unit. Moreover, the input voltage is safe for EEG capture and
the single channel EEG input is sufficient for the long-term monitoring goals required. According
to the prescribed guidelines by the American Clinical Neurophysiology Society [TGAM3],
acquisition of EEG data onto a digital storage medium should occur at a minimum sampling rate
three times the high-frequency filter setting, to be sufficient to prevent aliasing. Digitization should
10
bits is preferable, since the recording should be able to resolve EEG down to 0.5uV and record
potentials within the range of several millivolts without clipping. The output presented by TGAM
is at 512 samples per second, which meets our frequency needs till at-least 150 Hz where the inbuilt
low pass filter is present. The maximum input noise range is set at 10mV peak to peak, but the
input sampled is allowed to be at 2mV peak to peak, which combined with 12-bit RAW EEG
resolution, gives us the ability to resolve the EEG down to 0.488uV per value.
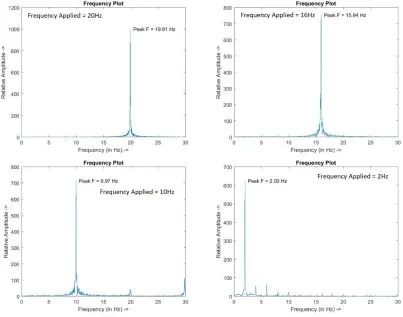
So, as we can see the TGAM meets all the specifications required for clinical EEG
monitoring. But all this wouldn’t be useful if the device isn’t able to record the signals as expected
from the input supplied. So, the device was tested with known signals from the function generator
and from occipital lobe of a user to test the expected response. Fig 2.3 shows the response given
by TGAM for a 30 second, 2 mV peak to peak sinusoidal input signal from a function generator.
The graph shows the relative amplitude at each frequency when compared with the frequency
component on other frequencies, out of which the dominating amplitude becomes the dominant
frequency which is found to be very close to the applied input. The MATLAB [ASIS1] program
used to analyze the data is included in the appendix section A.3.2. For the analysis in frequency
domain, Fast Fourier Transform (FFT) is applied to the input samples in time domain. Then the
result is normalized by dividing it with the length of the signal and wrapped up to half of the result
since the FFT result is symmetric. Fig 2.4 shows the time domain signal recorded which again
11
Figure 2.3 TGAM frequency response for input 30sec, 2mV peak to peak signals.
12
After confirming the correct signal response from function generator, a known response
from a user is checked. The known response selected here is the Berger rhythm or Alpha waves
(Alpha waves have dominating frequency component in the range of 7.5Hz - 13Hz) present in the
occipital lobe as illustrated by past studies. First demonstrated in 1929 by Hans Berger [ASIS2],
then also observed in [ASIS3] and reiterated in various other studies, the alpha waves can be
observed easily when the eyes are closed. One of the early examples of this is shown in Fig 2.5
from [ASIS3] where the recording was done with 6000Hz sampling frequency in (A) and 40 Hz
in (B) and (C), where all of the subjects had eyes closed. The resulting dominant frequency in (A)
was 9.5Hz, (B) was 9Hz and in (C) was 10.5Hz, all in alpha wave range.
Figure 2.5 Records of the Berger rhythm made with pad electrodes on the head (vertex and occiput), with the subjects sitting with the eyes closed. [ASIS3]
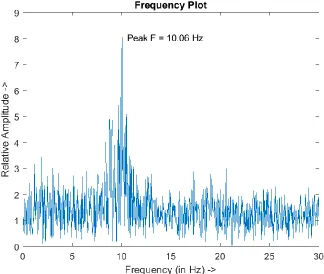
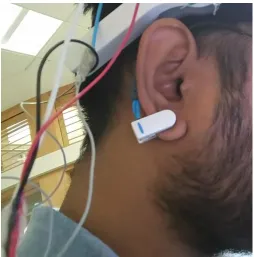
Fig 2.6 shows the frequency response from the TGAM which is obtained after connecting
the EEG electrode to the occipital lobe, while the reference and ground electrodes are connected
to the ear lobe of the subject and the data is recorded for 30 sec duration. Fig 2.7 shows the output
in time domain after a 50Hz 8th order Chebyshev type 1 low pass filter is applied to the captured
samples. From this response we can see that there is a reliable signal present which we can confirm
13
Figure 2.6 Frequency response for 30 sec eyes closed occipital lobe data using TGAM.
14
The TGAM also has inbuilt fixed band pass (or a combination of low pass and high pass
filters) and a configurable notch filter which was observed while using the device. This might
present a limitation if the fixed filters were masking a considerable amount of signal which we
need. According to the American Clinical Neurophysiology Society (ACNS) guidelines, for
standard recordings, the low-frequency filter should be no higher than 1Hz and the high-frequency
filter should be no lower than 70Hz. A low-frequency filter setting higher than 1Hz should not be
used because vital information may be lost when pathologic activity in the delta range (which has
a dominating frequency component till around 3Hz) is present. Similarly, a setting lower than 70
Hz for the high-frequency filters can distort or attenuate spikes and other pathologic discharges
into unrecognizable forms and can cause muscle artifact to resemble spikes [TGAM4]. For this a
frequency sweep across 0.1Hz – 140Hz resulted in the response shown in Fig 2.8 for TGAM.
15
As we can see from Fig 2.8, there appears to be a low pass filter around 100Hz applied
frequency and a high pass filter around 1Hz frequency, along with a notch filter at 60Hz (the
TGAM has a hardware option to change this notch filter’s frequency to 50Hz, to adjust for the
power line noise depending on the country). The frequencies applied for analysis were 0.1Hz,
0.2Hz, 0.3Hz, …, 1.7Hz, 1.8Hz, 1.9Hz, 2Hz, 4Hz, 6Hz, 8Hz, 10Hz, 20Hz, 30Hz, …, 140Hz at
100uV using a function generator. Based on the frequency response it seems that the response
given by TGAM falls under the guidelines for clinical EEG monitoring, which is why it was chosen
as the EEG sampling frontend.
2.1.2. ‘EASE’ Module
Since the frontend is dealing with the sampling of EEG signals and digitization, the primary
goal of the next component is to provide local offline storage for the sampled data coming from
the TGAM. The secondary goal is to keep track of real time which would help to track
abnormalities in EEG data or to timestamp certain events according to when they happened or
form a correlation between them. The final goal for this stage is interfacing the EASE module with
the Docking Station to provide it access to the local storage and update the time if needed. So,
keeping these goals in mind the EASE module or the storage unit needs to have a controller that
carries out the following tasks: store the data coming from UART to a widely available local
medium like a SD Card, and timestamping the data based on when the data is being stored. So, for
simplicity of the design and easy interfacing, the ATMEGA328PB controller [EASE1] is present
on the EASE module, along with a Real Time Clock (RTC) which works on Inter-Integrated
Circuit communication (I2C) [EASE2], a SD Card as the storage medium which works with SPI
16
3.3V voltage levels between the microcontroller and other peripherals. The EASE module is the
main board that the user handles and to keep the user intervention minimum there is a single switch
on the EASE module which the user has to handle along with connecting the headset to the EASE
module or connecting the EASE module to the Docking Station at the beginning of EEG capture
and at the end when the data has to be parsed and stored respectively.
2.1.3. Docking Station
The Docking Station comprises the next step where the data from the local offline storage
on the EASE module has to be downloaded, parsed and stored in an easily usable format like MAT
format [DOCK1] which can be accessed at a later stage. Taking this into consideration, the
Raspberry Pi is kept as the brain of the docking station to enable easy processing of the data and
easy upload capabilities to the common cloud storage. The Raspberry Pi in the Docking Station
connects to the Real Time Clock on the EASE module and updates it using internet time (GMT
[DOCK2]) whenever the EASE module is first connected to the Docking Station. After that it
connects to the storage element on the EASE module and downloads the recorded data stored on
it. The Docking Station is powered by a micro USB power supply which are easily available and
connects to the internet using wired connection from the modem/router.
2.2. System Architectures
The system architecture/block diagram combining the headset, EASE module and the
Docking Station are shown in Fig 2.9. The signals forming the communication between the devices
17
Figure 2.9 EEG System Architecture.
As shown in the figure, the heart of the EASE module is the ATMEGA328PB
microcontroller which handles the EASE module and its peripherals primarily. The signals coming
from this microcontroller are level translated for the Real Time Clock, SD Card and Raspberry Pi
signaling whose control also goes to the connector for the Docking Station. The incoming UART
signal from the headset connected to the connector is also level translated before sending it to the
microcontroller and the headset is also powered using the supply pins from the connector. More
hardware and interfacing descriptions are given in the next sub-chapter. The user can use the
system according to the flowchart in Fig 2.10 and as described below.
1. The battery or supply to the EASE module is turned ON and the switch on the EASE
module is turned OFF at the beginning.
2. The EASE module connector is then connected to the Docking Station connector, this
enables the Docking Station to synchronize the time on Real Time Clock to the current
18
a. If the timestamping is not necessary for the data capture.
b. If the Real Time Clock is powered by another battery like a coin cell.
c. If the current battery hadn’t been disconnected and the Real Time Clock has been
synchronized with internet time before.
3. Now, the EASE module is disconnected from the Docking Station and its connector is
connected to the headset connector and then user puts the headset on. Once the headset is
properly connected by the user, the switch on the EASE module can be turned ON. After
this switch is turned ON, the controller on the EASE module will first try to connect to the
SD card which is shown by the GREEN LED turning ON. If the connection to the SD card
fails the GREEN LED will be ON showing the microcontroller is still trying to connect to
the SD card in which case the user has to turn the switch OFF and recheck if the SD card
and the headset connector is properly connected or not then turn the switch back ON. When
the GREEN LED turns OFF and YELLOW LED turns ON, the microcontroller starts
storing the data coming from headset to the SD card.
4. The switch is kept ON till the user needs to record the data and turned OFF when the data
recording has to be finished for further processing.
5. Now, the EASE module connector is disconnected from the headset and connected to the
Docking Station connector. The Docking Station then again synchronizes the time for the
Real Time Clock on the EASE module to the current GMT, and begins trying to connect
to the SD card on the EASE module. Again, in this case, the GREEN LED on the Docking
Station connector will turn ON, and if it is ON for more than a short period of time it
indicates a connection problem with the SD card in which case the EASE module connector
19
after disconnecting EASE module from the Docking Station. Once the GREEN LED turns
OFF and YELLOW LED turns ON, it indicates the data download from the SD card has
been initiated. When the download has been finished, the YELLOW LED will turn OFF
and the EASE module can be disconnected from the Docking Station, and also that the
Docking Station has started parsing the data and storing it in MAT format which can be
later uploaded to a server. Then the flow goes back to step 3 after the EASE module is
disconnected from the Docking Station.
20 2.2.1. ‘EASE’ Module Architecture
The development of the software for the EASE module was started with the Arduino
platform and Arduino IDE [EASE4]. Later when the hardware for the first prototype was designed,
the development stayed with Arduino IDE but the hardware changed, for better integration. The
final design interfaces with the hardware blocks on the EASE module as shown in Fig 2.9, along
with the communication taking place with these peripherals by the microcontroller. From the task
assigned to the EASE module, the primary task that the microcontroller needs to handle is to
capture the data with the least packet loss possible while storing that data in the SD card at the
same time. The secondary tasks include getting the user input from the switch control, interfacing
with Docking Station, controlling the division of storage files according to recorded time and
getting timestamps from the Real Time Clock.
The program makes use of SD library which is a wrapper for the SdFat library which
provides read/write access to FAT16/FAT32 file systems (so the maximum possible size is 32GB)
on SD/SDHC flash cards, SPI library for communication with the SD card and Wire library by
Arduino for I2C peripheral access for the communication with Real Time Clock chip PCF8523
[EASE6]. The files to be recorded on the SD card are recorded till a predefined duration to properly
divide the files for easier analysis. The recording time can be supplied to the program before
compilation, it is provided in seconds and the required variables used by the program related to it
are calculated at the start. So, the program keeps track of data to be downloaded based on the
duration and the bytes of data from UART which we expect to receive. According to the
communication protocol for the TGAM [TGAM5], for the 57600 Baud UART Tx option, the
device transmits 2 packets: the RAW EEG waveform and the other packet contains the calculated
21
second, according to the sampling rate and the bytes they take for each packet are: 2 (Sync Bytes)
+ 1 (Packet Size) + 1 (Type of Data) + 1 (Size of Data, since RAW value is multiple bytes) + 2
(RAW EEG value) + 1 (Checksum) = 8. The other packet which is sent contains the signal quality
measure, different EEG bands, eSense measures developed by NeuroSky, and its total size comes
out to be 36 bytes and this packet is sent once every second. According to this, the total bytes we
receive each second are (512*8) + 36 = 4132. The UART data is captured and written to the SD
card in a block of 256 bytes at a time which can be used to measure the time passed after recording
the data. So, before compilation the number of blocks to be captured are calculated according to
the supplied file duration and the remaining bytes are captured before closing the open file. The
way these blocks are calculated is simply by multiplying the bytes per second that we receive from
the device by the capture duration and dividing it by 256 which is bytes per block in the buffer
which we store to the SD card, which will give us an integer value of blocks to calculate. After
that, we can measure how many bytes will be remaining after capturing these blocks and store that
value. For example, consider the capture duration to be 45 seconds. So, the total bytes to be
captured becomes 45*4132 = 185940, which means total blocks to be captured initially becomes
185940/256 = 726. So, the remaining number of bytes to be captured becomes 185940 - (256 *
726) = 84. So, the program captures 726 blocks of data measuring with a counter and then at the
end it captures 84 bytes before closing the file.
The high-level flow of the software/program used for the microcontroller on the EASE
module is shown in the flowchart in Fig 2.11 and described below:
1. At the beginning, all the inputs/outputs are configured and the initial output configuration
is set. The RPi_READY signal is turned OFF to show that the Docking Station can use the
22
that the device is either connected to the Docking Station or it is ready to capture EEG data
from the headset if connected. Then, the program starts polling the switch to see if it is ON
or OFF with a blocking delay of 20mS.
2. When the switch is turned ON, the program checks for a switch debounce by checking the
switch after a small delay and if it is still ON, the program proceeds to next step. So, when
the switch is confirmed to be ON, the RED LED is turned OFF and the GREEN LED is
turned ON to show that the microcontroller has started trying to initialize the SD card. If
the microcontroller wasn’t able to initialize the SD card and the switch is still ON, it again
tries to initialize the SD card. During this stage, the GREEN LED might be ON for a long
time from conditions such as the user not connecting the SD card, or a contact problem
between the SD card and the SD card housing, or a corrupt SD card, or if the EASE module
connector wasn’t connected to the headset connector. So, the user has to check for these
problems and once finished the SD card will be initialized properly.
3. After the SD card is initialized properly, the GREEN LED is turned OFF and the YELLOW
LED is turned ON indicating the start of data recording and the program moves to next
state. At the beginning the microcontroller reads the time from the Real Time Clock and
uses it to create a filename of the format “‘day’’hrs’’mins’’sec’.txt” where day, hrs, mins
and sec each take 2 characters. From this we get the final filename of 8.3 format confirming
to the FAT file system naming standards [EASE5]. The controller then opens a file with
that name for writing on the SD card. The timestamp at the time of creation along with the
format of timestamp is stored in the file at the start and the program moves to the next state.
4. Now, the microcontroller starts capturing data. The data is captured in blocks as mentioned
23
the data is captured for the capture duration limit specified at the beginning and the file is
closed to open a new file after reading the current datetime from the Real Time Clock and
the capture resumes. Whereas if the switch is turned OFF during recording, the current
block of captured data is stored in the SD card then the currently open file is closed and the
program moves to next state.
24
5. Once the capture is finished, the YELLOW LED is turned OFF and RED LED turns ON
and the RPi_READY signal is set giving control of the peripherals to the Docking Station.
The program again resumes polling the switch to be turned ON with a blocking delay of
20mS in between. When the switch is pressed, the program goes back to step 2.
The program for the EASE module is included in the Appendix section A.1.
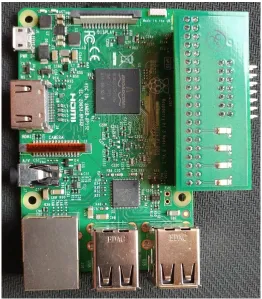
2.2.2. Docking Station Architecture
The Docking Station consists of the Raspberry Pi 3 Model B, a very small sized computer
on board and a small connector extension module which takes care of the connection between the
Raspberry Pi GPIO and the connector pins. The primary task of the Docking Station is to download
the data from the SD card on the EASE module, update the Real Time Clock on the EASE module,
parse the downloaded record data and store it in MAT format to be uploaded or to access it later.
The development of the Docking Station system is divided into 2 parts:
1. The main python program which handles data parsing, Real Time Clock updating,
some of the LED signaling for the user, and normal GPIO operations.
2. A C program for faster operation which handles all the communication and procedures
related to the SD card and the remaining LED signaling.
Since the data recorded by the EASE module is direct input from the UART signal, it has
to be parsed before it can be used for anything. So, the parsing performed on the Docking Station
takes care of that using the details of packet given in the TGAM communications protocol
document [TGAM5]. All the packets contain 2 sync bytes of value ‘0xAA’ at the start. After that,
25
comes. Then the next 4 bytes contain the payload which has the type of data coming in (‘0x80’ for
RAW EEG waveform), the size of data (which is 2 bytes for RAW EEG, since the value sent is a
12-bit signed value, so ‘0x02’) and 2 bytes for the RAW EEG waveform. After the payload comes
the checksum byte for the payload is sent and the packet finishes. The 2 bytes for the RAW EEG
waveform contain the bytes in 2’s Compliment Signed format with the incoming data being in a
big-endian format. So, the format for the packet becomes, “‘0xAA’ ‘0xAA’ ‘0x04’ ‘0x80’ ‘0x02’
D1 D2 C0” where (D1<<8+D2) form the value of the current EEG sample and C0 is the checksum.
The checksum can be calculated by summing all the bytes of the packet’s data payload, taking the
lowest 8 bits of the sum and performing the bit inverse (one’s compliment inverse) on them. Using
this packet information, the python program parses the recorded data for all the samples it can find.
For storing the data parsed in MAT format the program uses scientific python library, SciPy
[DOCK3] and for Raspberry Pi GPIO access the RPi.GPIO library is used which are both inbuilt
with stock Raspberry Pi 3 Raspbian [DOCK4] installation. The python program handling the main
control flow of the system on Docking Station is given in appendix A.2.1, the program controlling
the Real Time Clock handling is given in appendix A.2.2. The program handling the main control
flow of the Docking Station runs with the Raspberry Pi at the bootup, so the Docking Station
doesn’t need to be always ON, it can simply be turned ON when the processed data has to be stored
to a common media or uploaded.
The SD card interfacing program written here makes use of the FatFs library [DOCK5].
FatFs is a generic FAT/exFAT filesystem module for small embedded systems. It is separated from
the disk I/O layer, so it is platform independent. The SPI pin access to the FatFs library is given
with software SPI on the GPIO pins with low level GPIO access by Broadcom library. The C
26
program defining pin controls for the software SPI to use along with FatFs library using the
Broadcom BCM2835 library (pin mapping to the register addresses) are given in appendix A.2.4.
The flow of the main program controlling the execution of tasks primarily along with the
supporting SD card handling program for the Docking Station is shown in the flowchart in the Fig
2.12 and described below.
1. When the program starts, all the GPIO pins are initialized, and all the LEDs except RED
are turned OFF indicating that the device is ready to be connected. Then the program goes
in wait state, waiting for the RPi_READY pin to go low. When there is a falling edge on
this pin, the pin is again checked for being pulled to ground after a small delay in case there
was some error. If it still is pulled to ground, that means the EASE module is connected to
the Docking Station and we can go to the next stage.
2. The peripherals on the EASE module are ready to be accessed by the Docking Station. At
the start the current GMT is taken from the internet and the Real Time Clock is updated to
this time. The RED LED is turned OFF and the GREEN LED is turned ON showing that
the program is moving to try to connect to the SD card and initialize it and the program
moves to next stage.
3. The C program tries to initialize the SD card now. If the initialization fails because of no
input coming from the SD card, the SPI speed is reduced and the program tries to
reinitialize the SD card if the SD card supports slower speeds. In case nothing works till
the speed is slowed down by a lot, the SD card and the connection between EASE module
and Docking Station has to be rechecked and the EASE module reconnected. Once the
connection is successful, if the speed was reduced to initialize the SD card, the program
27
moves on with the selected speed. So, once the SD card initialization has been finished, the
GREEN LED turns OFF and the YELLOW LED turns ON indicating that the data
download is going on.
4. After establishing the connection successfully, the program takes a list of files present on
the SD card, checks for the files with extension ‘.txt’ and starts downloading them one by
one. After a file is downloaded, it is removed from the SD card since it has been stored. In
case there is a problem with the connection with SD card, the program will retry slowing
down the speed and blink GREEN LED each time it does that. In such a case that the
GREEN LED keeps blinking it shows that there is a problem with the connection with the
SD card and the download is failing. So, the process has to be restarted after checking
connection with the SD card, and the connectors and the files which were downloaded
before wouldn’t need to be downloaded again, only the ones that haven’t been finished will
be taken care of. After the complete download finishes, the YELLOW LED is turned OFF
and the BLUE LED is turned ON to signify that the data is being parsed now. Once the
YELLOW LED is turned OFF, it is safe to disconnect the EASE module from the Docking
Station and can be used right after connecting the headset to it.
5. The Docking Station starts parsing the data one by one according to all the downloaded
files it can find and stores it in MAT format. After each recorded file is parsed and stored
in MAT format, its supporting files other than the final MAT file are removed to store
space and clear unrequired clutter and so that those files don’t get processed again. After
the parsing finishes, the BLUE LED is turned OFF and the RED LED turns back ON
28
6. At the end of finishing all tasks, the program again waits for the RPi_READY signal to go
back to HIGH state. This is done since if the EASE module was still connected to the
Docking Station in OFF mode after the Docking Station finished its tasks, the RPi_READY
will be continuously pulled to HIGH and would trigger another connection procedure
which is not right. So, after waiting for the EASE module to get disconnected now the
program goes back to the top to check if the EASE module is connected by checking the
RPi_READY signal going LOW after which the program goes back to step 2.
29
2.3. Hardware Interfacing and Design
2.3.1. Interfacing and Design Choices
Similar to the programming choices, the main goal of the hardware design and interfacing
was to get the required components and program flow working with each other with as less
components as possible. The main interfacing is taken care of using only the EASE module so that
the headset and Docking Station do not need to have a big external circuit with them. Initially, the
prototypes for the EASE module were prepared using the Dual-Inline Package ATMega328P
microcontroller IC, and the final prototype makes use of the ATMega328PB with TQFP
packaging. The voltage regulators used on the EASE module are both having very low quiescent
current and dropout voltage so that the applied input voltage range is maximized and can be started
close to the regulated levels for lower battery usage. There are two voltage regulators used, first
one at 5V, LP38691-5V [HARD1] which has a dropout voltage of 45mV at 100mA current output
and a quiescent current of 55uA and it is used in TO-252 packaging to overcome any potential
heating problems there might be from continuous device operation, the second regulator is
supplied by the output from the first regulator since its input voltage range is selected lower and it
gives the output at 3.3V, ADP121-3.3V [HARD2] which has a dropout voltage of around 35mV
at 50mA current output and a quiescent current of around 22uA but these parameters do not matter
for the 3.3V regulator since it receives a stable supply from the 5V regulator so the current is
forwarded to the 5V regulator, with the dropped voltage dissipating as heat across the 3.3V
regulator based on the current consumed by peripherals connected at 3.3V.
For the ATMega328PB microcontroller on the EASE module, the basic components
required for interfacing the IC for proper working have been used such as connecting all the supply
30
capacitances, RESET pin in pull-up configuration for continuous operation, GPIO connections for
the switch and LEDs and SPI and I2C signals and the pinouts for ISP [HARD3] programming for
the microcontroller. Now, according to the technical standards for the safety of medical devices
[HARD4], there should be an isolation between the wearable medical device and the mains power
supply. Since the only places where any part of this system touches the mains power supply is at
the supply for Docking Station and supply for the battery charger, it can be completely isolated by
isolating the connection of the EASE module with the Docking Station to be only done when the
user is not using the device. In this way the possible case of electrostatic discharge through the
mains supply is removed, and for the ICs and peripherals on the device we already have some or
the other ESD protection present so they will not be damaged when the device is connected to the
Docking Station or battery charger by itself. So, the easiest way to do this without adding additional
components to the design is to keep the connector for the headset and the Docking Station
connection to be the same one. This means the EASE module can only be connected to the Docking
Station when the user takes off the headset.
Now, the connector has to connect to both the headset, where it has to supply power to the
headset (2 pins - +3.3V, GND) and take a pin for UART reception (1 pin – UART RX), and to the
Docking Station where it has to give the direct connection to the SD card using SPI pins (4 pins –
CS, SCK, MISO, MOSI), give the I2C pins (2 pins – SDA, SCL), the common ground (can be
combined with headset supply’s ground) and the RPi_READY signal (1 pin), so the total number
of pins come out to be 10. The ATMega328PB working at 16MHz can only operate at that
frequency if it is supplied 4.5-5.5V [EASE1], which is why there is a 5V regulator used for the
controller and the SD card, the Raspberry Pi GPIO signals and the TGAM can only work at 3.3V
31
so it is kept at 3.3V for matching between the peripherals and for future provision for the Real
Time Clock to have an independent battery. This means the communication signals from the
ATMega328PB need to be translated before they reach the SD card or Raspberry Pi. The incoming
or input signals work fine even if they are at 3.3V since it is within the allowed lower limit of
HIGH-level input for ATMega328PB which is given by 0.6*Vcc which comes out to 0.6*5V =
3V but it is still very close to the allowed input limit. So, a level translator is used in order to take
care of communication between 5V peripherals and 3.3V peripherals, both input and output. Now,
the system controlled by EASE module controller and the system controlled by the Docking
Station controller both need to be able to access same main components i.e. the Real Time Clock
and the SD card. Since the Real Time Clock uses the I2C line which is bidirectional, there is no
problem but same cannot be said for the SPI line where the SD card is accessed. So, if we want to
keep the ATMega continuously connected to the SD card, there might come a condition that the
user forgets to turn OFF the ease module in which case the ATMega might still be communicating
with the SD card and if in this case the EASE module is connected to the Docking Station there
can be a short circuit, but other than that the SD card and Real Time Clock access are mutually
exclusive for the EASE module and Docking Station if correct procedure is followed. For this,
there can be solutions to avert it using extra hardware switching between the controllers for the
SD card or software precautions for not letting this happen. So, instead of this, the low voltage
signals coming from the level converter from the ATMega can be simply disconnected when the
user switches from the headset to the Docking Station, since this is a task which cannot be skipped
since the connector for both of them is taken to be same. So, the only control from the pins directly
connected to the SD card are going to the connector, and from there when the headset is connected
32
goes to it, and we can avoid changes to the hardware or software which would take care of the
same condition.
The hardware design choices explained here can be seen on the circuit from the schematics
in the next section.
2.3.2. Circuit Description:
The EASE module and the Docking Station header circuits were designed for creating a
custom PCB for easy connection and communication.
33
Fig 2.13 shows the EASE module controller ATMega328PB along with its support
circuitry, the GPIO signals going out, the ISP programming header where the SPI signals are taken
out along with the RESET signal and 5V (HV) supply with ground and the two regulators used
where HV denotes the 5V output and LV denotes the 3.3V output. All the signals marked with LV
are in low voltage at 3.3V, all the signals coming out of or going to the ATMega are in 5V level,
some of which are marked HV.
Figure 2.14 EASE module peripherals, Real Time Clock, Level Converter and SD housing.
Fig 2.14 shows the SD card housing, the level converter and the Real Time Clock used on
the EASE module. As shown in the schematics, the Real Time Clock is working on the 3.3V level,
the I2C communication signals coming from it in LV are going to the level converter to be sent to
34
capacitance [HARD5], same as the default load capacitance set by the Real Time Clock chip so
the clock is matched. The battery supply pin is left open so that with future hardware updates a
local battery can be used for the Real Time Clock chip considering its low power usage, and the
alarm signal is sent to the microcontroller as an interrupt from the Real Time Clock chip in case
the day/hour/minute alarm pin interrupt functionality is used in the future software updates (The
alarm functionality can be used for deciding the record time as we saw before. The minimum
resolution is in minutes, so only a minute alarm clock can be set using the Real Time Clock
whereas with current software the record time is selected in seconds). For the SD card housing,
only the supply is directly connected, its SPI pins go to the connector. All the pins connected on
the high voltage side for the level converter go to or come from the microcontroller, whereas the
signals on the low voltage side go to or come from the connector (SPI signals, I2C lines, TX is the
signal coming from UART TX of TGAM, PI_INT is the RPi_READY signal going to raspberry
pi), also the I2C lines on the low voltage side go to the Real Time Clock too.
The common connector on the EASE module discussed according to the section 2.3.1
contains the signals shown in Fig 2.15. The signals with ‘SD_CE_LV’, ‘SD_MOSI_LV’,
‘SD_MISO_LV’, ‘SD_SCK_LV’, ‘PI_INT’, ‘SDAL’, ‘SCLL’ come from the level converter. The
‘SD_CE’, ‘SD_MOSI’, ‘SD_MISO’, ‘SD_SCK’ go directly to the SD card. So, for the connector
configuration when the headset connector is connected, the TGAM is supplied by the LV and GND
pins and its UART TX goes to the TX pin. The headset connector also connects the LV signals to
the SD card signals so that the microcontroller can access the SD card, i.e. ‘SD_CE_LV’ is
connected to ‘SD_CE’, ‘SD_MOSI_LV’ is connected to ‘SD_MOSI’, ‘SD_MISO_LV’ is
connected to ‘SD_MISO’, ‘SD_SCK_LV’ is connected to ‘SD_SCK’ and the other pins are left
35
the direct connections to the SD card, so when the Docking Station connector is connected only it
has the access to the SD card.
Figure 2.15 EASE module connector for headset and Docking Station.
2.4. Results
The system was tested both using a predefined input signal from a function generator and
also with the eyes closed occipital lobe data of a test subject. The test protocol that was followed
for testing the prototypes is as follows:
1. Setup input known signal for the EEG electrode. Provide supply for the EASE module.
2. Verify that the EASE module is OFF – its RED LED should be ON, then connect it to
Docking Station when its RED LED is ON to synchronize time for the first time. Then
disconnect the Docking Station when the Docking Station light is RED again.
3. Place the headset on the head and make sure that the electrode/gel touches the skin.
Alternatively, for testing connect the known signal from function generator to the headset’s
EEG electrode and apply the ground signal from the function generator to the reference
36
4. Turn the EASE module ON. The GREEN LED should light up for a bit then it should turn
OFF and YELLOW LED will light up indicating that data record has begun. If the module
is stuck on GREEN LED, turn it off and make sure the headset is connected properly or
the SD card is properly inserted then try again.
5. Turn OFF the EASE module when the data record has to be finished, by default the files
will be divided into 30 Sec long files, changing the value in source code will change the
record duration.
6. Disconnect the headset and connect the EASE module to the Docking Station. The GREEN
LED should light up for a bit then it should turn OFF and YELLOW LED will light up
indicating that data download has begun. If the Docking Station is still stuck on GREEN
LED, disconnect the EASE module and make sure that the SD card is properly placed in
its socket and the connection between the EASE module and Docking Station is good then
connect them again.
7. Docking Station updates the Real Time Clock time, then connects to the SD card (GREEN
LED), then downloads data from the SD card (YELLOW LED) and then it parses sample
data and saves it in MAT file format (BLUE LED) ready to be analyzed.
Fig 2.16, Fig 2.17 shows the EASE module; Fig 2.18 shows the Docking Station
(Raspberry Pi with the docking station header for easy connection to the connector); Fig 2.19, Fig
2.20 shows the connection configuration while testing occipital lobe eyes closed data; Fig 2.21
37
Figure 2.16 EASE module front view.
38
Figure 2.18 Docking Station with the 14-pin header.
39
Figure 2.20 Reference and ground electrodes connected to the ear with a clip.
40
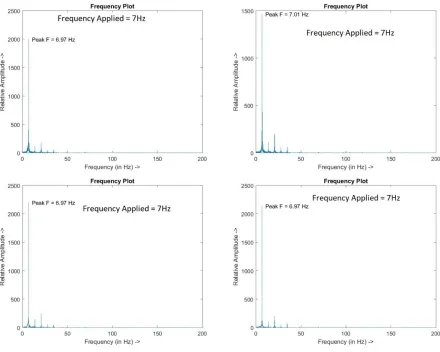
Testing the built system initially for errors found in the system’s recorded output. Fig 2.22
and Fig 2.23 show result for some of the input signal applied. Fig 2.22 contains input sinusoidal
signal with frequency 7Hz applied at ±1mVp and Fig 2.23 contains input sinusoidal signal with
different frequencies at ±500uVp. Other than this the system’s error response was tested by
applying different frequencies 2Hz, 4Hz, 6Hz, 8Hz, …, 16Hz, 18Hz, 20Hz at ±10uVp, ±50uVp and
±100uVp and taking the maximum error found for those signals as shown in Fig 2.24, 2.25 and
2.26 respectively.
41
Figure 2.23 EEG system’s response with applied signal at different frequencies at ±500uVp.
42
Figure 2.25 EEG system’s maximum error response for signals applied at ±50uVp.
43
From the maximum error responses found, it appears that the maximum error percentages
found at ±10uVp was 0.536% at 14Hz, at ±50uVp was 0.881% at 16Hz, and at ±100uVp was 0.65%
at 4Hz. From this it appears that there is not a direct relation between the applied voltage and the
maximum error found in data, so it can also be attributed to other causes. So, typical maximum
error percentage comes out to be average of 0.536%,0.881%,0.65% which is 0.689%.
Some of the responses for eyes closed occipital lobe data without any kind of external
filtering are shown in Fig 2.27.
44
The system was also tested for power consumption over time. The setup conditions were
that the device was connected to the headset which was receiving random noise signal and the data
record was continuously going on, and the supplied supply voltage to the device was at 5.05V
which is more than the minimum limit allowed by the 5V regulator. A source meter was used to
calculate and record the current consumption over time for the device at the frequency of 28
samples per second. Some part of the response found from the system has been plotted in Fig 2.28
for around 435 seconds of data. By looking at the data it doesn’t appear to have any correlation in
the current consumed over time, except for few peaks which were coming after some period of
time. Other than that, the base power consumption appears to be around 42mA and there are spikes
going up to maximum 88.3mA which could be attributed to changing the banks inside the SD card
while writing to it. After a certain amount of time the average current consumption didn’t appear
to be changing that much, and came out to be 45.869mA. So, we can say that the device consumes
45.869mAH battery on average.
Figure 2.28 EEG system’s current consumption over time.
0.04 0.05 0.06 0.07 0.08 0.09 0.1 1
349 697 1045 1393 1741 2089 2437 2785 3133 3481 3829 4177 4525 4873 5221 5569 5917 6265 6613 6961 7309 7657 8005 8353 8701 9049 9397 9745
10093 10441 10789 11137 11485 11833 12181
Curr en t Con su m ed in mA ->
45
So, according to the power calculations, the device can be run continuously for 24 hours
and it will consume around 24*45.869mAH = 1100mAH which is great considering the device
runs continuously and there are lot of battery choices such as li-po and li-ion batteries which are
available in even bigger sizes with small package size. Another analysis was run on the average
number of samples captured by the recorded files over around 50 files, and it was found to be about
15350. Since this was for 30 second data, the average should come close to 30*512 = 15360. So,
the number of sample loss comes out to be really low, the remaining samples which are lost could
be due to wrong transmission, or wrong packet entry point at the start and end of capture.
So, the system specifications found after device testing for the designed system:
1. Data record intervals: 30 Sec set by default for each file (Can be increased or decreased as
required).
2. Docking Station supply: 5V input from micro-USB power supply.
3. Minimum supply to EASE module: 5.045V.
4. TGAM input voltage range: ±1mVp.
5. TGAM input frequency characteristics observed: High pass filter around 1Hz (Inbuilt,
non-configurable), Notch filter at 60Hz (Inbuilt, externally configurable to 50Hz), low pass
filter around 100Hz (Inbuilt, non-configurable).
6. TGAM sampling rate: 512 samples per second.
7. TGAM input voltage resolution: 0.488uV.
8. TGAM Serial output baud rate: 57600 BPS.
9. TGAM Operating voltage: 2.97-3.63V.
10. TGAM Sampling inputs available: EEG Electrode (Shielding available), Reference
46
11. Typical maximum error in the recorded samples: 0.689%
12. Average current draw: 45.869mA at 5.05V supply.
13. Minimum SD card size required for continuous 24hr recording: 357 MB (8 byte for each
47
CHAPTER 3
NON-INVASIVE BRAIN STIMULATION DEVICE
DEVELOPMENT
3.1. Device Components
The work presented in this part of the thesis is an extension of previous work done by the
Pulvinar Neuro company which is a spin-off of the Frohlich lab on a non-invasive brain stimulation
platform called XCSITE-100 [STIM1]. Fig 3.1 shows XCSITE 100 which is a research grade
tDCS/tACS device that enables high-quality double-blind tDCS/tACS studies. The main goal here
was to modify the present XCSITE 100 system to be able to send custom waveform based on
researcher’s input and to present a hardware trigger to be able to start the stimulation based on
external data processing equipment without needing a manual input so that the system can be
independently run with a simple pin for triggering the stimulation. The trigger can then be used
with something like the TGAM chip to parse the incoming EEG bands or the EEG waveform,
continually process the data and start the stimulation as required on a specific EEG behavior and
to stop it as required.
The system contains the stimulation hardware and the application required to control it.
The application is a simple front end for sending configuration commands to the stimulation
hardware. The stimulation hardware platform consists of a circuit board with the microcontroller
PIC18F handling most of the peripherals on board. The task for the microcontroller is be to set up
48
current output since this is current stimulation, and monitor the stimulation parameters like output
voltage and current to detect the correct electrode placement and also to provide overvoltage or
current protection. At the same time, this device is user friendly enough to require no external
intervention other than the parameter setup to make it work properly. The XCSITE 100 also
contains sham stimulation procedure which is present to take care of placebo effect and when it is
set the device only delivers a ramp up to certain current and then ramps down from it and runs till
the end of the stimulation time set which helps to avoid placebo effect.
Figure 3.1 XCSITE 100, by Pulvinar Neuro.
The other part of the system is the application and monitoring platform which takes care
of the user interfacing. The selected method of communication between the application and the
stimulation hardware is Bluetooth, so the application makes use of Bluetooth on application device
![Figure 1.1 Changes in EEG signal during onset of Epileptic seizure [INTR9].](https://thumb-us.123doks.com/thumbv2/123dok_us/1279551.1160498/12.612.76.541.178.526/figure-changes-eeg-signal-onset-epileptic-seizure-intr.webp)
![Figure 1.2 Alpha-Stim custom stimulation waveform [INTR9].](https://thumb-us.123doks.com/thumbv2/123dok_us/1279551.1160498/14.612.168.446.459.690/figure-alpha-stim-custom-stimulation-waveform-intr.webp)