ABSTRACT
GONZALEZ, ANTONIO JOSE. An Analysis of the Effect of Artificial Disc Replacement on the Mechanical Response of the Human Lumbar Spine. (Under the direction of Dr. Andre Mazzoleni.)
The objective of this project is to develop a simplified, two-dimensional mathematical
model of the lumbar spine for the purpose of studying the behavior the lumbar spine
when affected by degenerative disc disease. Several hypothetical treatment options,
including fusion and different types of artificial disc replacements (ADR) were examined.
The cases presented consisted of three one-degree of freedom artificial discs, three
two-degrees of freedom artificial discs, one ideal three-two-degrees of freedom artificial disc, a
degenerated disc, a fused disc and a healthy spine. The equations of motion were
generated for a healthy lumbar spine using Lagrange’s equations and numerically
integrated using Matlab®. Results were obtained for all cases at two different levels,
L4-L5 and L4-L5-S1 in response to an impulsive force of 100N applied at L3 in the posterior
anterior direction. In the 1-DOF ADR cases at the L4-L5 level, the shear ADR performed
better than the other two ADR, while at the L5-S1 level, the rotational ADR performed
better than the other two ADR, and significantly better than the fused vertebrae case since
it matched the behavior of the healthy spine much more closely. All the other 1-DOF
ADR provided little or no improvement when compared to the fused case. In the 2-DOF
ADR cases, the shear rotational ADR behaved very similarly to the healthy spine when
implanted at both levels, L4-L5 and L5-S1, showing a behavior that varied by less than
1% in the posterior anterior direction and flexion extension rotation and less than 10% in
the axial displacement when compared to the behavior of a healthy spine. Overall, the
results of this thesis indicate that implanting an artificial disc to replace a damaged disc
offers more benefits for the spine than fusion since this allows the spine to behave closer
An Analysis of the Effect of Artificial Disc Replacement on the Mechanical Response of the Human Lumbar Spine
by
Antonio J. González
A thesis submitted to the Graduate Faculty of North Carolina State University
in partial fulfillment of the requirements for the Degree of
Master of Science
Mechanical Engineering
Raleigh, NC
2007
APPROVED BY:
________________________________ _____________________________
Dedication
Biography
Acknowledgements
Table of Contents
List of Figures ... vii
List of Tables ... xi
1 Introduction... 1
2 Intervertebral Discs ... 3
3 Artificial Discs ... 7
4 Procedure ... 10
4.1 Mathematical Model ... 10
4.1.1 Physical Description ... 10
4.1.2 Assumptions... 12
4.1.3 Equations of Motion ... 12
4.1.4 Impulsive Force Input ... 15
4.2 Matlab Simulations ... 16
4.3 Excel Data Manipulation ... 19
5 Results... 21
5.1 One Degree of Freedom Artificial Discs ... 22
5.1.1 L4 – L5 Level Degeneration ... 22
5.1.2 L5 – S1 Level Degeneration ... 27
5.2 Two Degree of Freedom Artificial Discs... 33
5.2.1 L4 – L5 Level Degeneration ... 33
5.2.2 L5 – S1 Level Degeneration ... 39
5.3 Three Degree of Freedom Artificial Disc ... 44
5.3.1 L4 – L5 Level Degeneration ... 44
5.3.2 L5 – S1 Level Degeneration ... 47
5.4 Results Summary ... 49
5.4.1 L4 – L5 ADR’s ... 49
5.4.2 L5 – S1 ADR’s... 50
8 References... 57
9 Appendix... 61
9.1 RMS Results ... 62
9.2 One Degree of Freedom Artificial Discs (RMS) ... 63
9.2.1 L4 – L5 Level Degeneration ... 63
9.2.2 L5 – S1 Level Degeneration ... 68
9.3 Two Degree of Freedom Artificial Discs (RMS) ... 74
9.3.1 L4 – L5 Level Degeneration ... 74
9.3.2 L5 – S1 Level Degeneration ... 80
9.4 Three Degree of Freedom Artificial Disc (RMS) ... 85
9.4.1 L4 – L5 Level Degeneration ... 85
9.4.2 L5 – S1 Level Degeneration ... 88
9.5 Results Summary (RMS) ... 90
9.5.1 L4 – L5 ADR’s ... 90
9.5.2 L5 – S1 ADR’s... 91
List of Figures
Figure 2-1: Intervertebral disc layers (a) Collagen fibers orientation in the Annulus
fibrosis [Bao, et. al., Review] (b) layers [McLean, The Spine]... 4
Figure 2-2: Body planes (a) Sagittal Plane, (b) Coronal Plane, (c) Horizontal Plane [Basic Matters] ... 4
Figure 2-3: Progression of disc degeneration [McLean, The Spine] ... 5
Figure 2-4: Intervertebral disc (a) Healthy disc, (b) degenerated disc[McLean, The Spine] ... 5
Figure 3-1: X-Ray of stainless steel ball ADR [Bono, History] ... 7
Figure 3-2: Artificial discs (a) SB Charité, (b) ProDisc, (c) Maverick, (d) Kineflex ... 8
Figure 4-1: Mathematical model physical schematic ... 10
Figure 4-2: Reference frames... 13
Figure 4-3: Schematic of cases at different levels ... 17
Figure 5-1: Vertebral response of a healthy lumbar spine to a 100N impulsive shear force at L3. ... 21
Figure 5-2: Intervertebral response of a healthy lumbar spine to a 100N impulsive shear force at L3. ... 21
Figure 5-3: Posterior Anterior response of Shear ADR at L4-L5... 22
Figure 5-4: Axial response of Shear ADR at L4-L5... 23
Figure 5-5: Flexion Extension response of Shear ADR at L4-L5 ... 23
Figure 5-6: Posterior Anterior response of a compressive ADR at L4-L5 ... 24
Figure 5-7: Axial response of a compressive ADR at L4-L5 ... 24
Figure 5-8: Flexion Extension response of a compressive ADR at L4-L5... 25
Figure 5-9: Posterior Anterior response of a rotational ADR at L4-L5... 25
Figure 5-10: Axial response of a rotational ADR at L4-L5... 26
Figure 5-11: Flexion Extension response of a rotational ADR at L4-L5 ... 26
Figure 5-12: Posterior Anterior response of Shear ADR at L5-S1... 28
Figure 5-15: Posterior Anterior response of a compressive ADR at L5-S1 ... 29
Figure 5-16: Axial response of a compressive ADR at L5-S1 ... 30
Figure 5-17: Flexion Extension response of a compressive ADR at L5-S1 ... 30
Figure 5-18: Posterior Anterior response of a rotational ADR at L5-S1 ... 31
Figure 5-19: Axial response of a rotational ADR at L5-S1 ... 31
Figure 5-20: Flexion Extension response of a rotational ADR at L5-S1... 32
Figure 5-21: Posterior Anterior response of a Shear-compressive ADR at L4-L5... 34
Figure 5-22: Axial response of a Shear-compressive ADR at L4-L5... 34
Figure 5-23: Flexion Extension response of a Shear-compressive ADR at L4-L5 ... 35
Figure 5-24: Posterior Anterior response of a compressive-rotational ADR al L4-L5 .... 35
Figure 5-25: Axial response of a compressive-rotational ADR at L4-L5 ... 36
Figure 5-26: Flexion Extension response of a compressive-rotational ADR at L4-L5 .... 36
Figure 5-27: Posterior Anterior response of a Shear-rotational ADR at L4-L5 ... 37
Figure 5-28: Axial response of a Shear-rotational ADR at L4-L5 ... 37
Figure 5-29: Flexion Extension response of a Shear-rotational ADR at L4-L5 ... 38
Figure 5-30: Posterior Anterior response of a Shear-compressive ADR at L5-S1... 39
Figure 5-31: Axial response of a Shear-compressive ADR at L5-S1 ... 40
Figure 5-32: Flexion Extension response of a Shear-compressive ADR at L5-S1... 40
Figure 5-33: Posterior Anterior response of a compressive-rotational ADR at L5-S1... 41
Figure 5-34: Axial response of a compressive-rotational ADR at L5-S1... 41
Figure 5-35: Flexion Extension response of a compressive-rotational ADR at L5-S1 .... 42
Figure 5-36: Anterior Posterior response of a Shear-rotational ADR at L5-S1 ... 42
Figure 5-37: Axial response of a Shear-rotational ADR at L5-S1... 43
Figure 5-38: Flexion Extension response of a Shear-rotational ADR at L5-S1 ... 43
Figure 5-39: Anterior Posterior response of a full 3-degree of freedom ADR at L4-L5.. 45
Figure 5-40: Axial response of a full 3-degree of freedom ADR at L4-L5 ... 45
Figure 5-41: Flexion Extension response of a full 3-degree of freedom ADR at L4-L5.. 46
Figure 5-42: Anterior Posterior response of a full 3-degree of freedom ADR at L5-S1 .. 47
Figure 5-43: Axial response of a full 3-degree of freedom ADR at L5-S1 ... 47
Figure 9-1: Vertebral response of a healthy lumbar spine to a 100N impulsive shear force
at L3. ... 62
Figure 9-2: Intervertebral response of a healthy lumbar spine to a 100N impulsive shear force at L3. ... 62
Figure 9-3: Posterior Anterior response of Shear ADR at L4-L5... 63
Figure 9-4: Axial response of Shear ADR at L4-L5... 64
Figure 9-5: Flexion Extension response of Shear ADR at L4-L5 ... 64
Figure 9-6: Posterior Anterior response of a compressive ADR at L4-L5 ... 65
Figure 9-7: Axial response of a compressive ADR AT L4-L5... 65
Figure 9-8: Flexion Extension response of a compressive ADR at L4-L5... 66
Figure 9-9: Posterior Anterior response of a rotational ADR at L4-L5... 66
Figure 9-10: Axial response of a rotational ADR at L4-L5... 67
Figure 9-11: Flexion Extension response of a rotational ADR at L4-L5 ... 67
Figure 9-12: Posterior Anterior response of Shear ADR at L5-S1... 69
Figure 9-13: Axial response of Shear ADR at L5-S1 ... 69
Figure 9-14: Flexion Extension response of Shear ADR at L5-S1... 70
Figure 9-15: Posterior Anterior response of a compressive ADR at L5-S1 ... 70
Figure 9-16: Axial response of a compressive ADR at L5-61... 71
Figure 9-17: Flexion Extension response of a compressive ADR at L5-S1 ... 71
Figure 9-18: Posterior Anterior response of a rotational ADR at L5-S1 ... 72
Figure 9-19: Axial response of a rotational ADR at L5-S1 ... 72
Figure 9-20: Flexion Extension response of a rotational ADR at L5-S1... 73
Figure 9-21: Posterior Anterior response of a Shear-compressive ADR at L4-L5... 75
Figure 9-22: Axial response of a Shear-compressive ADR at L4-L5... 75
Figure 9-23: Flexion Extension response of a Shear-compressive ADR at L4-L5 ... 76
Figure 9-24: Posterior Anterior response of a compressive-rotational ADR at L4-L5 .... 76
Figure 9-25: Axial response of a compressive-rotational ADR at L4-L5 ... 77
Figure 9-26: Flexion Extension response of a compressive-rotational ADR at L4-L5 .... 77
Figure 9-29: Flexion Extension response of a Shear-rotational ADR ... 79
Figure 9-30: Posterior Anterior response of a Shear-compressive ADR at L5-S1... 80
Figure 9-31: Axial response of a Shear-compressive ADR at L5-S1 ... 81
Figure 9-32: Flexion Extension response of a Shear-compressive ADR at L5-S1... 81
Figure 9-33: Posterior Anterior response of a compressive-rotational ADR at L5-S1... 82
Figure 9-34: Axial response of a compressive-rotational ADR at L5-S1... 82
Figure 9-35: Flexion Extension response of a compressive-rotational ADR at L5-S1 .... 83
Figure 9-36: Anterior Posterior response of a Shear-rotational ADR at L5-S1 ... 83
Figure 9-37: Axial response of a Shear-rotational ADR at L5-S1... 84
Figure 9-38: Flexion Extension response of a Shear-rotational ADR at L5-S1 ... 84
Figure 9-39: Anterior Posterior response of a full 3-degree of freedom ADR at L4-L5.. 86
Figure 9-40: Axial response of a full 3-degree of freedom ADR at L4-L5 ... 86
Figure 9-41: Flexion Extension response of a full 3-degree of freedom ADR at L4-L5.. 87
Figure 9-42: Anterior Posterior response of a full 3-degree of freedom ADR at L5-S1 .. 88
Figure 9-43: Axial response of a full 3-degree of freedom ADR at L5-S1 ... 88
List of Tables
Table 3-1: Artificial discs design highlights ... 9
Table 4-1: Spring constants ... 11
Table 4-2: Segment dimensions... 11
Table 4-3: Segment masses... 11
Table 4-4: Spring constant multiplier for 1-DOF ADR at L4-L5... 18
Table 4-5: Spring constant multiplier for 1-DOF ADR at L5-S1 ... 18
Table 4-6: Spring constant multiplier for 2-DOF ADR at L4-L5... 18
Table 4-7: Spring constant multiplier for 2-DOF ADR at L5-S1 ... 18
Table 4-8: Spring constant multiplier for 3-DOF ADR at L4-L5... 19
Table 4-9: Spring constant multiplier for 3-DOF ADR at L5-S1 ... 19
Table 5-1: Posterior Anterior intervertebral displacement summary for the 1-DOF L4- L5 ADR cases... 27
Table 5-2: Axial intervertebral displacement summary for the 1-DOF L4- L5 ADR cases ... 27
Table 5-3: Flexion Extension intervertebral rotation summary for the 1-DOF L4- L5 ADR cases... 27
Table 5-4: Posterior Anterior intervertebral displacement summary for the 1-DOF L5-S1 ADR cases... 32
Table 5-5: Axial intervertebral displacement summary for the 1-DOF L5-S1 ADR cases ... 32
Table 5-6: Flexion Extension intervertebral rotation summary for the 1-DOF L5-S1 ADR cases ... 33
Table 5-7: Posterior Anterior intervertebral displacement summary for the 2-DOF L4-L5 ADR cases... 38
1 Introduction
Approximately 80% of Americans suffer significant back pain at least once in their life time [Haid, Artificial], and about 70% of all spinal injuries are associated with the lumbar spine [McLean, The Spine]. Degenerative disc disease is one of the main causes of back pain [Haid, Artificial], a very difficult and unpredictable condition to treat [McLean, The Spine]. Treatment and healing of intervertebral discs is unpredictable and unreliable because the discs have no vascular or neural components [McLean, The Spine].
To solve this problem, the first approach is a non-surgical treatment “including rest, heat, pain medication, therapy, and chiropractic manipulation” [Haid, Artificial]. When the pain persists, surgical methods are used to help the patient. Currently the most widely used and approved method is spinal fusion [Lumbar Artificial], which consists of removing the degenerated disc and fusing the two adjacent vertebrae together by
implanting bone in between, restoring disc height. Even though spinal fusion is a widely accepted and used technique to replace a degenerated disc, it has many problems
associated to the procedure [Haid, Artificial], so a new technology and procedure is gaining ground and acceptance that consists of replacing the damaged disc with a mechanical artificial disc [Blumenthal, Artificial].
The idea of an artificial disc is not something new, but it is an evolving technology that has not been fully mastered yet. The first artificial disc replacement (ADR) attempt happened more than forty years ago when a surgeon implanted stainless steel balls on one hundred patients [Haid, Artificial]. “There are many artificial disc designs classified into two general types: total disc replacement and disc nucleus
replacement” [Artificial Discs]. Total disc replacements, as its name implies, replaces the entire natural intervertebral disc with a new mechanical disc, while the nucleus
replacement, substitutes the nucleus pulposus section of the natural disc with a
Some of the advantages that artificial disc replacement offers over spinal fusion are a quicker recovery, shorter operating time, lower rate of disc degeneration at adjacent levels, and greater mobility [Haid, Artificial]. It is clear that artificial disc replacement will eventually substitute spinal fusion entirely, and currently many artificial discs are undergoing clinical trails and modifications to improve their design, but are only
2 Intervertebral Discs
The intervertebral disc plays a very important role in the behavior of the spinal column. The spinal disc has three main functions, first to maintain a proper intervertebral spacing, second to bear and distribute loads in the vertebral column, and third to restrain excessive motion in the vertebral segment [McLean, The Spine].
Intervertebral discs are composed of two main sections, an outer shell called annulus fibrosis (AF) and an inner soft center called the nucleus pulposus (NP) [Bao, Review], [McLean, The Spine][Lee, Artificial]Frelinghuysen, Lumbar]. Concentric, parallel layers of fibro-cartilaginous material form the AF, these layers are arranged at a 65 degree angle to the long axis of the spine in alternating opposite directions [Frelinghuysen, Lumbar]. (Figure 2-1) The AF is made up of about 50-60% collagen with the rest mostly being water and proteoglycans, giving it a harder and stronger characteristic. Proteoglycans are large molecules formed by protein core attached to one or more chains of
(a) (b)
Figure 2-1: Intervertebral disc layers (a) Collagen fibers orientation in the Annulus fibrosis [Bao, et.
al., Review] (b) layers [McLean, The Spine]
To describe the 3-D structure of the body, three orthogonal planes have been defined. The sagittal plane separates the body into left and right, the coronal or frontal plane in front and back, and the horizontal plane separates the top and bottom. Figure 2-2 (a-c) shows the different planes of the body.
(a) (b) (c)
Figure 2-2: Body planes (a) Sagittal Plane, (b) Coronal Plane, (c) Horizontal Plane [Basic Matters]
As the vertebral spine moves, the center of rotation (COR) between each vertebra migrates along the sagittal plane, typically forward in extension and backwards in flexion [Lee, Artificial], [Bono, History]. This translation of the COR allows the body to
minimize the loads on each disc and vertebrae and use more muscles to support the load [McLean, The Spine].
to about 70% of all spinal injuries [McLean, The Spine]. When discs become damaged they follow a degenerative progression that may be observed in Figure 2-3. Disc damage generally occurs through repetitive overloading of the spine, immobility of the spine and age [Stokes].
Figure 2-3: Progression of disc degeneration [McLean, The Spine]
A degenerated disc becomes stiffer and loses the capability of retaining water, additionally the dried disc becomes smaller and the ability to distribute loads across the disc changes [McLean, The Spine]. Figure 2-4 (a) and (b) shows a healthy disc and a degenerated disc, where the differences between both discs are obvious.
(a) (b)
Figure 2-4: Intervertebral disc (a) Healthy disc, (b) degenerated disc [McLean, The Spine]
3 Artificial Discs
Even though artificial vertebral discs are still evolving and being modified significantly, the idea of using an artificial disc is not as recent as most people may think. The first intervertebral artificial disc was implanted more than forty years ago when a surgeon implanted stainless steel balls (Fernström ball) between the vertebrae of one hundred patients [Haid, Artificial],[Bono, History]. The stainless steel balls restored
inter-vertebral spacing and allowed full range of motion [Bono, History]. Figure 3-1 shows an x-ray of a patient with stainless steel balls implanted on his back.
Figure 3-1: X-Ray of stainless steel ball ADR [Bono, History]
Good results were obtained from this concept, but the device failed in the long term because the ball’s contact point caused excessive compressive stresses [Bono, History]. This was attributed to the fact that the material did not match the bone’s biomechanical modulus and the contact point was too small, concentrating the load; so another ball type implant was designed [Back and Neck]. The new design was made out of silastic, an elastic material that promised to reduce compressive stresses and match the biomechanical modulus of the vertebrae much better and also included a
non-compressive horseshoe shape plateau to prevent subsidence [Bono, History].
a solution to the three main failure sources were found: maximize the area of contact between bone and prosthesis, use synthetic on synthetic articulating surfaces instead of synthetic on bone, and finally the material in contact with the bone should have an elastic modulus very similar to the bone [Bono, History].
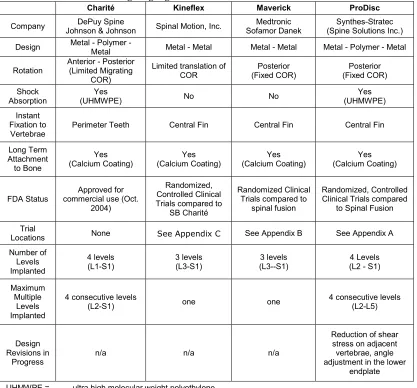
The next major step in artificial disc replacement (ADR) was the design of an articulated device, with the introduction of the first generation of SB Charitè [Bono, History] in the early 1980’s. Two major types of discs have been developed, metal on plastic and metal on metal prosthesis [Errico, Why]. The most widely used and developed discs for the lumbar spine of the metal on plastic type are the SB Charitè and the ProDisc, and of the metal on metal are the Maverick and the Kineflex. The SB Charitè has the longest history of all, but currently all of these are either approved by the FDA or undergoing clinical trials before approval [FDA][Delamarter, Clinical][Artificial Disc Clinical][Le Huec, Clinical]. Each artificial disc has its own design concept that
addresses the design criteria in different ways, each with its own pros and cons. Figure 3-2 (a-d) show a picture of these ADR.
(a) (b)
(b) (d)
Figure 3-2: Artificial discs (a) SB Charité, (b) ProDisc, (c) Maverick, (d) Kineflex
Table 3-1: Artificial discs design highlights
Charité Kineflex Maverick ProDisc
Company DePuy Spine
Johnson & Johnson Spinal Motion, Inc.
Medtronic Sofamor Danek
Synthes-Stratec (Spine Solutions Inc.) Design Metal - Polymer -
Metal Metal - Metal Metal - Metal Metal - Polymer - Metal
Rotation
Anterior - Posterior (Limited Migrating
COR)
Limited translation of COR Posterior (Fixed COR) Posterior (Fixed COR) Shock Absorption Yes
(UHMWPE) No No
Yes (UHMWPE)
Instant Fixation to Vertebrae
Perimeter Teeth Central Fin Central Fin Central Fin
Long Term Attachment to Bone Yes (Calcium Coating) Yes (Calcium Coating) Yes (Calcium Coating) Yes (Calcium Coating) FDA Status Approved for commercial use (Oct.
2004)
Randomized, Controlled Clinical Trials compared to
SB Charité
Randomized Clinical Trials compared to
spinal fusion
Randomized, Controlled Clinical Trials compared
to Spinal Fusion
Trial
Locations None See Appendix C See Appendix B See Appendix A Number of Levels Implanted 4 levels (L1-S1) 3 levels (L3-S1) 3 levels (L3--S1) 4 Levels (L2 - S1)
Maximum Multiple
Levels Implanted
4 consecutive levels
(L2-S1) one one
4 consecutive levels (L2-L5)
Design Revisions in
Progress
n/a n/a n/a
Reduction of shear stress on adjacent vertebrae, angle adjustment in the lower
4 Procedure
The procedure is split into three main sections: the elaboration of the mathematical model, computer simulations using Matlab®, and data manipulation using MS Excel®. The following three sections contain detailed explanations of each section.
4.1 Mathematical Model
This section explains all the important properties, principles, assumptions, and calculations involved in mathematical model of the lumbar spine used in this thesis.
4.1.1 Physical Description
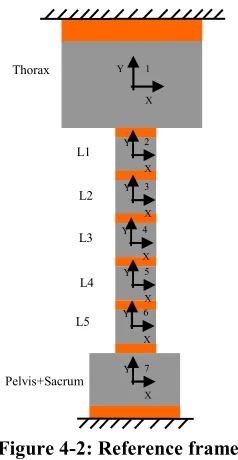
A simplified model of the lumbar spine, thorax through pelvis+sacrum is modelled in two dimensions with three degrees of freedom, X and Y translations and rotation in the XY plane. Each block represents a segment of the model that ranges from the thorax through all lumbar vertebrae L1-L5 and the pelvis+sacrum. In total there are 7 rigid blocks connected by a flexible joint structure as shown in Figure 4-1.
Figure 4-1: Mathematical model physical schematic
Each flexible joint structure consists of three springs and three dampers that lump the material properties of connective tissue, intervertebral discs, ligaments, muscles, etc. with single equivalent values obtained from previous studies [Keller, TS, Colloca, CJ,
Y
X
Thorax
L1
L2
L3
L4
L5
Beliveau, JG]. Each spring-damper pair acts in one primary direction, X or Y translation or XY plane rotation. Spring constant values are shown in Table 4-1.
Table 4-1: Spring constants
Thorax T12-L1 L1-L2 L2-L3 L3-L4 L4-L5 L5-S1 S1-Pelvis
Kx (kN/m) 30 50 40 35 30 30 45 200
Ky (kN/m) 1250 640 620 600 525 450 510 300
Kt (Nm/rad) 400 160 140 120 100 80 75 700
For simplicity, the spring constants were labelled according to the direction they act on, x, y, z, and the flexible joint the spring represents, 1 for the thorax to ground, 2 for the T12 to L1, 3 for L1-L2, 4 for L2-L3, 5 for L3-L4, 6 for L4-L5, 7 for L5-S1, and 8 for S1+pelvis to ground.
The rigid blocks are given only one dimension along the Y-axis that corresponds to the height of the vertebra or the equivalent height of the pelvis and thorax. A coupling constant “a” is incorporated to link the vertical displacement along the Y-axis and the rotational spring and damper. The lengths of each segment are shown in Table 4-2 based on a 170cm body height person and the coupling constant “a” was assumed to be 20mm [Keller, TS, Colloca, CJ, Beliveau, JG].
Table 4-2: Segment dimensions
Segment Thorax L1 L2 L3 L4 L5 Pelvis - Sacrum
Length (m) 0.1240 0.0355 0.0375 0.0390 0.0400 0.0390 0.0410
The masses of each rigid segment assumed a person’s body weight of 70kg and are shown in Table 4-3 [Keller, TS, Colloca, CJ, Beliveau, JG].
Table 4-3: Segment masses
Segment Thorax L1 L2 L3 L4 L5 Pelvis - Sacrum
mass (kg) 26 0.17 0.17 0.114 0.114 0.114 6
4.1.2 Assumptions
The following assumptions were made to simplify the actual behaviour of the lumbar spine while still providing useful results.
• A two dimensional model was generated by combining rigid segments and
flexible joint sections. The rigid segments or blocks represent the vertebrae, thorax and pelvis+sacrum and the flexible joint sections lump all the connective tissue, intervertebral discs, muscles, ligaments, etc. as shown in Figure 4-1.
• Masses and segment lengths were obtained from psychometric data for a person
of 170cm in body height and 70kg of body weight [Keller, TS, Colloca, CJ, Beliveau, JG].
• There is no mass coupling in the system.
• All flexible joint structures can be modelled and lumped into a series of massless
springs and dampers that act in one primary direction, x, y or z.
• For all the analyses the damping ratio, ξ, was assumed to be 0.25 or 25% of the
critical damping ratio [Keller, TS, Colloca, CJ, Beliveau, JG].
• Full disc degeneration doubles the xy-plane rotation spring constant and reduces
by half the y-direction spring constant [Mow][Nachemson]. No change occurs in the x-direction spring constant, since no reference was found that stated a
quantitative change.
• A fused disc can be modeled as a disc with very high spring constants, restraining
the movement. The fused disc is assumed to have spring constants one thousand times higher than healthy discs.
4.1.3 Equations of Motion
mass of each rigid segment at its neutral position. The position of each vertebra is defined from this neutral position. This will yield a total of 21 reference variables or degrees of freedom, 7 translations in the x-direction, 7 translations in the y-direction, and 7 rotations in the z-direction.
Figure 4-2: Reference frames
In order to generate Lagrange’s equations for an undamped system, the potential and kinetic energies for each rigid segment were calculated using the following formulas, where V is the potential energy, K is the spring coefficient, X is the rigid segment
displacement or rotation, m is the mass or inertia of the rigid segment, X dot is the velocity of the rigid segment and subscripts j and i reference the direction of the motion and spring coefficient number respectively. Values for j range between 1 and 7 for each reference frame and values of i range between 1 and 8 for each spring, where X0 and X8 are zero.
(
)
∑
− −= 8
1
2 1
2 1
i i i X X
K
V (Potential energy)
∑
= 7
1
2
2 1
j jX
m
T & (Kinetic energy)
Thorax
L1
L2
L3
L4
L5
Pelvis+Sacrum
Y
X 1
Y
X 2
Y
X 3
Y
X 4
Y
X 5
Y
X 6
Y
The same formulas were used to calculate the potential and kinetic energies for the
Y and θ direction. Using these calculated energies the Lagrange equations can be written as shown below, where L is the Lagrange equation, T is the kinetic energy and V is the potential energy.
V T
L= −
From this equation, the equations of motion can be obtained by differentiating the Lagrange equation as follow, where q sub i is the generalized coordinate, q dot sub i is the velocity of the generalized coordinate and Q sub i is the generalized force:
i i i
Q q
L q
L dt
d
= ∂
∂ − ∂
∂
&
These generated 21 equations that can be expressed in 21x21 coefficient matrices multiplied by column vectors of 21 elements that represent each reference variable as shown bellow, where M is the mass matrix, K is the spring coefficient matrix, F is the force column vector, and X is the displacement column vector.
F V dt dT
=
+ → MX&&+KX =F
This can be written like this because the kinetic energy of the system only depends in the q dots and the potential energy only depends in the q generalized coordinate values. In a more general form the equations of motion can be written as
F KX X C X
M&&+ & + =
I M
tr
φ
=φ
andφ
trKφ
=Ω2Where Φ and Φtr are the eigenvectors and the transpose of the eigenvectors correspondingly, M is the mass matrix, I is the identity matrix, K is the spring coefficient matrix, and Ω is the natural frequencies matrix. Once these two conditions are met, the 21x21 damping coefficient matrix, C, can be formulated by
M M
C =
φ
2ξ
Ωφ
trWhere M is the mass matrix, Φ are the modal eigenvectors, ξ is the damping ratio,
Ω is the natural frequency matrix, and 2 is just a scalar value. For all the analyses the damping ratio, ξ, was assumed to be 0.25 or 25% of the critical damping ratio [Keller, TS, Colloca, CJ, Beliveau, JG]. With this final calculation all the coefficients of the equations of motion are known and can be written as shown bellow where all the coefficients are 21x21 matrices and the column vectors contain 21 elements.
F KX X C X
M&&+ & + =
All these calculations can be found in the Appendix.
4.1.4 Impulsive Force Input
Previous researchers have established that typical posterior anterior impulsive forces on the thoracolumbar spine are on the order of 100N in a period of 0.005sec, and the impulse imparted by these forces can be expressed by the following equation as a function of time [Keller, TS, Colloca, CJ, Fuhr, AW][Nathan, M, Keller, TS].
) 200 sin( 466 1000
t e
F = − t
π
Integrating this function with respect of time and using the impulse momentum theory, an equivalent initial velocity, v0, can be calculated for the system to act as an
∫
= Fdt m
v0 1
This initial velocity acts in the same direction that the force is acting and can be input into the initial conditions to solve the differential equations obtained from the equations of motion. The value obtained for the initial velocity as a result of an impulsive force acting on the L3 vertebra along the x-axis was 1.8414m/s.
4.2 Matlab Simulations
In order to numerically solve the equations of motion, the system must be transformed into state space. Rewriting the equations of motion in state space generated coefficient matrices of 42x42 and column vectors of 42 elements that contain 21 velocity elements and 21 displacement elements. The MathWorks® Matlab R2007a software was used to numerically solve the equations of motion.
An m-file was created containing all the variables and equations describing the system. (Appendix). The state space equations were solved using Matlab’s ode45 solver and initial conditions of zero except at the velocity in the x-direction of L3, which was set to 1.8414m/s as calculated previously to represent the impulsive force input.
The model was validated using the properties of a healthy spine and comparing the results to the published results in the journal article “Force-deformation response of the lumbar spine: a sagittal plane model of posterior anterior manipulation and mobilization” by Tony S. Keller, Christopher J. Colloca and Jean-Guy Beliveau.
A series of 7 different ADR, fused vertebrae, degenerated disc and healthy spine cases were modelled at different intervertebral levels, L4-L5 and L5-S1, by changing the spring constant values.
the fused disc cases, all three spring constants were multiplied by one thousand to increase the stiffness of the joint attempting to represent a fused segment.
The cases were analysed per single implantation level, beginning with L4-L5 and then with L5-S1 as shown in Figure 4-3. These ADR cases contained a combination of possibilities of degrees of freedom, 1-degree of freedom, 2-degrees of freedom and 3-degrees of freedom. For the 1-degree of freedom case, only one translation or rotation was allowed in the ADR by changing the spring constant values. This was done by multiplying two spring constants by one thousand to mimic a very stiff material, and keeping the original spring constant in the direction of interest. The same was done for the 2-degrees of freedom cases and the ideal 3-degrees of freedom cases where the ADR mimics a healthy intervertebral disc.
Figure 4-3: Schematic of cases at different levels
For the 1-degree of freedom cases, the original spring constants were multiplied by different values to represent the desired cases as shown in Tables 4-4 and 4-5. All other spring constant values were kept with the original values that represent healthy
intervertebral discs.
Thorax
L1
L2
L3
L4
L5
Pelvis+Sacrum
Healthy Degenerated Fuesed 1-DOF - Shear - Compressive - Rotational 2-DOF
- Shear + Compression - Compression + Rotation - Shear + Rotation 3-DOF
- Shear + Compression + Rotation Healthy
Table 4-4: Spring constant multiplier for 1-DOF ADR at L4-L5
Multiplier L4-L5
Kx6 Ky6 Kt6
Degenerated 1 0.5 2 Fused 1000 1000 1000 Shearing 1 1000 1000 Compressive 1000 1 1000 Rotational 1000 1000 1
Table 4-5: Spring constant multiplier for 1-DOF ADR at L5-S1
Multiplier L5-S1
Kx7 Ky7 Kt7
Degenerated 1 0.5 2 Fused 1000 1000 1000 Shearing 1 1000 1000 Compressive 1000 1 1000 Rotational 1000 1000 1
For the 2-degree of freedom cases, the original spring constants were multiplied by different values to represent the desired cases as shown in Tables 4-6 and 4-7. All other spring constant values were kept with the original values that represent healthy
intervertebral discs.
Table 4-6: Spring constant multiplier for 2-DOF ADR at L4-L5
Multiplier L4-L5
Kx6 Ky6 Kt6
Degenerated 1 0.5 2 Fused 1000 1000 1000 Shearing-Compressive 1 1 1000 Compressive-Rotational 1000 1 1 Shearing-Rotational 1 1000 1
Table 4-7: Spring constant multiplier for 2-DOF ADR at L5-S1
Multiplier L5-S1
Kx7 Ky7 Kt7
Degenerated 1 0.5 2 Fused 1000 1000 1000 Shearing-Compressive 1 1 1000 Compressive-Rotational 1000 1 1 Shearing-Rotational 1 1000 1
For the 3-degree of freedom case, , the original spring constants were multiplied by different values to represent the desired cases as shown in Tables 4-8 and 4-9. All other spring constant values were kept with the original values that represent healthy
Table 4-8: Spring constant multiplier for 3-DOF ADR at L4-L5
Multiplier L4-L5
Kx6 Ky6 Kt6
Degenerated 1 0.5 2 Fused 1000 1000 1000 3-DOF 1 1 1
Table 4-9: Spring constant multiplier for 3-DOF ADR at L5-S1
Multiplier L5-S1
Kx7 Ky7 Kt7
Degenerated 1 0.5 2 Fused 1000 1000 1000 3-DOF 1 1 1
The system’s response to the impulsive force was obtained for a 1sec period to allow the system to obtain a steady state value of zero displacement at all levels in all directions. The solver was forced to make 1/10000 sec steps for uniformity and consistency of results.
4.3 Excel Data Manipulation
The results obtained from Matlab® were exported into MS Excel® spreadsheets to perform additional calculations and graphs.
The data obtained from Matlab reflected the displacement of each mass associated with each vertebra, thorax and pelvis+sacrum. All this data was then separated into the different ADR cases. To obtain the intervertebral disc displacements, the relative
5 Results
Figure 5-1 shows the vertebral response of the system to an impulsive shear force
(posterior anterior) of 100N at the L3 level, displacements in mm and rotations in degrees for better visualization.
0 0.01 0.02 0.03 0.04 0.05 0.06 0.07 0.08 0.09
T L1 L2 L3 L4 L5 S1P
Segment D is p la c e m e n t (m m ) / R o ta ti o n ( D e g ) Posterior Anterior Axial Flexion Extension
Figure 5-1: Vertebral response of a healthy lumbar spine to a 100N impulsive shear force at L3.
Figure 5-2 shows the relative intervertebral response of the system to an impulsive shear force (posterior anterior) of 100N at the L3 level, displacements in mm and rotations in degrees for better visualization.
-0.04 -0.03 -0.02 -0.01 0 0.01 0.02 0.03
T-L1 L1-L2 L2-L3 L3-L4 L4-L5 L5-S1P
Se gm e nt
5.1 One Degree of Freedom Artificial Discs
The artificial discs results for the one degree of freedom case have been divided into three separate degrees of freedom x, y, and z or Shear, compressive and rotational respectively. Each disc was implanted at L4 – L5 and L5 – S1 levels. The following results are divided and presented by level and degree of freedom. Bar charts of all segments are presented to aid in the visualization of the overall trends and summary tables are presented at the end of each section where the differences can be compared quantitatively.
5.1.1 L4 – L5 Level Degeneration
The following results reflect the 1 degree of freedom ADR’s, fused vertebrae and degenerated disc cases at the L4 – L5 level.
5.1.1.1 Shear ADR
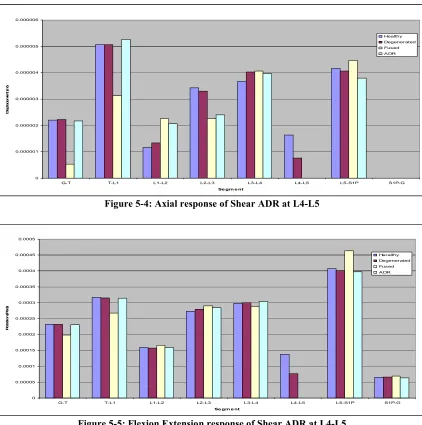
Figures 5-3 – 5-5 show the response of the lumbar spine to an impulsive shearing force acting on L3. The figures include the response of a spine with a degenerated disc, fused disc and a Shear ADR at the L4 – L5 level as well as the response of a healthy spine.
0 0.000005 0.00001 0.000015 0.00002 0.000025 0.00003 0.000035 0.00004
G-T T-L1 L1-L2 L2-L3 L3-L4 L4-L5 L5-S1P S1P-G
Se gm e nt
D
is
p
la
c
e
m
e
n
t
(m
)
Healthy Degenerated Fused ADR
0 0.000001 0.000002 0.000003 0.000004 0.000005 0.000006
G-T T-L1 L1-L2 L2-L3 L3-L4 L4-L5 L5-S1P S1P-G
Se gm e nt
D
is
p
la
c
e
m
e
n
t
(m
)
Healthy Degenerated Fused A DR
Figure 5-4: Axial response of Shear ADR at L4-L5
0 0.00005 0.0001 0.00015 0.0002 0.00025 0.0003 0.00035 0.0004 0.00045 0.0005
G-T T-L1 L1-L2 L2-L3 L3-L4 L4-L5 L5-S1P S1P-G
Se gm e nt
R
o
ta
ti
o
n
(
R
a
d
)
Heralthy Degenerated Fused A DR
Figure 5-5: Flexion Extension response of Shear ADR at L4-L5
5.1.1.2 Compressive ADR
0 0.000005 0.00001 0.000015 0.00002 0.000025 0.00003 0.000035 0.00004
G-T T-L1 L1-L2 L2-L3 L3-L4 L4-L5 L5-S1P S1P-G
Se gm e nt
D
is
p
la
c
e
m
e
n
t
(m
)
Healthy Degenerated Fused ADR
Figure 5-6: Posterior Anterior response of a compressive ADR at L4-L5
0 0.000001 0.000002 0.000003 0.000004 0.000005 0.000006
G-T T-L1 L1-L2 L2-L3 L3-L4 L4-L5 L5-S1P S1P-G
Se gm e nt
D
is
p
la
c
e
m
e
n
t
(m
)
Healthy Degenerated Fus ed A DR
0 0.00005 0.0001 0.00015 0.0002 0.00025 0.0003 0.00035 0.0004 0.00045 0.0005
G-T T-L1 L1-L2 L2-L3 L3-L4 L4-L5 L5-S1P S1P-G
Se gm e nt
R
o
ta
ti
o
n
(
R
a
d
)
Heralthy Degenerated Fused A DR
Figure 5-8: Flexion Extension response of a compressive ADR at L4-L5
5.1.1.3 Rotational ADR
Figures 5-9 – 5-11 show the response of the lumbar spine to an impulsive shearing force acting on L3. The figures include the response of a spine with a degenerated disc, fused disc and a rotational ADR at the L4 – L5 level as well as the response of a healthy spine.
0 0.000005 0.00001 0.000015 0.00002 0.000025 0.00003 0.000035 0.00004
G-T T-L1 L1-L2 L2-L3 L3-L4 L4-L5 L5-S1P S1P-G
Se gm e nt
D
is
p
la
c
e
m
e
n
t
(m
)
Healthy Degenerated Fused ADR
0 0.000001 0.000002 0.000003 0.000004 0.000005 0.000006
G-T T-L1 L1-L2 L2-L3 L3-L4 L4-L5 L5-S1P S1P-G
Se gm e nt
D
is
p
la
c
e
m
e
n
t
(m
)
Healthy Degenerated Fus ed A DR
Figure 5-10: Axial response of a rotational ADR at L4-L5
0 0.00005 0.0001 0.00015 0.0002 0.00025 0.0003 0.00035 0.0004 0.00045 0.0005
G-T T-L1 L1-L2 L2-L3 L3-L4 L4-L5 L5-S1P S1P-G
Se gm e nt
R
o
ta
ti
o
n
(
R
a
d
)
Heralthy Degenerated Fused A DR
Figure 5-11: Flexion Extension response of a rotational ADR at L4-L5
5.1.1.4 Result Summary of One Degree of Freedom L4 – L5 ADR’s
Table 5-1: Posterior Anterior intervertebral displacement summary for the 1-DOF L4- L5 ADR cases
Posterior Anterior Intervertebral Displacement % Difference
T-L1 L1-L2 L2-L3 L3-L4 L4-L5 L5-S1P
Healthy 0.00% 0.00% 0.00% 0.00% 0.00% 0.00% Degenerated 0.61% 0.09% -0.89% 0.75% 0.36% -2.43% Fused 4.17% -3.46% -29.48% 17.49% -57.74% 17.64% Shear 1.47% -0.35% -1.22% 2.15% 0.62% -5.99% Compressive 4.04% -3.28% -29.48% 17.17% -57.65% 17.31% Rotational 2.70% -3.37% -26.36% 16.42% -57.30% 20.71%
Table 5-2: Axial intervertebral displacement summary for the 1-DOF L4- L5 ADR cases
Axial Intervertebral Displacement % Difference
T-L1 L1-L2 L2-L3 L3-L4 L4-L5 L5-S1P
Healthy 0.00% 0.00% 0.00% 0.00% 0.00% 0.00% Degenerated 0.00% 14.29% -3.88% 10.00% -53.06% -2.40% Fused -38.16% 94.29% -33.98% 10.91% -100.00% 7.20% Shear 3.95% 77.14% -30.10% 8.18% -100.00% -8.80% Compressive -34.21% 94.29% -25.24% 4.55% -95.92% 7.20% Rotational -40.79% 82.86% -36.89% 14.55% -30.61% 16.00%
Table 5-3: Flexion Extension intervertebral rotation summary for the 1-DOF L4- L5 ADR cases
Flexion Extension Intervertebral Rotation % Difference
T-L1 L1-L2 L2-L3 L3-L4 L4-L5 L5-S1P
Healthy 0.00% 0.00% 0.00% 0.00% 0.00% 0.00% Degenerated -0.62% -0.86% 2.59% 0.47% -44.77% -1.60% Fused -15.90% 4.22% 6.35% -3.46% -99.93% 13.76% Shear -1.10% 0.29% 4.20% 1.75% -99.88% -2.36% Compressive -16.00% 3.94% 6.29% -3.32% -99.86% 13.64% Rotational -15.08% 5.81% 4.58% -2.41% -7.70% 13.41%
5.1.2 L5 – S1 Level Degeneration
The following results reflect the 1 degree of freedom ADR’s, fused vertebrae and degenerated disc cases at the L5 – S1 level.
5.1.2.1 Shear ADR
0 0.000005 0.00001 0.000015 0.00002 0.000025 0.00003 0.000035 0.00004
G-T T-L1 L1-L2 L2-L3 L3-L4 L4-L5 L5-S1P S1P-G
Se gm e nt
D
is
p
la
c
e
m
e
n
t
(m
)
Healthy Degenerated Fus ed ADR
Figure 5-12: Posterior Anterior response of Shear ADR at L5-S1
0 0.000001 0.000002 0.000003 0.000004 0.000005 0.000006
G-T T-L1 L1-L2 L2-L3 L3-L4 L4-L5 L5-S1P S1P-G
Se gm e nt
D
is
p
la
c
e
m
e
n
t
(m
)
Healthy Degenerated Fused ADR
0 0.00005 0.0001 0.00015 0.0002 0.00025 0.0003 0.00035 0.0004 0.00045
G-T T-L1 L1-L2 L2-L3 L3-L4 L4-L5 L5-S1P S1P-G
Se gm e nt
R
o
ta
ti
o
n
(
R
a
d
)
Healthy Degenerated Fused A DR
Figure 5-14: Flexion Extension response of Shear ADR at L5-S1
5.1.2.2 Compressive ADR
Figures 5-15 – 5-17 show the response of the lumbar spine to an impulsive shearing force acting on L3. The figures include the response of a spine with a degenerated disc, fused disc and a compressive ADR at the L5 – S1 level as well as the response of a healthy spine.
0 0.000005 0.00001 0.000015 0.00002 0.000025 0.00003 0.000035 0.00004
G-T T-L1 L1-L2 L2-L3 L3-L4 L4-L5 L5-S1P S1P-G
Se gm e nt
D
is
p
la
c
e
m
e
n
t
(m
)
Healthy Degenerated Fus ed ADR
0 0.000001 0.000002 0.000003 0.000004 0.000005 0.000006
G-T T-L1 L1-L2 L2-L3 L3-L4 L4-L5 L5-S1P S1P-G
Se gm e nt
D
is
p
la
c
e
m
e
n
t
(m
)
Healthy Degenerated Fused ADR
Figure 5-16: Axial response of a compressive ADR at L5-S1
0 0.00005 0.0001 0.00015 0.0002 0.00025 0.0003 0.00035 0.0004 0.00045
G-T T-L1 L1-L2 L2-L3 L3-L4 L4-L5 L5-S1P S1P-G
Se gm e nt
R
o
ta
ti
o
n
(
R
a
d
)
Healthy Degenerated Fused A DR
Figure 5-17: Flexion Extension response of a compressive ADR at L5-S1
5.1.2.3 Rotational ADR
0 0.000005 0.00001 0.000015 0.00002 0.000025 0.00003 0.000035 0.00004
G-T T-L1 L1-L2 L2-L3 L3-L4 L4-L5 L5-S1P S1P-G
Se gm e nt
D
is
p
la
c
e
m
e
n
t
(m
)
Healthy Degenerated Fus ed ADR
Figure 5-18: Posterior Anterior response of a rotational ADR at L5-S1
0 0.000001 0.000002 0.000003 0.000004 0.000005 0.000006
G-T T-L1 L1-L2 L2-L3 L3-L4 L4-L5 L5-S1P S1P-G
Se gm e nt
D
is
p
la
c
e
m
e
n
t
(m
)
Healthy Degenerated Fused ADR
0 0.00005 0.0001 0.00015 0.0002 0.00025 0.0003 0.00035 0.0004 0.00045 0.0005
G-T T-L1 L1-L2 L2-L3 L3-L4 L4-L5 L5-S1P S1P-G
Se gm e nt
R
o
ta
ti
o
n
(
R
a
d
)
Healthy Degenerated Fused A DR
Figure 5-20: Flexion Extension response of a rotational ADR at L5-S1
5.1.2.4 Result Summary of One Degree of Freedom L5 – S1 ADR’s
Tables 5-4 through 5-6 show a comparative summary of the results obtained for each 1-degree of freedom ADR case.
Table 5-4: Posterior Anterior intervertebral displacement summary for the 1-DOF L5-S1 ADR cases
Posterior Anterior Intervertebral Displacement % Difference
T-L1 L1-L2 L2-L3 L3-L4 L4-L5 L5-S1P
Healthy 0.00% 0.00% 0.00% 0.00% 0.00% 0.00% Degenerated 1.96% -0.35% -11.35% 0.97% -4.63% -2.59% Fused -6.62% -34.31% -13.90% 3.97% -8.19% -81.23% Shear 5.27% -8.95% -20.36% -3.76% -14.23% -9.06% Compressive -6.25% -34.22% -14.24% 3.76% -8.45% -81.23% Rotational 7.11% -1.77% -20.36% 17.81% -1.25% -58.58%
Table 5-5: Axial intervertebral displacement summary for the 1-DOF L5-S1 ADR cases
Axial Intervertebral Displacement % Difference
T-L1 L1-L2 L2-L3 L3-L4 L4-L5 L5-S1P
Table 5-6: Flexion Extension intervertebral rotation summary for the 1-DOF L5-S1 ADR cases
Flexion Extension Intervertebral Rotation % Difference
T-L1 L1-L2 L2-L3 L3-L4 L4-L5 L5-S1P
Healthy 0.00% 0.00% 0.00% 0.00% 0.00% 0.00% Degenerated -3.64% -5.77% -6.26% -13.62% 8.59% -38.07% Fused -19.73% -5.03% -14.65% -40.88% 82.21% -99.88% Shear -8.91% -12.82% -18.24% -32.41% 55.03% -99.89% Compressive -19.49% -4.72% -14.60% -40.42% 81.20% -99.84% Rotational -9.43% 8.35% 5.13% -3.73% 6.44% 7.78%
5.2 Two Degree of Freedom Artificial Discs
The artificial discs results for the two degree of freedom case have been divided into three separate combinations of degrees of freedom xy, yz, and xz or Shear-compressive, compressive-rotational and Shear-rotational respectively. Each disc was implanted at L4 – L5 and L5 – S1 levels. The following results are divided and presented by level and degree of freedom.
5.2.1 L4 – L5 Level Degeneration
The following results reflect the 2 degree of freedom ADR’s, fused vertebrae and degenerated disc cases at the L4 – L5 level.
5.2.1.1 Shear-Compressive ADR
0 0.000005 0.00001 0.000015 0.00002 0.000025 0.00003 0.000035 0.00004
G-T T-L1 L1-L2 L2-L3 L3-L4 L4-L5 L5-S1P S1P-G
Se gm e nt
D
is
p
la
c
e
m
e
n
t
(m
)
Healthy Degenerated Fused ADR
Figure 5-21: Posterior Anterior response of a Shear-compressive ADR at L4-L5
0 0.000001 0.000002 0.000003 0.000004 0.000005 0.000006
G-T T-L1 L1-L2 L2-L3 L3-L4 L4-L5 L5-S1P S1P-G
Se gm e nt
D
is
p
la
c
e
m
e
n
t
(m
)
Healthy Degenerated Fus ed A DR
0 0.00005 0.0001 0.00015 0.0002 0.00025 0.0003 0.00035 0.0004 0.00045 0.0005
G-T T-L1 L1-L2 L2-L3 L3-L4 L4-L5 L5-S1P S1P-G
Se gm e nt
R
o
ta
ti
o
n
(
R
a
d
)
Heralthy Degenerated Fused A DR
Figure 5-23: Flexion Extension response of a Shear-compressive ADR at L4-L5
5.2.1.2 Compressive-Rotational ADR
Figures 5-24 – 5-26 show the response of the lumbar spine to an impulsive shearing force acting on L3. The figures include the response of a spine with a degenerated disc, fused disc and a compressive-rotational ADR at the L4 – L5 level as well as the response of a healthy spine.
0 0.000005 0.00001 0.000015 0.00002 0.000025 0.00003 0.000035 0.00004
G-T T-L1 L1-L2 L2-L3 L3-L4 L4-L5 L5-S1P S1P-G
Se gm e nt
D
is
p
la
c
e
m
e
n
t
(m
)
Healthy Degenerated Fused ADR
0 0.000001 0.000002 0.000003 0.000004 0.000005 0.000006
G-T T-L1 L1-L2 L2-L3 L3-L4 L4-L5 L5-S1P S1P-G
Se gm e nt
D
is
p
la
c
e
m
e
n
t
(m
)
Healthy Degenerated Fus ed A DR
Figure 5-25: Axial response of a compressive-rotational ADR at L4-L5
0 0.00005 0.0001 0.00015 0.0002 0.00025 0.0003 0.00035 0.0004 0.00045 0.0005
G-T T-L1 L1-L2 L2-L3 L3-L4 L4-L5 L5-S1P S1P-G
Se gm e nt
R
o
ta
ti
o
n
(
R
a
d
)
Heralthy Degenerated Fused A DR
Figure 5-26: Flexion Extension response of a compressive-rotational ADR at L4-L5
5.2.1.3 Shear-Rotational ADR
0 0.000005 0.00001 0.000015 0.00002 0.000025 0.00003 0.000035 0.00004
G-T T-L1 L1-L2 L2-L3 L3-L4 L4-L5 L5-S1P S1P-G
Se gm e nt
D
is
p
la
c
e
m
e
n
t
(m
)
Healthy Degenerated Fused ADR
Figure 5-27: Posterior Anterior response of a Shear-rotational ADR at L4-L5
0 0.000001 0.000002 0.000003 0.000004 0.000005 0.000006
G-T T-L1 L1-L2 L2-L3 L3-L4 L4-L5 L5-S1P S1P-G
Se gm e nt
D
is
p
la
c
e
m
e
n
t
(m
)
Healthy Degenerated Fus ed A DR
0 0.00005 0.0001 0.00015 0.0002 0.00025 0.0003 0.00035 0.0004 0.00045 0.0005
G-T T-L1 L1-L2 L2-L3 L3-L4 L4-L5 L5-S1P S1P-G
Se gm e nt
R
o
ta
ti
o
n
(
R
a
d
)
Heralthy Degenerated Fused A DR
Figure 5-29: Flexion Extension response of a Shear-rotational ADR at L4-L5
5.2.1.4 Result Summary of Two Degree of Freedom L4 – L5 ADR’s
Tables 5-7 through 5-9 show a comparative summary of the results obtained for each 2-degree of freedom L4 - L5 ADR case.
Table 5-7: Posterior Anterior intervertebral displacement summary for the 2-DOF L4-L5 ADR cases
Posterior Anterior Intervertebral Displacement % Difference
T-L1 L1-L2 L2-L3 L3-L4 L4-L5 L5-S1P
Healthy 0.00% 0.00% 0.00% 0.00% 0.00% 0.00% Degenerated 0.61% 0.09% -0.89% 0.75% 0.36% -2.43% Fused 4.17% -3.46% -29.48% 17.49% -57.74% 17.64% Shear-Compressive 1.72% -0.09% -1.89% 1.61% 0.98% -5.99% Compressive-Rotational 2.57% -3.10% -26.25% 16.63% -57.30% 20.39% Shear-Rotational -0.37% -0.09% 0.56% 0.21% -0.09% 0.16%
Table 5-8: Axial intervertebral displacement summary for the 2-DOF L4-L5 ADR cases
Axial Intervertebral Displacement % Difference
T-L1 L1-L2 L2-L3 L3-L4 L4-L5 L5-S1P
Table 5-9: Flexion Extension intervertebral rotation summary for the 2-DOF L4-L5 ADR cases
Flexion Extension Intervertebral Rotation % Difference
T-L1 L1-L2 L2-L3 L3-L4 L4-L5 L5-S1P
Healthy 0.00% 0.00% 0.00% 0.00% 0.00% 0.00% Degenerated -0.62% -0.86% 2.59% 0.47% -44.77% -1.60% Fused -15.90% 4.22% 6.35% -3.46% -99.93% 13.76% Shear-Compressive -1.57% 0.71% 4.41% 1.85% -99.93% -3.22% Compressive-Rotational -15.27% 5.85% 4.55% -2.31% -8.13% 13.36% Shear-Rotational 0.22% 0.02% -0.38% 0.22% 0.77% 0.01%
5.2.2 L5 – S1 Level Degeneration
The following results reflect the 2 degree of freedom ADR’s, fused vertebrae and degenerated disc cases at the L5 – S1 level.
5.2.2.1 Shear-Compressive ADR
Figures 5-30 – 5-32 show the response of the lumbar spine to an impulsive shearing force acting on L3. The figures include the response of a spine with a degenerated disc, fused disc and a Shear-compressive ADR at the L5 – S1 level as well as the response of a healthy spine.
0 0.000005 0.00001 0.000015 0.00002 0.000025 0.00003 0.000035 0.00004
G-T T-L1 L1-L2 L2-L3 L3-L4 L4-L5 L5-S1P S1P-G
Se gm e nt
D
is
p
la
c
e
m
e
n
t
(m
)
Healthy Degenerated Fus ed ADR
0 0.000001 0.000002 0.000003 0.000004 0.000005 0.000006
G-T T-L1 L1-L2 L2-L3 L3-L4 L4-L5 L5-S1P S1P-G
Se gm e nt
D
is
p
la
c
e
m
e
n
t
(m
)
Healthy Degenerated Fused ADR
Figure 5-31: Axial response of a Shear-compressive ADR at L5-S1
0 0.00005 0.0001 0.00015 0.0002 0.00025 0.0003 0.00035 0.0004 0.00045
G-T T-L1 L1-L2 L2-L3 L3-L4 L4-L5 L5-S1P S1P-G
Se gm e nt
R
o
ta
ti
o
n
(
R
a
d
)
Healthy Degenerated Fused A DR
Figure 5-32: Flexion Extension response of a Shear-compressive ADR at L5-S1
5.2.2.2 Compressive-Rotational ADR
0 0.000005 0.00001 0.000015 0.00002 0.000025 0.00003 0.000035 0.00004
G-T T-L1 L1-L2 L2-L3 L3-L4 L4-L5 L5-S1P S1P-G
Se gm e nt
D
is
p
la
c
e
m
e
n
t
(m
)
Healthy Degenerated Fus ed ADR
Figure 5-33: Posterior Anterior response of a compressive-rotational ADR at L5-S1
0 0.000001 0.000002 0.000003 0.000004 0.000005 0.000006
G-T T-L1 L1-L2 L2-L3 L3-L4 L4-L5 L5-S1P S1P-G
Se gm e nt
D
is
p
la
c
e
m
e
n
t
(m
)
Healthy Degenerated Fused ADR
0 0.00005 0.0001 0.00015 0.0002 0.00025 0.0003 0.00035 0.0004 0.00045 0.0005
G-T T-L1 L1-L2 L2-L3 L3-L4 L4-L5 L5-S1P S1P-G
Se gm e nt
R
o
ta
ti
o
n
(
R
a
d
)
Healthy Degenerated Fused A DR
Figure 5-35: Flexion Extension response of a compressive-rotational ADR at L5-S1
5.2.2.3 Shear-Rotational ADR
Figures 5-36 – 5-38 show the response of the lumbar spine to an impulsive shearing force acting on L3. The figures include the response of a spine with a degenerated disc, fused disc and a Shear-rotational ADR at the L5 – S1 level as well as the response of a healthy spine.
0 0.000005 0.00001 0.000015 0.00002 0.000025 0.00003 0.000035 0.00004
G-T T-L1 L1-L2 L2-L3 L3-L4 L4-L5 L5-S1P S1P-G
Se gm e nt
D
is
p
la
c
e
m
e
n
t
(m
)
Healthy Degenerated Fus ed ADR
0 0.000001 0.000002 0.000003 0.000004 0.000005 0.000006
G-T T-L1 L1-L2 L2-L3 L3-L4 L4-L5 L5-S1P S1P-G
Se gm e nt
D
is
p
la
c
e
m
e
n
t
(m
)
Healthy Degenerated Fused ADR
Figure 5-37: Axial response of a Shear-rotational ADR at L5-S1
0 0.00005 0.0001 0.00015 0.0002 0.00025 0.0003 0.00035 0.0004 0.00045
G-T T-L1 L1-L2 L2-L3 L3-L4 L4-L5 L5-S1P S1P-G
Se gm e nt
R
o
ta
ti
o
n
(
R
a
d
)
Healthy Degenerated Fused A DR
Figure 5-38: Flexion Extension response of a Shear-rotational ADR at L5-S1
5.2.2.4 Result Summary of Two Degree of Freedom L5 – S1 ADR’s
Table 5-10: Posterior Anterior intervertebral displacement summary for the 2-DOF L5-S1 ADR cases
Posterior Anterior Intervertebral Displacement % Difference
T-L1 L1-L2 L2-L3 L3-L4 L4-L5 L5-S1P
Healthy 0.00% 0.00% 0.00% 0.00% 0.00% 0.00% Degenerated 1.96% -0.35% -11.35% 0.97% -4.63% -2.59% Fused -6.62% -34.31% -13.90% 3.97% -8.19% -81.23% Shear-Compressive 5.51% -8.95% -20.02% -4.08% -13.88% -9.39% Compressive-Rotational 6.99% -1.95% -20.24% 17.70% -1.25% -58.58% Shear-Rotational -0.49% 0.00% 0.33% -0.21% -0.27% 0.49%
Table 5-11: Axial intervertebral displacement summary for the 2-DOF L5-S1 ADR cases
Axial Intervertebral Displacement % Difference
T-L1 L1-L2 L2-L3 L3-L4 L4-L5 L5-S1P
Healthy 0.00% 0.00% 0.00% 0.00% 0.00% 0.00% Degenerated -7.89% -2.86% -12.62% -7.27% -2.04% -21.60% Fused -59.87% 17.14% -11.65% -43.64% 57.14% -100.00% Shear-Compressive -28.29% 8.57% -41.75% -10.00% 36.73% -100.00% Compressive-Rotational -26.32% 37.14% 6.80% -28.18% 0.00% 8.80% Shear-Rotational -1.32% 2.86% -9.71% 5.45% 6.12% -0.80%
Table 5-12: Flexion Extension intervertebral rotation summary for the 2-DOF L5-S1 ADR cases
Flexion Extension Intervertebral Rotation % Difference
T-L1 L1-L2 L2-L3 L3-L4 L4-L5 L5-S1P
Healthy 0.00% 0.00% 0.00% 0.00% 0.00% 0.00% Degenerated -3.64% -5.77% -6.26% -13.62% 8.59% -38.07% Fused -19.73% -5.03% -14.65% -40.88% 82.21% -99.88% Shear-Compressive -8.77% -12.54% -18.29% -32.12% 55.18% -99.86% Compressive-Rotational -9.49% 8.50% 5.35% -3.61% 5.99% 7.63% Shear-Rotational 0.06% -0.55% -0.09% 0.28% -0.39% 0.02%
5.3 Three Degree of Freedom Artificial Disc
The artificial discs results for the three degree of freedom cases have been divided in two, implanted at L4 – L5 and L5 – S1 levels. The following results show the behavior of the spine with the artificial disc, fused disc and degenerated disc at each level.
5.3.1 L4 – L5 Level Degeneration
0 0.000005 0.00001 0.000015 0.00002 0.000025 0.00003 0.000035 0.00004
G-T T-L1 L1-L2 L2-L3 L3-L4 L4-L5 L5-S1P S1P-G
Se gm e nt
D
is
p
la
c
e
m
e
n
t
(m
)
Healthy Degenerated Fused ADR
Figure 5-39: Anterior Posterior response of a full 3-degree of freedom ADR at L4-L5
0 0.000001 0.000002 0.000003 0.000004 0.000005 0.000006
G-T T-L1 L1-L2 L2-L3 L3-L4 L4-L5 L5-S1P S1P-G
Se gm e nt
D
is
p
la
c
e
m
e
n
t
(m
)
Healthy Degenerated Fus ed A DR
0 0.00005 0.0001 0.00015 0.0002 0.00025 0.0003 0.00035 0.0004 0.00045 0.0005
G-T T-L1 L1-L2 L2-L3 L3-L4 L4-L5 L5-S1P S1P-G
Se gm e nt
R
o
ta
ti
o
n
(
R
a
d
)
Heralthy Degenerated Fused A DR
Figure 5-41: Flexion Extension response of a full 3-degree of freedom ADR at L4-L5
5.3.1.1 Result Summary of Three Degree of Freedom L4 – L5 ADR’s
Tables 5-13 through 5-15 show a comparative summary of the results obtained for each 3-degree of freedom L4 – L5 ADR case.
Table 5-13: Posterior Anterior intervertebral displacement summary for the 3-DOF L4-L5 ADR case
Posterior Anterior Intervertebral Displacement % Difference
T-L1 L1-L2 L2-L3 L3-L4 L4-L5 L5-S1P
Healthy 0.00% 0.00% 0.00% 0.00% 0.00% 0.00% Degenerated 0.61% 0.09% -0.89% 0.75% 0.36% -2.43% Fused 4.17% -3.46% -29.48% 17.49% -57.74% 17.64% 3-DOF 0.00% 0.00% 0.00% 0.00% 0.00% 0.00%
Table 5-14: Axial intervertebral displacement summary for the 3-DOF L4-L5 ADR case
Axial Intervertebral Displacement % Difference
T-L1 L1-L2 L2-L3 L3-L4 L4-L5
L5-S1P
Healthy 0.00% 0.00% 0.00% 0.00% 0.00% 0.00% Degenerated 0.00% 14.29% -3.88% 10.00% -53.06% -2.40% Fused -38.16% 94.29% -33.98% 10.91% -100.00% 7.20% 3-DOF 0.00% 0.00% 0.00% 0.00% 0.00% 0.00%
Table 5-15: Flexion Extension intervertebral rotation summary for the 3-DOF L4-L5 ADR case
Flexion Extension Intervertebral Rotation % Difference
T-L1 L1-L2 L2-L3 L3-L4 L4-L5 L5-S1P
5.3.2 L5 – S1 Level Degeneration
Figures 5-42 – 5-44 show the response of the lumbar spine to an impulsive shearing force acting on L3. The figures include the response of a spine with a degenerated disc, fused disc and a full 3-degree of freedom ADR at the L5 – S1 level as well as the response of a healthy spine. It is assumed that the 3-DOF ADR exactly matches the healthy disc, so the results for the ADR and the healthy disc are identical in this section.
0 0.000005 0.00001 0.000015 0.00002 0.000025 0.00003 0.000035 0.00004
G-T T-L1 L1-L2 L2-L3 L3-L4 L4-L5 L5-S1P S1P-G
Se gm e nt
D
is
p
la
c
e
m
e
n
t
(m
)
Healthy Degenerated Fus ed ADR
Figure 5-42: Anterior Posterior response of a full 3-degree of freedom ADR at L5-S1
0 0.000001 0.000002 0.000003 0.000004 0.000005 0.000006
G-T T-L1 L1-L2 L2-L3 L3-L4 L4-L5 L5-S1P S1P-G
Se gm e nt
D
is
p
la
c
e
m
e
n
t
(m
)
Healthy Degenerated Fused ADR
0 0.00005 0.0001 0.00015 0.0002 0.00025 0.0003 0.00035 0.0004 0.00045
G-T T-L1 L1-L2 L2-L3 L3-L4 L4-L5 L5-S1P S1P-G
Se gm e nt
R
o
ta
ti
o
n
(
R
a
d
)
Healthy Degenerated Fused A DR
Figure 5-44: Flexion Extension response of a full 3-degree of freedom ADR at L5-S1
5.3.2.1 Result Summary of Three Degree of Freedom L5 – S1 ADR’s
Tables 5-16 through 5-18 show a comparative summary of the results obtained for each 3-degree of freedom L5–S1 ADR case.
Table 5-16: Posterior Anterior intervertebral displacement summary for the 3-DOF L5-S1 ADR case
Posterior Anterior Intervertebral Displacement % Difference
T-L1 L1-L2 L2-L3 L3-L4 L4-L5 L5-S1P
Healthy 0.00% 0.00% 0.00% 0.00% 0.00% 0.00% Degenerated -9.80% 13.36% -22.60% 1.86% -9.54% -1.03% Fused -20.39% -38.66% -84.93% -6.45% -20.88% -79.49% 3-DOF 0.00% 0.00% 0.00% 0.00% 0.00% 0.00%
Table 5-17: Axial intervertebral displacement summary for the 3-DOF L5-S1 ADR case
Axial Intervertebral Displacement % Difference
T-L1 L1-L2 L2-L3 L3-L4 L4-L5 L5-S1P
Healthy 0.00% 0.00% 0.00% 0.00% 0.00% 0.00% Degenerated -7.89% -2.86% -12.62% -7.27% -2.04% -21.60% Fused -59.87% 17.14% -11.65% -43.64% 57.14% -100.00% 3-DOF 0.00% 0.00% 0.00% 0.00% 0.00% 0.00%
Table 5-18: Flexion Extension intervertebral rotation summary for the 3-DOF L5-S1 ADR case
Flexion Extension Intervertebral Rotation % Difference
T-L1 L1-L2 L2-L3 L3-L4 L4-L5 L5-S1P
5.4 Results Summary
The following tables summarize all the results obtained by level of implantation, L4 – L5 and L5 – S1.
5.4.1 L4 – L5 ADR’s
Tables 5-19 through 5-21 show a comparative summary of all the results obtained for each ADR case implanted at the L4 – L5 level.
Table 5-19: Posterior Anterior intervertebral displacement summary for all L4-L5 ADR cases
Posterior Anterior Intervertebral Displacement % Difference
T-L1 L1-L2 L2-L3 L3-L4 L4-L5 L5-S1P Healthy 0.00% 0.00% 0.00% 0.00% 0.00% 0.00% Degenerated 0.20% 0.61% 1.13% 1.58% 0.52% -2.31% Fused -23.14% 19.64% -58.19% 15.90% -58.63% 26.92% Shear 0.39% 0.40% 1.32% 2.01% 1.68% -6.41% Compressive -22.94% 19.23% -58.19% 15.76% -58.25% 25.90% Rotational -23.92% 19.84% -58.19% 15.04% -57.99% 28.72% Shear-Compressive 0.39% 0.61% 2.07% 2.15% 2.19% -6.41% Compressive-Rotational -23.73% 20.04% -58.38% 15.33% -57.73% 27.69% Shear-Rotational 0.20% -0.20% -0.19% 0.00% -0.13% 0.26% 3-DOF 0.00% 0.00% 0.00% 0.00% 0.00% 0.00%
Table 5-20: Axial intervertebral displacement summary for all L4-L5 ADR cases
Axial Intervertebral Displacement % Difference
T-L1 L1-L2 L2-L3 L3-L4 L4-L5 L5-S1P Healthy 0.00% 0.00% 0.00% 0.00% 0.00% 0.00% Degenerated 0.00% 14.29% -3.88% 10.00% -53.06% -2.40% Fused -38.16% 94.29% -33.98% 10.91% -100.00% 7.20% Shear 3.95% 77.14% -30.10% 8.18% -100.00% -8.80% Compressive -34.21% 94.29% -25.24% 4.55% -95.92% 7.20% Rotational -40.79% 82.86% -36.89% 14.55% -30.61% 16.00% Shear-Compressive 2.63% 80.00% -25.24% 4.55% -95.92% -8.00%
Table 5-21: Flexion Extension intervertebral rotation summary for all L4-L5 ADR cases
Flexion Extension Intervertebral Rotation % Difference
T-L1 L1-L2 L2-L3 L3-L4 L4-L5 L5-S1P Healthy 0.00% 0.00% 0.00% 0.00% 0.00% 0.00% Degenerated -0.62% -0.86% 2.59% 0.47% -44.77% -1.60% Fused -15.90% 4.22% 6.35% -3.46% -99.93% 13.76% Shear -1.10% 0.29% 4.20% 1.75% -99.88% -2.36% Compressive -16.00% 3.94% 6.29% -3.32% -99.86% 13.64% Rotational -15.08% 5.81% 4.58% -2.41% -7.70% 13.41% Shear-Compressive -1.57% 0.71% 4.41% 1.85% -99.93% -3.22%
Compressive-Rotational -15.27% 5.85% 4.55% -2.31% -8.13% 13.36% Shear-Rotational 0.22% 0.02% -0.38% 0.22% 0.77% 0.01% 3-DOF 0.00% 0.00% 0.00% 0.00% 0.00% 0.00%
5.4.2 L5 – S1 ADR’s
Tables 5-19 through 5-21 show a comparative summary of all the results obtained for each ADR case implanted at the L5 – S1 level.
Table 5-22: Posterior Anterior intervertebral displacement summary for all L5-S1 ADR cases
Posterior Anterior Intervertebral Displacement % Difference
T-L1 L1-L2 L2-L3 L3-L4 L4-L5 L5-S1P Healthy 0.00% 0.00% 0.00% 0.00% 0.00% 0.00% Degenerated 1.96% -0.35% -11.35% 0.97% -4.63% -2.59% Fused -6.62% -34.31% -13.90% 3.97% -8.19% -81.23% Shear 5.27% -8.95% -20.36% -3.76% -14.23% -9.06% Compressive -6.25% -34.22% -14.24% 3.76% -8.45% -81.23% Rotational 7.11% -1.77% -20.36% 17.81% -1.25% -58.58% Shear-Compressive 5.51% -8.95% -20.02% -4.08% -13.88% -9.39% Compr
![Figure 2-4: Intervertebral disc (a) Healthy disc, (b) degenerated disc [McLean, The Spine]](https://thumb-us.123doks.com/thumbv2/123dok_us/1221068.1153755/20.612.258.410.160.328/figure-intervertebral-disc-healthy-disc-degenerated-mclean-spine.webp)
![Figure 3-1: X-Ray of stainless steel ball ADR [Bono, History]](https://thumb-us.123doks.com/thumbv2/123dok_us/1221068.1153755/22.612.250.362.270.416/figure-ray-stainless-steel-ball-adr-bono-history.webp)