VOT 74289
THE DEVELOPMENT OF SEMANTIC META-DATABASE: AN ONTOLOGY BASED SEMANTIC INTEGRATION OF BIOLOGICAL
DATABASES
(PEMBANGUNAN PENGKALAN DATA-META SEMANTIK : ONTOLOGI BERASASKAN INTEGRASI SEMANTIK KEPADA PENGKALAN DATA
BIOLOGI)
RUHAIDAH BINTI SAMSUDIN SAFAAI BIN DERIS
MUHAMAD RAZIB BIN OTHMAN ROSLI BIN MD ILLIAS SAFIE BIN MAT YATIM
RESEARCH VOT NO: 74289
Jabatan Kejuruteraan Perisian
Fakulti Sains Komputer Dan Sistem Maklumat Universiti Teknologi Malaysia
ABSTRACT
ABSTRAK
TABLE OF CONTENTS
CHAPTER TITLE PAGE
ABSTRACT ii
ABSTRAK iii
TABLE OF CONTENTS iv
LIST OF TABLES vii
LIST OF FIGURES ix
LIST OF ABBREVIATIONS xi
1 INTRODUCTION 1
1.1 Overview 1
1.2 Current Methods for Protein Sequence Annotation 2 1.3 Challenges of Protein Sequence Annotation 3
1.4 Statement of the Problem 4
1.5 Objective of the Study 6
1.6 Scope and Significant of the Study 6
1.7 Organization of the Thesis 7
2 LITERATURE REVIEW 9
2.1 Introduction 9
2.2 Protein Sequence Annotation 10
2.3 The Gene Ontology 15
2.4 Automatic Clustering Algorithms 20
2.5 Semantic Similarity Searching Algorithms 25 2.6 Protein Sequence Annotation Tools 26
2.8 Summary 29
3 RESEARCH METHODOLOGY 30
3.1 Introduction 30
3.2 Framework of the Study 31
3.3 Data Sources 33
3.4 Instrumentation and Results Analysis 34
3.5 Summary 35
4 THE GENETIC SPLIT-MERGE ALGORITHM FOR 36 SPLITTING THE MONOLITHIC GENE ONTOLOGY
RDF/XML FILE
4.1 Introduction 36
4.2 Related Work 38
4.3 The Genetic Split-Merge Algorithm 40
4.3.1 Chromosome Representation 40
4.3.2 Crossover and Mutation Operators 41
4.3.3 Split and Merge Functions 42
4.3.4 Fitness Function 45
4.3.5 Parallelization Process 46
4.4 Testing Preparation and Evaluation Measures 46
4.5 Results and Discussion 48
4.6 Summary 54
5 THE GENETIC SIMILARITY ALGORITHM FOR 55 SEARCHING THE GENE ONTOLOGY TERMS
5.1 Introduction 55
5.2 Related Work 57
5.3 The Semantic Similarity Measure Algorithm 60
5.3.1 Information Content Approach 61
5.3.2 Conceptual Distance Approach 62
5.3.3 The Hybrid Approach 63
5.4 The Genetic Similarity Algorithm 63
5.4.2 Chromosome Representation 66 5.4.3 Crossover and Mutation Operators 69
5.4.4 Fitness Function 69
5.4.5 Parallelization Process 71
5.5 The basic UTMGO 72
5.6 Testing Preparation and Evaluation Measures 75
5.7 Results and Discussion 76
5.8 Summary 82
6 extended UTMGO: A GENE ONTOLOGY-BASED 83 PROTEIN SEQUENCE ANNOTATION TOOL
6.1 Introduction 83
6.2 Related Work 86
6.3 The extended UTMGO 87
6.4 Testing Preparation and Evaluation Measures 91
6.5 Results and Discussion 91
6.6 Summary 93
7 CONCLUSION 95
7.1 Concluding Remarks 95
7.2 Contributions 98
7.3 Future Works and Constraints 99
7.4 Summary 100
LIST OF RELATED PUBLICATIONS 101
LIST OF TABLES
TABLE NO. TITLE PAGE
2.1 Size of the GO data 19
4.1 Parameters of the genetic split-merge algorithm 48 4.2 The effects of different number of processors used 49
on the performance of the genetic split-merge algorithm
4.3 Comparison of different fitness functions 50 4.4 Comparison of different clustering algorithms 50 4.5 Comparison of different automatic clustering 52 algorithms
5.1 Parameters of the genetic similarity algorithm 76 5.2 Comparison of genetic similarity algorithm with 77
different semantic similarity measures
5.3 An example of comparison of different semantic 78
similarity measures
5.4 The effects of different combinations of parameters 79
α and β on the values of the recall (r), precision (p), and maximum value of fitness function (f)
5.5 The effects of different number of processors used 79 on the performance of the genetic similarity
algorithm
5.6 Comparison of performance between basic 80
UTMGO and other keyword-based and semantic similarity-based GO browsers
based GO browsers
6.1 Comparison of performance between extended 93
UTMGO and other GO-based protein sequence
annotation tools
6.2 An example of comparison between extended 94
UTMGO and other GO-based protein sequence
LIST OF FIGURES
FIGURE NO. TITLE PAGE
2.1 The protein sequence illustration 11
2.2 Three different ways of inferring protein function 12 from the protein sequence
2.3 Phases of protein sequence annotation in the 14 UniProt
2.4 The GO sub-ontologies 17
2.5 The properties of the GO term 18
3.1 The framework of the study 31
4.1 The genetic split-merge algorithm 41
4.2 An example of chromosome representation 42 4.3 The parallelization flow of the genetic split-merge 47 algorithm
4.4 Cluster utilization of different clustering algorithms 51 4.5 Cluster utilization of different automatic clustering 52 algorithms
4.6 An example of part of a smaller GO RDF/XML file 53 5.1 The semantic similarity measure algorithm 60
5.2 The genetic similarity algorithm 64
5.3 An example of preprocessing 65
5.4 An example of generating initial population 67 5.5 An example of mapping of a GO graph into a 68 chromosome
5.6 An example of the best chromosome produced by 70 mutation and crossover operators
algorithm
5.8 A screenshot of the basic UTMGO 74
6.1 The flowchart of the extended UTMGO 86
6.2 A screenshot of the extended UTMGO with a GO 89 term entered by the user (Option 1)
LIST OF ABBREVIATIONS
BIC - Bayesian Information Criterion BLAST - Basic Local Alignment Search Tool BLOSUM - Blocks Substitution Matrix
CDS - Coding Sequence
CFG - Comparing Factor Group DAG - Directed Acyclic Graph
DBI - Davies-Bouldin index
DDBJ - Deoxyribonucleic acid Data Bank of Japan
DNA - Deoxyribonucleic acid
EBI - European Bioinformatics Institute EMBL - European Molecular Biology Laboratory EST - Expressed Sequence Tag
ExPASy - Expert Protein Analysis System
EXProt - Experimentally Verified Protein Functions
FASTA - Fast Alignment
GO - Gene Ontology
GOA - Gene Ontology Annotation GPP - Graph Partitioning Problem IC - Inferred from Curator
IEA - Inferred from Electronic Annotation IMP - Inferred from Mutant Phenotype
JSP - Java Server Pages
MGI - Mouse Genome Informatics
PAM - Point Accepted Mutations
PANDIT - Protein and Associated Nucleotide Domains with Inferred Trees
PC - Personal Computer
PDB - Protein Data Bank
PIR - Protein Information Resource PRF - Protein Research Foundation QOC - Quality of Clustering
RCA - Inferred from Reviewed Computational Analysis RDBMS - Relational Database Management Systems RefSeq - Reference Sequence
SFG - Selecting Factor Group
SGD - Saccharomyces Genome Database SIB - Swiss Institute of Bioinformatics Swiss-Prot - Swiss Protein
TAIR - The Arabidopsis Information Resource TCDB - Transporter Classification Database
TrEMBL - Translated European Molecular Biology Laboratory UniParc - Universal Protein Resource Archive
UniProt - Universal Protein Resource
UniProtKB - Universal Protein Resource Knowledgebase UniRef - Universal Protein Resource Reference Clusters US NLM - United States National Library of Medicine USDA - United States Department of Agriculture VLSI - Very Large Scale of Integration
CHAPTER 1
INTRODUCTION
1.1 Overview
from the biological community, and active curation to sustain the quality and integrity of data. The GO is a collection of nearly 23 thousand terms to describe gene and gene product attributes in any organism. The terms are structured, controlled vocabularies and organized as a Directed Acyclic Graph (DAG) in three aspects: cellular component, biological process, and molecular function.
1.2 Current Methods for Protein Sequence Annotation
Instead of traditional wet-lab methods that are manually done by the biologists, the computational methods for automated protein sequence annotation can be divided into four main categories as follows:
(i) Sequence-similarity-based method depends on the determination of a local or global similarity between the not-yet annotated protein sequence and protein sequences with known annotation. This method uses sequence similarity search algorithms such as Smith-Waterman and Needleman-Wunsch algorithms.
(ii) Controlled-vocabulary-based method employs the most widely used biological ontology, the GO along with its annotation databases to annotate protein sequence.
(iii) Literature-based method relies on natural language processing and text mining techniques to extract information from the biomedical literature as evidence to annotate protein sequence.
(iv) Rule-based method annotates protein sequence based on condition and existence of certain rules. The rules are created according to information extracted from the secondary databases such as protein families, domains, and functional sites databases.
(i) The GO data is dynamic and constantly evolves according to the current state of biological knowledge advances.
(ii) The GO data is publicly available and can be downloaded at any time on the World Wide Web (WWW) in various formats that can be understandable and processable by human and machine alike.
(iii) The common GO terms shared by gene and protein sequences in multiple organisms in different databases can facilitate uniform queries across them.
(iv) The association of GO terms with nearly 2.5 million gene products that are supported by citation and evidence can affirm its reliability for future evaluation and use.
1.3 Challenges of Protein Sequence Annotation
Application of the GO terms to annotate protein sequences is not easy, especially for species not yet inserted in public biological databases. Furthermore, for bioscientists with little computational knowledge or limited facilities it is a hard task to annotate those protein sequences. This is due to the fact that generally the existing GO-based protein sequence annotation tools are:
(i) Dependent on BLAST which is computationally intensive and requires high-cost and high-specification hardware since sequence alignment is performed to all protein sequences but not to protein sequences only that indicate higher similarity.
(ii) Dependent on Relational Database Management Systems (RDBMS) which require the user to setup the RDBMS software and to import the data or sources into the RDBMS format.
Furthermore, the traditional wet-lab methods are labor intensive and prone to human error. On the other hand, sequence-similarity-based tools like BLAST that are used by most of the computational methods as described in Section 1.2 are time intensive and require high investment in computing facilities such as cluster server or grid computing if being used locally. Moreover, for remote users, these tools are subject to internet stability and speed to access the tools and to get the results online.
1.4 Statement of the Problem
The macro (application) problem that is tried to be solved in this study can be described as follows:
“Given a protein sequence, it is a challenging task to develop a new GO-based method to annotate protein sequences that does not depend on BLAST and RDBMS and is fully based on the GO data. At the same time it is capable of producing better results and requires a reasonable amount of running time with low computing cost specifically for offline usage”.
In order to develop the new GO-based method to annotate protein sequences, the following factors need to be considered:
(i) The first factor relates to the process of splitting the monolithic GO RDF/XML file into smaller files. The aims are to avoid dependency on RDBMS format, to fully use the GO data by adding the GOA data and the protein sequence data sets into the files since they are excluded in the original GO RDF/XML file, and to make it easier to be accessed and processed.
(iii) The third factor relates to the process of verifying the results obtained from the second factor by computing sequence alignment score between the query protein sequence and all sequences attached to the predicted GO terms. The aim is to ensure that sequence alignment is not carried out to all protein sequences but only to protein sequences with higher outguessed similarity. Hence, it will require low cost and minimum hardware specification and less amount of processing time.
The factors as described above lead to more technical and theoretical problems. These micro (research) problems are related to automatic clustering and semantic similarity searching. Automatic clustering is an unsupervised learning problem that tries to divide a set of elements into a number k of clusters. Thus, elements in the same cluster are as similar as possible and elements in different clusters are as dissimilar as possible. Determining the number k of clusters is done by the algorithm and it can be regarded as a hard algorithmic problem. To cluster the GO terms into the number k of clusters in order to split the monolithic GO RDF/XML file, the following questions need to be answered:
(i) What is the most suitable clustering algorithm that provides optimal solution and offers reasonable amount of processing time?
(ii) What is the precise criterion for identifying the number k of clusters and for measuring the goodness of those clusters?
On the other hand, semantic similarity searching relates to the problem of determining semantic relatedness between terms either by virtue of their likeness (bank-trust company), synonymy (car-automobile), meronymy (computer-keyboard), antonymy (rich-poor), functional relationship (marker pen-white board), or frequent association (orang utan-Borneo). For semantically similar GO terms, the terms are related according to “association”: a table storing information that is shared among the GO terms. Particularly, this table provides an annotation record that is basically a link between a gene product and a GO term provided by the GOA. To search the GO terms, the following questions need to be answered:
(i) What is the most suitable search algorithm that provides optimal solution and offers reasonable amount of processing time?
measuring the semantic similarity between the GO terms?
1.5 Objective of the Study
The goal of this study is to develop a computational method to annotate protein sequences using information in the GO. Therefore, this study has several objectives to achieve as follows:
(i) To study and design a GO-based method that uses intelligent techniques and the GO in order to annotate protein sequences.
(ii) To develop an automatic clustering algorithm using the genetic split-merge algorithm in order to split the monolithic GO RDF/XML file. (iii) To develop a similarity search algorithm using the genetic similarity
algorithm in order to find a group of semantically similar GO terms. (iv) To develop a tool as a proof-of-concept study that applied both
algorithms mentioned above in order to highlight the capabilities of the proposed GO-based method.
1.6 Scope and Significance of the Study
needed particularly for offline usage. In this study, a GO-based protein sequence annotation tool named extended UTMGO is developed to meet these features. The tool employs two primary intelligent algorithms. The first algorithm named genetic split-merge algorithm is used to split the monolithic GO RDF/XML file. The genetic split-merge algorithm applies the parallel genetic algorithm and the split-and-merge algorithm. The split-and-merge algorithm is implemented to improve infeasible clusters in order to efficiently estimate the number k of clusters. The second algorithm named genetic similarity algorithm is used to search for semantically similar GO terms from the fragmented GO RDF/XML files. The genetic similarity algorithm applies the parallel genetic algorithm and the semantic similarity measure algorithm. The semantic similarity measure algorithm is implemented due to its ability to improve the precision and recall of information retrieval by identifying the relation between GO terms. This is acquired by computing the distance or the amount of information those GO terms share in common. Both algorithms use the parallel genetic algorithm because of its capability of being adaptive, efficient, robust, and a global search method that is suitable to address a situation where the search space is large. Moreover, the parallel genetic algorithm optimizes its fitness function by utilizing the genetic operators to find an optimal solution. It can also be executed on a low-cost Personal Computer (PC) cluster using message passing interface libraries that are open source and easy to install.
1.7 Organization of the Thesis
This thesis is organized into 7 chapters. A brief description of the contents of each chapter is given as follows:
(i) Chapter 1 describes the problems, objective, scope, and significance of the study.
GO RDF/XML file and semantic similarity searching of GO terms, and related tools for protein sequence annotation.
(iii) Chapter 3 describes the operational framework adopted to achieve the objective of the study including the results analysis, instrumentations, and data sources used in the thesis.
(iv) Chapter 4 describes a solution of splitting the monolithic GO RDF/XML file using the genetic split-merge algorithm. The genetic split-merge algorithm combines the parallel genetic algorithm and the split-merge algorithm. The parallel genetic algorithm finds the best combination of node-cluster and the split-merge algorithm identifies the best number k of clusters kbest.
(v) Chapter 5 describes a solution of finding a group of semantically similar GO terms using the genetic similarity algorithm. The genetic similarity algorithm combines the parallel genetic algorithm and the semantic similarity measure algorithm. The semantic similarity measure algorithm computes the degree of relationship between the GO terms and the parallel genetic algorithm generates a solution comprising a group of semantically similar GO terms. A GO browser named basic UTMGO is introduced to show the applicability of the genetic similarity algorithm.
(vi) Chapter 6 describes a solution of annotating anonymous protein sequence using a GO-based protein sequence annotation tool named extended UTMGO. The extended UTMGO comprises two intelligent algorithms: the genetic split-merge algorithm and the genetic similarity algorithm.
CHAPTER 2
LITERATURE REVIEW
2.1 Introduction
2.4) and the semantic similarity searching algorithms (Section 2.5) that relates to the objectives of the study. A review of the protein sequence annotation tools is given in Section 2.6. Finally, the chapter concludes with findings of the literature review.
2.2 Protein Sequence Annotation
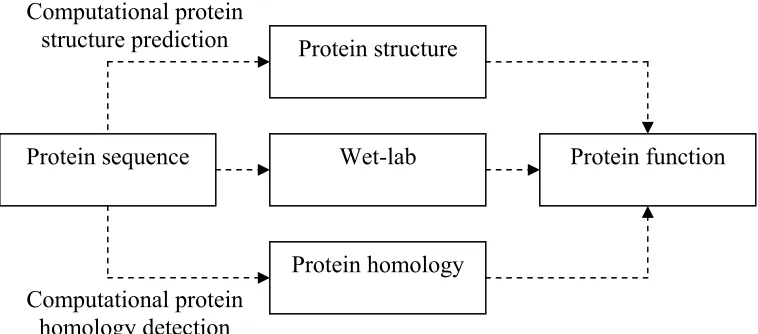
A protein sequence is a chain of amino acids that represents the primary structure of a protein as shown in Figure 2.1. The protein sequence plays a central role to determine the structure, homology, and function of a protein as depicted in Figure 2.2.
The database of protein sequences can be considered as primary database. It serves as a source for the construction of secondary databases that contain the results of analysis of the protein sequences in the primary databases. The secondary databases are related to protein families, domains, and functional sites. Examples of secondary databases are:
(i) PROSITE (http://www.expasy.ch/prosite/) is a database of protein families, domains, and functional sites. The PROSITE is provided by the Expert Protein Analysis System (ExPASy) proteomics server of the Swiss Institute of Bioinformatics (SIB).
(ii) Pfam (http://www.sanger.ac.uk/Pfam/) comprises many common protein families and domains. It is a database managed by the Wellcome Trust Sanger Institute.
(iii) Protein and Associated Nucleotide Domains with Inferred Trees (PANDIT; http://www.ebi.ac.uk/goldman-srv/pandit/) is a protein families database developed and maintained by the European Bioinformatics Institute (EBI).
>TAIR|gene:2828322 symbol:AT2G07727.1 species:3702
C
B
"Arabidopsis thaliana" Ncbi:NP_178804
MTIRNQRFSLLKQPISSTLNQHLVDYPTPSNLSYWWGFGPLAGICLVIQI VTGVFLAMHYTPHVDLAFNSVEHIMRDVEGGWLLRYMHANGASMFLIVVY LHIFRGLYHASYSSPREFVWCLGVVIFLLMIVTAFIGYVLPWGQMSFWGA TVITSLASAIPVVGDTIVTWLWGGFSVDNATLNRFFSLHHLLPFILVGAS LLHLAALHQYGSNNPLGVHSEMDKIAFYPYFYVKDLVGWVAFAIFFSIWI FYAPNVLGHPDNYIPANPMSTPPHIVPEWYFLPIHAILRSIPDKAGGVAA IAPVFICLLALPFFKSMYVRSSSFRPIHQGMFWLLLADCLLLGWIGCQPV EAPFVTIGQISPLVFFLFFAITPILGRVGRGIPNSYTDETDHT
A
Primary protein structure is sequence of a chain of aminoacids.
Secondary protein structure occurs when the sequence of amino acids are linked by hydrogen bonds.
Tertiary protein structure occurs when certain attractions are present between alpha helices and pleated sheets.
Quaternary protein structure is a protein consisting of more than one amino acid chain. Amino
Acids
Pleated sheet
Alpha helix
Pleated sheet Alpha helix Amino
Acid Amino
Acids
Primary protein structure is sequence of a chain of amino acids.
Figure 2.1: The protein sequence illustration: (A) The protein primary structure (source: the National Human Genome Research Institute (NHGRI)); (B) The protein sequence of AT2G07727.1 (Gene:2828322) in FASTA format (source: TAIR); (C) The four levels of protein
Protein structure
Wet-lab
Protein homology
Protein function Protein sequence
Computational protein homology detection Computational protein
structure prediction
Figure 2.2: Three different ways of inferring protein function from the protein sequence.
central resource on protein sequences and functional annotation. The UniProt consists of three main components:
(i) UniProt Knowledgebase (UniProtKB) provides extensive cross-references, functional and feature annotations, and literature-based evidence attribution for easy analysis and cross-database search. It comprises the manually annotated UniProtKB/Swiss-Prot section and the automatically annotated UniProtKB/TrEMBL section.
(ii) UniProt Reference Clusters (UniRef) offers speed similarity searches through sequence space compression by combining closely correlated sequences into a single record.
(iii) UniProt Archive (UniParc) stores all publicly available protein sequences, including their history and links to the source databases. The UniProt is maintained collaboratively by the SIB and the EBI. Other annotated protein sequence databases are Experimentally Verified Protein Functions (EXProt; http://www.cmbi.kun.nl/EXProt/), Protein Research Foundation (PRF; http://www.prf.or.jp/en/), and Transporter Classification Database (TCDB; http://www.tcdb.org/).
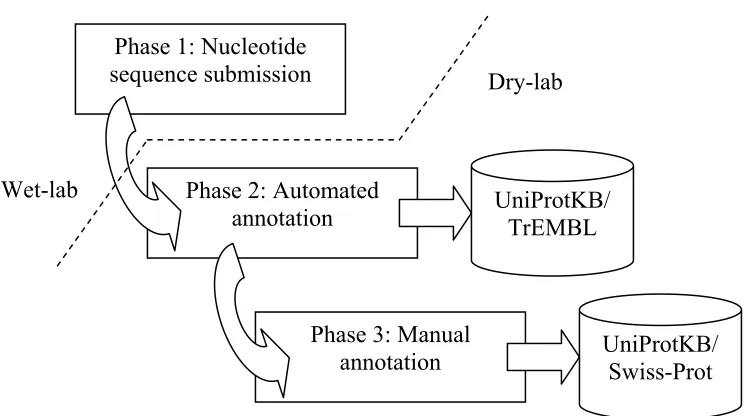
the UniProtKB/Swiss-Prot. The manual annotation is done by biologists and is based on literature curation and sequence analysis. The manual annotation procedures were described in detail by Apweiler et al. [11]. Further explanation of the annotation processes in the UniProt can be found in [12], [13].
Phase 1: Nucleotide sequence submission
Phase 2: Automated annotation
Phase 3: Manual annotation
UniProtKB/ TrEMBL
UniProtKB/ Swiss-Prot Wet-lab
Dry-lab
Figure 2.3: Phases of protein sequence annotation in the UniProt.
Lately numerous methods have been proposed for automated protein sequence annotation. These methods can essentially be divided into four main categories as follows:
(i) Sequence-similarity-based method depends on the determination of a local or global similarity between the not-yet annotated protein sequence and protein sequences with known annotation. This method uses sequence similarity search algorithms such as Smith-Waterman and Needleman-Wunsch algorithms. Examples of works have been carried out by Snyder et al. [14] and Koski et al. [15].
(ii) Controlled-vocabulary-based method employs the most widely used biological ontology, the GO along with its annotation databases to annotate protein sequence such as studies done by Jones et al. [16] and Prlic et al. [17].
literature as evidence to annotate protein sequence. Some recent studies have been conducted by Yuan et al. [18] and Chiang and Yu [19].
(iv) Rule-based method annotates protein sequence based on condition and existence of certain rules. The rules are created according to information extracted from the secondary databases. This method has been applied by Sigrist et al. [20] and Yu [21].
2.3 The Gene Ontology
The GO project started in 1998 by collaboration between three model organism databases: FlyBase (http://flybase.bio.indiana.edu/), Saccharomyces Genome Database (SGD; http://www.yeastgenome.org/), and Mouse Genome Informatics (MGI; http://www.informatics.jax.org/). Currently, databases participated in the GO project covers model organisms like Arabidopsis thaliana, Caenorhabditis elegans, Danio rerio, Dictyostelium discoideum, Oryza, Rattus norvegicus, and several protozoan parasites including Leishmania major, Plasmodium falciparum, and Trypanosoma brucei. The GO project is developed and maintained by the GO Consortium. The GO Consortium is currently formed by 16 entities such as EBI, University of Cambridge, University of California Berkeley, The Jackson Laboratory, Stanford University, and Princeton University. The GO is one of the ontologies that take part in the Open Biomedical Ontologies (OBO; http://obo.sourceforge.net/). The OBO is an umbrella project providing well-structured controlled vocabularies that are freely available and can be used across different biological and medical domains.
concepts existing in various species, to support species comparison and cross-databases search, and to assist annotation of vast amounts of biological data held in genome and protein databases. The main concept used in the development of the GO is ontology. The ontology is an explicit description of a domain. The ontology is created to define common vocabulary and to share common understanding of the meaning of any vocabulary used. The ontology has been developed in many fields such as chemical process engineering [22], ecoinformatics [23], and multimedia [24]. The ontology has also been implemented to solve various problems related to semantic web search [25], verification of conceptual models [26], and database integration [27].
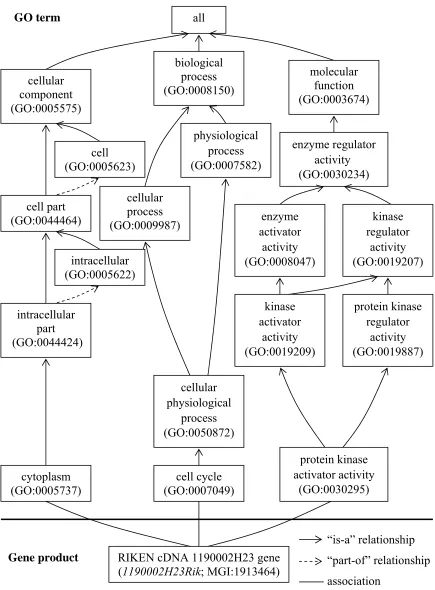
GO term Gene product biological process (GO:0008150) cellular component (GO:0005575) molecular function (GO:0003674) all cell (GO:0005623) cell part (GO:0044464) intracellular (GO:0005622) intracellular part (GO:0044424) cytoplasm (GO:0005737) cellular process (GO:0009987) cellular physiological process (GO:0050872) physiological process (GO:0007582) cell cycle (GO:0007049) enzyme regulator activity (GO:0030234) enzyme activator activity (GO:0008047) kinase regulator activity (GO:0019207) kinase activator activity (GO:0019209) protein kinase regulator activity (GO:0019887) protein kinase activator activity (GO:0030295)
RIKEN cDNA 1190002H23 gene (1190002H23Rik; MGI:1913464)
“is-a” relationship “part-of” relationship association
Figure 2.5: The properties of the GO term. For example, the “mechanosensory behavior” (GO:0007638) and part of its gene product association.
(1) Name : mechanosensory behavior
(2) Accession number : GO:0007638 (3) Ontology category : biological process
(4) Synonyms : exact: behavioral response to mechanical stimulus
exact: behavioural response to mechanical stimulus
exact: mechanosensory behaviour
(5) Definition : Behavior that is dependent upon the sensation of a
mechanical stimulus. [source: GOC:go_curators]
(6) Comment : None
(7) Term lineage :
all : all
(is-a) GO:0008150 : biological_process (is-a) GO:0050896 : response to stimulus
(is-a) GO:0007610 : behavior
(is-a) GO:0007638 : mechanosensory behavior (is-a) GO:0009628 : response to abiotic stimulus
(is-a) GO:0009612 : response to mechanical stimulus (is-a) GO:0007638 : mechanosensory behavior (is-a) GO:0009605 : response to external stimulus
(is-a) GO:0009612 : response to mechanical stimulus (is-a) GO:0007638 : mechanosensory behavior
(8) Database (external) references :
SP_KW
KW-0213 Dejerine-Sottas syndrome
(9) Gene product associations :
No. Name/Symbol Information Evidence Reference Assigned by
1 bas gene from Drosophila IMP PMID:7932299 FlyBase
bang-sensitive melanogaster
2 bss gene from Drosophila IMP PMID:7932299 FlyBase
bang senseless melanogaster
3 E(sda)A gene from Drosophila IMP PMID:12454073 FlyBase melanogaster
4 E(sda)D gene from Drosophila IMP PMID:12454073 FlyBase melanogaster
5 E(sda)F gene from Drosophila IMP PMID:12454073 FlyBase melanogaster
6 E(sda)J gene from Drosophila IMP PMID:12454073 FlyBase melanogaster
7 E(sda)O gene from Drosophila IMP PMID:12454073 FlyBase melanogaster
8 e(sei) gene from Drosophila IMP PMID:2440763 FlyBase
enhancer of melanogaster seizure
9 eas gene from Drosophila IMP PMID:7932299 FlyBase
easily shocked melanogaster
10 Etv1 gene from Mus IMP PMID:10850491 MGI
ets variant musculus
gene 1
11 Etv1_predicted gene from Rattus ISS RGD:1580654 RGD
est variant norvegicus
gene 1
(predicted)
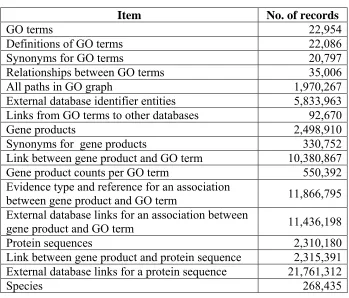
The size of the GO data (as of January 2007) is shown in Table 2.1. The GO data is stored in the following database categories:
(i) termdb is a database that contains information on the GO terms and relationships only.
(ii) assocdb is a database which subsumes data in the termdb and addition with associations between the GO terms and gene products.
(iii) seqdb is a database containing protein sequences that associate with gene products and all data in the assocdb.
(iv) seqdblite is a database which is same as seqdb, except all Inferred from Electronic Annotation (IEA) evidence associations have been taken out.
The GO data is in OBO, OWL, RDF/XML, and MySQL formats. The OBO and OWL formats are available just on the termdb. The MySQL format can be downloaded on all database categories. Meanwhile, the RDF/XML format comes without protein sequences and IEA evidence associations.
Table 2.1: Size of the GO data.
Item No. of records
GO terms 22,954
Definitions of GO terms 22,086
Synonyms for GO terms 20,797
Relationships between GO terms 35,006
All paths in GO graph 1,970,267
External database identifier entities 5,833,963 Links from GO terms to other databases 92,670
Gene products 2,498,910
Synonyms for gene products 330,752
Link between gene product and GO term 10,380,867 Gene product counts per GO term 550,392 Evidence type and reference for an association
between gene product and GO term 11,866,795 External database links for an association between
gene product and GO term 11,436,198
Protein sequences 2,310,180
Link between gene product and protein sequence 2,315,391 External database links for a protein sequence 21,761,312
The GO has been used in many applications including gene expression studies [29], proteomics studies [30], comparative genomics [31], and data and text mining [32]. This is due to characteristics of the GO that the data is continuously evolved and refined, the structure is simple and relatively easy to understand and use, direct input from the biological community, and active curation to sustain the quality and integrity of data. Detail discussion about GO can be found in [33]–[39].
2.4 Automatic Clustering Algorithms
Automatic clustering is a process of dividing a set of elements into unknown clusters, where the best number k of clusters is determined by the clustering algorithm. That is, elements within each cluster should be highly similar to each other than to elements in any other cluster. Finding the k automatically is a hard algorithmic problem. The automatic clustering problem can be defined as follows:
“Let X = {X1, X2, …, Xn} be a set of n element. These elements are clustered into non-overlapping clusters C = {C1, C2, …, Ck}, where C is called a cluster, k is the unknown number of clusters, Ci∩ Cj = Ø for i ≠ j, C1 ∪ C2 ∪ … ∪ Ck = X, Ci⊆ X, and Ci ≠ Ø.”
decrease the number k of clusters while the algorithm continues. Among these techniques are:
(i) X-means [48]; in this the splitting decision is performed by computing the Bayesian Information Criterion (BIC) until the upper bound of k is attained.
(ii) G-means [49]; it starts with small number of k-means centers and raises the number of centers using Gaussian distribution.
(iii) CLUSTERING [50]; it is an automatic clustering based on heuristic strategy that uses the nearest neighbor to group those data that are situated close to one and another. Then, genetic algorithm is used to group the smaller clusters into larger ones.
(iv) S+G [51]; it is also a two stage method, which in the beginning uses a self-organizing feature map to determine the number k of clusters and then employs a genetic algorithm based clustering to find the final solution.
In the GO context, the GO terms are structured as DAG. Let GO graph G = {V, E}, where V is a set of nodes that represent the GO terms and E is a set of directed edges that represent relationships between the GO terms. Partitioning the GO graph in order to cluster the GO terms can be considered as a Graph Partitioning Problem (GPP). The aim of GPP is to cut a vertex set V into k disjoint and non-empty subsets such that the number of edges connecting nodes in different subsets is minimized and the number of edges connecting the nodes in the same subsets is maximized. GPP is a fundamental combinatorial optimization problem that has numerous practical applications in many areas including design of Very Large Scale of Integration (VLSI) circuits [52], mesh partitioning in parallel processing [53], image segmentation in computer vision [54], and gene expression analysis in bioinformatics [55]. An extensive study of Kerninghan-Lin algorithm, simulated annealing, tabu search, watermarking, and normalized cut have been carried out by [56]–[59], [54] respectively to solve the GPP. Review of the GPP techniques can be found in [60], [61]. Several studies using genetic algorithm for the GPP have also been done by:
chromosome. The different classes of graphs: random graph, random geometric graph, random regular graph, and caterpillar graph consisting of 134 to 5,252 nodes, were tested with the algorithm.
(ii) Kaveh and Bondarabady [63] implemented genetic algorithm for finite element decomposition of 1,640 to 6,720 elements. Sequences of coarsening and uncoarsening process are performed to transform the large scale graph G0 into a smaller size graph Gn and vice versa such that a suitable size of graph can be partitioned by genetic algorithm.
(iii) Kohmoto et al. [64] has incorporated simulated annealing into genetic algorithm to generate feasible solutions. The algorithm is then applied to undirected graph with 124 to 250 nodes.
For the ontology clustering, very little effort has been done in this area. Stuckenschmidt and Klein [65] have proposed a method for automatic clustering of large ontologies based on the structure of the class hierarchy. The method consists of three steps:
(i) In the first step, a dependency graph is created from ontology source file using PROLOG-based tool that reads OWL and RDF schema files. It then displays the dependency graph using networks analysis tool Pajek.
(ii) In the second step, the strength of the dependencies between the concepts in the dependency graph is determined by computing the propositional strength network.
2.5 Semantic Similarity Searching Algorithms
Ontology is a description of concepts in a domain and the relationships between the concepts. Ontology can be represented as a directed graph. The ontology graph comprises the concepts including the descriptions as nodes and semantic relationships as edges. Recently, there has been growing development of ontology in the bioinformatics field such as Sequence Ontology [66], Cell Ontology [67], Chemical Ontology [68], Multiple Alignment Ontology [69], Biodynamic Ontology [70], and Protein-Interactions Ontology [71]. However, the “ontology searching”, which refers to the activity of retrieving concepts in the ontology graph, is not accurately performed by the traditional search engines that are based on keywords. These search engines neglect the semantic relationships between the search concepts and only consider those concepts as character strings. Thence, a mechanism to measure the similarity between concepts in the ontology graph is required to reduce dependency of specialists of a certain domain to input relevant concepts as search words.
There are numerous search techniques that are frequently and extensively used in computer science, engineering, mathematics, and other fields such as:
(i) Tabu search is a local search technique. It uses a local or neighborhood search procedure to repetitively move from a solution x to a solution x' in the neighborhood of x, until termination criterion is satisfied. Examples of application include flow shop problem [72] and facility location problem [73].
(ii) Simulated annealing is a global optimization technique that is based on probabilistic methods. It traverses the search space by producing neighboring solutions of the current solution. The simulated annealing has been applied in flexible manufacturing system [74] and heterogeneous distributed system [75].
algorithms have solved various problems such as nurse rerostering problem [76] and personnel assignment problem [77].
(iv) Ant colony optimization is a population-based technique that tries numerous solution options at each step of the algorithm. The ant colony optimization is inspired by the behavior of ants in discovering routes from the colony to food. It has been applied in water distribution system [78] and solved the nonlinear resource allocation problem [79].
Other techniques include particle swarm optimization [80], hill climbing [81], and cross-entropy method [82]. A detailed comparison among these techniques can be found in [83]–[85].
In the case of semantic similarity search, researchers have used different measures to identify similarity between two concepts being compared. Lately, several new semantic similarity measures have been introduced such as:
(i) Edge-similarity measure [86] is applied to varying image illumination and contrast.
(ii) Quantitative tract similarity measure [87] is based on the shape and length of the two tracts being analyzed to improve image segmentation reproducibility.
(iii) Trainable similarity measure [88] applied the matching-pursuit approach for road-sign classification.
(iv) Clip-based similarity measure [89] is based on two bipartite graph matching algorithms (maximum matching and optimal matching) for video retrieval and video summarization.
(v) Spectral similarity measures [90] consist of four spectral measures (spectral angel measure, Euclidean distance measure, spectral correlation measure, and spectral information divergence) for the analysis of hyperspectral imagery.
medical images and Núñez et al. [95] on improving case-based reasoning for environmental decision support systems.
On the other hand, for the GO, semantic similarity search is required in order to search for semantically similar GO terms and to reduce dependency on the specialists. Thence, it avoids the users from investing lots of time browsing the GO terms. However, this approach involves computing the amount of information the GO terms share in common and/or calculating the depth and the local network density of the GO term. This scenario becomes complicated since the GO terms are structured as a DAG and searching the GO graph is an NP-complete problem. By contrast, the existing GO browsers to support basic needs for scientists to search the GO terms are still using conventional approach which is based on keyword matching. Thus, for a scientist to find a group of GO terms that have semantically similar properties is time consuming and a hard task. A list of tools for searching and browsing the GO terms can be found at http://www.geneontology.org/GO.tools. browsers.shtml. All these tools are free to academics, among them are:
(i) CGAP GO Browser is developed by The Cancer Genome Anatomy Project. It allows the user to browse the GO terms using the hierarchy view and find the known human and mouse genes assigned to each term. This tool can be used at http://cgap.nci.nih.gov/Genes/ GOBrowser/.
(ii) GOFish is created using Java applet by the Roth Laboratory at the Harvard University. It uses term name or accession number as an input and then performs keyword matching. This tool allows the user to construct arbitrary Boolean queries using GO terms, and ranks gene products that satisfy the queries. The GOFish can be found at http://llama.med.harvard.edu/software.html.
Other browsers are AmiGO (http://godatabase.org/), EP GO Browser (http://ep.ebi.ac.uk/EP/GO/), QuickGO Browser (http://www.ebi.ac.uk/ego/), GenNav Browser (http://mor.nlm.nih.gov/perl/gennav.pl), and MGI GO Browser (http://www.informatics.jax.org/searches/GO_form.shtml).
2.6 Protein Sequence Annotation Tools
Bioinformatics is the application of computer technology to store, retrieve, analyze, simulate, or predict the composition or the structure of biomolecules. It involves the development of algorithms and statistical techniques, databases, and tools. The bioinformatics tools should be developed using open source and web technologies. Therefore, these tools can be distributed freely and used extensively by the bioscientists. However, an excellent tool should be easy to be setup and used, can be run on low-cost hardware, and requires a short execution time.
Recently, a number of bioinformatics tools have been developed for protein sequence annotation based on the GO. These tools are:
(i) Blast2GO employs BLAST to find homologous sequences to Fast Alignment (FASTA) formatted input protein sequences. The Blast2GO extracts the GO terms for each found hit by mapping to existing annotation associations. An annotation rule finally assigns GO terms to the query protein sequence. This tool can be accessed at http://bioinfo.ivia.es/blast2go/. It is maintained by the Centro de Genómica at the Instituto Valenciano de Investigaciones Agrarias. (ii) GoAnna can be applied for protein sequence annotation using a
http://agbase.msstate.edu/GOAnna.html.
(iii) HT-GO-FAT provides the bioscientists with a high-throughput mapping of unknown protein sequence to GO annotation. It uses BLAST for sequence similarity search. The HT-GO-FAT can be downloaded from http://liru.ars.usda.gov/mainbioinformatics.html. This tool is developed by the Livestock Issues Research Unit at the United States Department of Agriculture (USDA) Agricultural Research Service.
(iv) InGOt is capable to assign up-to-date GO terms to a given protein sequence. The InGOt claims to have more sequences than any public resource and assignments harvested from the broadest possible GO-linked resources. It is proprietary software by Inpharmatica Ltd. A free two week trial of this tool can be downloaded at http://www.inpharmatica.co.uk/ingot/.
Other GO-based protein sequence annotation tools are: GOPET is addressable via http://genius.embnet.dkfz-heidelberg.de/menu/biounit/open-husar/, and it has been developed by the German Cancer Research Center; GOtcha (http://www.compbio. dundee.ac.uk/gotcha/gotcha.php) by the Barton Group at the University of Dundee; GoFigure (http://udgenome.ags.udel.edu/gofigure/) is under the UDGenome project by the University of Delaware; GOblet (http://goblet.molgen.mpg.de/) is introduced by the Max Planck Institute for Molecular Genetics; and lastly JAFA (http://jafa.burnham.org/) is maintained by the Burnham Institute for Medical Research.
In parallel, several works using computational intelligence techniques for protein sequence annotation have also been done by:
(i) Kirac et al. [96] introduced a data mining technique that calculates the probabilistic relationships between the GO annotations of proteins on protein-protein interaction data. Then, it assigns highly associated GO terms of annotated proteins to the target protein sequence.
(iii) Ponomarenko et al. [98] shows how protein sequence annotation can be improved and corrected if protein structures are available. They used the combinatorial extension algorithm to compare the structure. Then, it widens the protein annotation provided by the GOA to further annotate the protein sequences in the Protein Data Bank (PDB; http://www.rcsb.org/pdb/).
There are also varieties of protein sequence annotation tools that have been developed without depending on the GO data such as FeatureMap3D (http://www.cbs.dtu.dk/services/FeatureMap3D/), KOBAS (http://kobas.cbi.pku.edu. cn/), MineBlast (http://leger2.gbf.de/cgi-bin/MineBlast.pl), ProtoBee (http://www. protobee.cs.huji.ac.il/), and ProFAT (http://cluster-1.mpi-cbg.de/profat/).
2.7 Trends and Tendencies
In the case of splitting the monolithic GO RDF/XML file, the process can be regarded as GPP. Several works done by [62]–[64] have shown that the GPP can be efficiently solved by genetic algorithm. Furthermore, algorithms such as CLUSTERING [50] and S+G [51] have shown that genetic algorithm can be combined with other algorithms to find the number k of clusters automatically. However, applications of genetic algorithm to split the monolithic GO RDF/XML file is not easy since very little work has been done in ontology clustering as references. Another focus of this study is to perform semantic similarity searching on the GO terms. Currently, most of the GO browsers such as AmiGO and GOFish are based on keyword matching. On the other hand, existing searching algorithms such as genetic algorithm are not capable of executing the task alone. Therefore, a suitable semantic similarity measure for ontology searching is required to combine with the genetic algorithm. However, most of the existing semantic similarity measures [86]– [95] are specifically designed for image segmentation and image matching. Lastly, although most of the protein sequence annotation tools such as GoAnna and HT-GO-FAT are publicly available via the internet, yet they depend on BLAST to perform sequence similarity that requires high computing power and high implementation cost especially for offline usage. Therefore, a simple and practical tool that is easy to be configured with low computing cost needs to be developed.
2.8 Summary
CHAPTER 3
RESEARCH METHODOLOGY
3.1 Introduction
The data sets used as well as the instrumentation and analysis of the results of the algorithms and tools are also discussed in Sections 3.3 and 3.4 respectively.
3.2 Framework of the Study
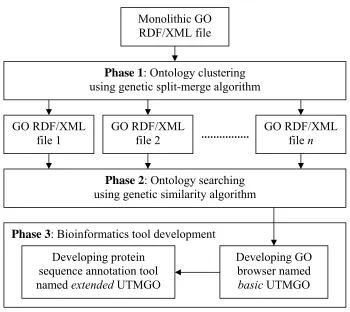
The framework of the study involved three main phases namely the ontology clustering phase, the ontology searching phase, and the bioinformatics tool development phase as depicted in Figure 3.1.
Monolithic GO RDF/XML file
Phase 1: Ontology clustering using genetic split-merge algorithm
Phase 2: Ontology searching using genetic similarity algorithm GO RDF/XML
file 1
GO RDF/XML file 2
GO RDF/XML file n
Phase 3: Bioinformatics tool development
Developing GO browser named basic UTMGO Developing protein
sequence annotation tool named extended UTMGO
Figure 3.1: The framework of the study.
number of smaller files. The genetic split-merge algorithm is a combination of parallel genetic algorithm and split-and-merge algorithm. The detail about genetic split-merge algorithm is discussed in Chapter 4. The genetic split-merge algorithm can be summarized as follows:
(i) Initialization of a population of chromosomes where alleles for each chromosome show the cluster number and loci represent the GO terms accession number.
(ii) Evaluate the fitness of each chromosome.
(iii) Select chromosomes for reproduction using the roulette wheel selection scheme.
(iv) Apply partial match crossover and swap mutation operators.
(v) Replace the least fit chromosomes in the existing population by the newly generated offspring.
(vi) Repeat steps (ii)–(v) until the stopping criteria are met.
The inputs for the genetic split-merge algorithm are the GO graph and the minimum number k of clusters specified by the user. This algorithm returns the best chromosome representing a k number of good clusters. The genetic split-merge algorithm is capable of automatically identifying the number k of clusters, producing balanced clusters in terms of number of elements in each cluster, requires reasonable amount of processing time, and generates good clusters.
In the ontology searching phase, the genetic similarity algorithm is developed to perform semantic similarity search. The idea is to find a group of semantically similar GO terms for a given query GO term. The genetic similarity algorithm incorporates semantic similarity measure algorithm in the parallel genetic algorithm. A comprehensive discussion of the genetic similarity algorithm is done in Chapter 5. The genetic similarity algorithm can be summarized as the following steps:
(i) Perform preprocessing using the semantic similarity measure algorithm.
(ii) Initialization of a population of chromosomes where alleles for each chromosome show either the GO terms are retrieved or not retrieved and loci represent the GO terms accession number.
(iii) Evaluate the fitness of each chromosome.
selection scheme.
(v) Apply two-point crossover and swap mutation operators.
(vi) Replace the least fit chromosomes in the existing population by the newly generated offspring.
(vii) Repeat steps (iii)–(vi) until the stopping criteria are met.
The inputs for the genetic similarity algorithm are the GO graph and the query GO term. This algorithm returns the best chromosome representing a group of GO terms that are semantically similar to the query GO term. The genetic similarity algorithm is susceptible of returning the GO terms whose names do not have keywords similar to the name of the query GO term has. Furthermore, it is able to avoid producing many GO terms with low term similarity score and can be executed in a short time.
In the bioinformatics tool development phase, the basic UTMGO is developed using web technology. The main goal of this tool is to act as a new way to search the GO terms. The basic UTMGO has shown its capability to determine the semantically similar GO terms as compared to other keyword-based GO browsers. This is due to the effectiveness of the genetic split-merge algorithm and the genetic similarity algorithm. The potential of this tool has been broadened to annotate protein sequences. The tool named extended UTMGO is able to return a set of GO terms together with their associated protein sequences that have higher sequence alignment score to the query protein sequence. This feature allows bioscientists to annotate protein sequences by only using the GO terms and its properties. Thus, it prevents dependency on BLAST, RDBMS, various sources of data, and cost and high-specification hardware unlike other protein sequence annotation tools. The basic and extended UTMGO are described in Chapter 5 and 6 respectively.
3.3 Data Sources
file named go_YYYYMM-assocdb.rdf-xml.gz. In Chapter 4, all GO data in the RDF/XML format is used to test the genetic split-merge algorithm. However, to include protein sequences and IEA evidence associations into the smaller GO RDF/XML files, these data are taken from the MySQL format. The GO data in the MySQL format is stored in a file named go_YYYYMM-seqdb-tables.tar.gz. In Chapter 5, the basic UTMGO and the genetic similarity algorithm use 250 GO terms as the query GO terms. These terms are selected randomly which comprise 8% from cellular components, 56% from biological processes, and 36% from molecular functions. In the meantime, to assess the performance of the extended UTMGO for annotating protein sequences, 50 protein sequences are selected randomly as the query protein sequence from each species as follows:
(i) Oryza sativa ssp japonica from the Gramene database (http://www.gramene.org/Oryza_sativa/index.html).
(ii) Homo sapiens is obtained from the Ensembl database (http://www.ensembl.org/Homo_sapiens/index.html).
(iii) Saccharomyces cerevisiae from the SGD database.
(iv) Arabidopsis thaliana is downloaded from the TAIR database (The Arabidopsis Information Resource; http://www.arabidopsis.org/).
3.4 Instrumentation and Results Analysis
In Chapter 4, four comparisons are presented to evaluate the performance of the genetic split-merge algorithm. The comparison includes results analysis of different number of processors of the low-cost PC cluster used to run the genetic split-merge algorithm, different fitness functions of the genetic split-merge algorithm, and comparison between genetic split-merge algorithm and other clustering and automatic clustering algorithms. In Chapter 5, the results of the genetic similarity algorithm are analyzed with different semantic similarity measure and different combinations of parameters α and β for depth and local network density factors respectively. Whereas, different semantic similarity and keyword-based GO browsers are used to analyze the results of the basic UTMGO. The results analysis of different number of processors of the low-cost PC cluster used to run the basic UTMGO and the genetic similarity algorithm as its intelligent engine are also presented in Chapter 5. Lastly, in Chapter 6, the results of the extended UTMGO have been analyzed with other GO-based protein sequence annotation tools. The expert and the system that are related to Equation 5.15 and 5.16, discussed in Section 5.6 and 6.4, refer to a biologist who has knowledge of the GO and protein sequence annotations and the basic and the extended UTMGO, respectively. The results in this study have been validated by the GO Consortium. Some publications of the study have also been included in the GO bibliography (http://www.geneontology.org/cgi-bin/biblio.cgi).
3.5 Summary
CHAPTER 4
THE GENETIC SPLIT-MERGE ALGORITHM
FOR SPLITTING THE MONOLITHIC GENE ONTOLOGY RDF/XML FILE
4.1 Introduction
Due to large amount of the GO data as shown in Table 2.1, protein sequences and IEA evidence associations are not included in the GO RDF/XML file by the GO Consortium. But still the astronomical size and massive nature of this single flat file (current size is 472 MB) has caused the GO RDF/XML difficult to be maintained, published, validated, and processed. An alternative way to make the GO RDF/XML more complete, coherent, and easy to browse is to split it into multiple files. Thus, it enables protein sequences and IEA evidence associations to be included in the smaller GO RDF/XML files.
Splitting the GO RDF/XML file requires the GO terms to be grouped into a number k of clusters. Since the GO terms are structured as DAG, let GO graph be G = {V, E} that consists of two main elements: V is a set of nodes that represent the GO terms and E is a set of edges that represent relationships between the GO terms. Partitioning the GO graph is a combinatorial problem and can be regarded as a GPP. The intention of GPP is to divide a vertex set V into k disjoint and non-empty subsets in order to produce partitions that have higher degree of interaction between nodes in the same partition and have lower degree of interaction between nodes in different partitions. The task of partitioning the large GO graph that contains more than 22 thousand nodes and almost 2.0 million paths is characterized as bearing very high computational complexity. Moreover, identifying the number k of clusters is a hard algorithmic problem since it is difficult to guess, and it requires a trial-and-error work.
4.2 Related Work
A large number of clustering algorithms have been proposed in the past decade. Among the successfully implemented clustering algorithms are fuzzy logic, e.g. fuzzy clustering by local approximation of membership [107] and fuzzy c-means [108] for clustering DNA microarray data; support vector machines, e.g. clustering support vector machines [109] for protein local structure prediction and support vector clustering [110] for marketing segmentation; k-means, e.g. k-means range algorithm [111] for personalized data clustering in e-commerce and greedy k-means algorithm [112] for global gene trajectory clustering; and evolutionary algorithms, e.g. hybrid-evolutionary-programming algorithms [113] for microbial growth studies and genetic clustering [114] for clustering gene expression data. Other clustering algorithms include hierarchical clustering [115], Bayesian clustering [116], profile hidden Markov model [117], and self-organizing map [118]. There are also hybrid clustering algorithms such as rough fuzzy c-means [119], rough k-means [120], and evolutionary fuzzy c-means [121]. Comparison of clustering algorithms can be found in [122]–[125].
In another part, GPP has been studied by several researchers for different sizes of graph. Aykanat et al. [129] has formulated adaptive object space decomposition problem as a GPP. A tool named RM-MeTiS is developed to partition the graph. This tool consists of three phases: multilevel coarsening, initial remapping, and multilevel refinement. The largest graph consists of 109,744 nodes and the experiments are conducted on a 28-node PC cluster. Duarte et al. [130] has modeled image segmentation as a GPP. The GPP is resolved by a variant of normalized cut using hierarchical social metaheuristic. The experiments involve the largest graph with 11,155 nodes and 1,817,351 edges. Mitchell and Mancoridis [131] has invented Bunch as a tool for modularization of software systems. This tool uses search techniques and treats the clustering process as a GPP. It has been tested to the largest graph with almost 10,000 nodes and 100,000 edges.
In genetic algorithm based clustering, a population with ps number of chromosomes is randomly generated with every chromosome representing a solution. The goodness of each chromosome is evaluated by a fitness function. Salim and Mohemad [132] has introduced mean inter-cluster molecular dissimilarity measure to calculate the fitness function as follows:
1 1
SM( ) 1 2
n n ij i j
T
f x
n
= =
= −
∑∑
, (4.1)where represents the Tanimoto coefficient between cluster centroids and n is the number of centroids. In the meantime, Garai and Chaudhuri [133] defines the fitness function of a chromosome as follows:
ij
T
GC inter intra
1 1
( ) ( ) ( )
k k
i i
i i
f x D C D C
= =
=
∑
−∑
× B , (4.2)where Dintra( )Ci represents intra-distance in cluster Ci, represents inter-distance of cluster C
inter( )i
D C
4.3 The Genetic Split-Merge Algorithm
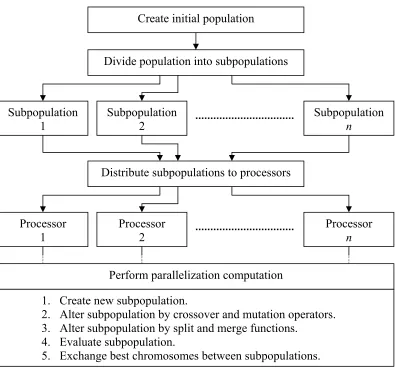
A genetic split-merge algorithm that combines parallel genetic algorithm with split-and-merge algorithm is proposed to cluster the GO terms. The aim is to split the monolithic GO RDF/XML file into a number of smaller files. The parallel genetic algorithm is used because of its capability of being adaptive, efficient, robust, and a global search method that is suitable to address a situation where the search space is large. Moreover, parallel genetic algorithm optimizes its fitness function by utilizing the genetic operators to find an optimal solution. It can also be executed on a low-cost PC cluster using message passing interface libraries that are open source and easy to install. The split-and-merge algorithm is implemented to improve infeasible clusters in order to efficiently estimate the number k of clusters. Generally, the genetic split-merge algorithm works by decomposing the GO terms into a number of clusters and then automatically combines these clusters in several iterations until the best number k of clusters is found. The genetic split-merge algorithm uses cohesion-and-coupling metric to measure the goodness of the generated clusters. The genetic split-merge algorithm is expected to be capable of automatically identifying the number k of clusters, producing balanced clusters in terms of number of elements in each cluster, requires reasonable amount of processing time, and generates good clusters. The overview of the genetic split-merge algorithm is shown in Figure 4.1.
4.3.1 Chromosome Representation
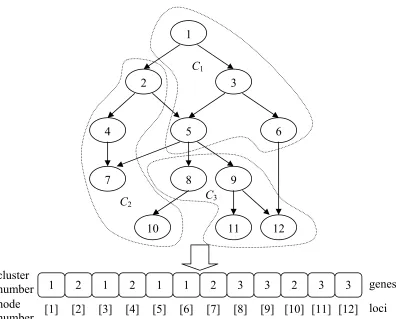
interpreted. An example of chromosome representation of GO graph with 12 nodes and 3 clusters is shown in Figure 4.2.
1 2 3 4 5 6 7 8 9 10 11 12 13 14 15 16 17 18 19
Genetic-Split-Merge-Algorithm (G, kmin);
Input: G = {V, E} (a Gene Ontology graph) and kmin (a minimum number k of clusters)
Output: C = (C1, C2, …, Ck) (a clustering) begin
t := 0;
initialize Pop t( ); // note that ( ) { , ,1t t } where and
ps
Pop t = x … x Pop t( )
t
x are the population and chromosome for generation t respectively and ps is the size of population
evaluate Pop t( );
while not termination-condition do t := t + 1;
select Pop t( ) from Pop t( 1− );
alter Pop t( ) by crossover and mutation operators; alter Pop t( ) by split and merge functions;
evaluate Pop t( ); end-while
end
Figure 4.1: The genetic split-merge algorithm.
4.3.2 Crossover and Mutation Operators
split-merge algorithm is to generate new population with higher total fitness in each generation.
12 1
2 3
4 5 6
7 8 9
10 11
C1
C2 C3
1 2 1 2 1 1 2
node number cluster number
[1] [2] [3] [4] [5] [6] [7] [8] [9] [10] [11] [12] loci 3
3 2 3
3 genes
Figure 4.2: An example of chromosome representation.
4.3.3 Split and Merge Functions
functions, chromosomes with best number k of clusters and high fitness are recreated in each generation. Hence, it indirectly eliminates the process of producing solution with unsuitable number k of clusters and accelerates the pace for convergence.
The main objective of the split function S(x) is to decompose each cluster in chromosome x into reasonable fragmented clusters. This function works by creating clone chromosomes 1
c
x … c
n
x from the chromosome x ∈ . For each cluster C
( ) Pop t
1…Cp in the clone chromosome xc, the cluster Cp is divided into two clusters and . The chromosome x is replaced by the best clone chromosome x
1
p
C
2
p
C c that
satisfies the following criteria:
(i) The Quality of Clustering (QOC) of the clusters and in the clone chromosome x
1 p C 2 p C
c is higher than the QOC of the cluster C
p in the chromosome x.
(ii) The dependency index γ (refer to Equation 4.7) of the clusters and in the clone chromosome x
1
p
C
2
p
C c must be greater than the dependency index threshold for small cluster Imin.
The QOC of the clusters Cp1 and Cp2 in the clone chromosome x c is computed as follows:
2 2 1 1 1 2 , , , 1 . ( , )
2 2 3
p p k
i i
i p i p j c
p p
x QOC C C
k j α β = = = = − −
∑
∑
, (4.3)
where αi is the cohesion of the cluster i (refer to Equation 4.9) and βi,j is the coupling between clusters i and j (refer to Equation 4.10). The QOC of the cluster Cp in the chromosome x is calculated with the following equation:
, , , 1 . ( ) 1 p k i j i p j
p p
x QOC C
k β α = = = − −
∑
. (4.4)feasible and near optimal solution. The merge function M(x) is invoked to combine clusters Cp and Cq in the chromosome x ∈ . If the trial consolidation fulfills the following conditions, then the clusters C
( ) Pop t
p and Cq are permanently merged:
(i) The QOC of the merged clusters Cp and Cq is higher than the QOC of the cluster Cp alone.
(ii) The dependency index γ of the merged clusters Cp and Cq must be less than the dependency index threshold for large cluster Imax.
The QOC of the cluster Cp in the chromosome x is computed by Equation 4.5 as shown below:
, , , 1 . ( ) 2 p k i j i p j
p p
x QOC C
k β α = = = − −
∑
. (4.5) The QOC of the merged clusters Cp and Cq in the chromosome x is calculated asfollows:
, ,
, ,
, 1 , 1
. ( , )
2 2 3
p k q k
i j i j
p q i p j i q j
p q
x QOC C C
k β β α +α = = + = = = − −
∑
∑
. (4.6)After undergoing the split and merge processes, any illegal chromosome is adjusted and then evaluated by the fitness function fO(x). The illegal chromosome contains one or more clusters which are empty. For example, given k = 4, the chromosome x = (4 1 1 4 1 4 4 4 1) is illegal because cluster number two and three are empty. In some cases the split and merge processes can cause clusters to further split or merge due to strong internal dependencies. This phenomenon creates unbalanced clusters and reflects the aim of creating modular GO RDF/XML files that are easy to be maintained, published, validated, and processed. Therefore, dependency index γ is introduced to stabilize the split-and-merge algorithm and to forbid it from producing micro or giant clusters during splitting or merging process. The dependency index γi of the cluster i is given by:
1 1 i i k j j N k N γ = − = −