r
An Experimental Study on the Utilization of High Performance Concrete for
Structure in Nuclear Power Plant
Sang-Kyun Woo ~), Young-Soo Yoon 2)
1) Korea Electric Power Research Institute, KOREA 2) Korea University, KOREA
ABSTRACT
This study is to develop high performance concrete for a dense reinforcement area, wall, and slab of 12in or less in Nuclear Power Plant. This study presents various experimental performances to enhance the durability of concrete structures in NPP by varying the ratio of W/B, fly ash substitution and super plasticizer addition. The effect of durability of concrete corresponding to the change of this variable was evaluated and the optimum W/B ratio and the optimum quantity of fly ash and super plasticizer for concrete structures in NPP were recommended. The results showed that W/B 35%, 20% of fly ash substitution and 2% of super plasticizer addition was found out to be an optimum quantity for a dense reinforcement area and W/B 45%, 20% of fly ash substitution and 3% of super plasticizer addition to be an optimum quantity for wall and slab structures in NPP.
INTRODUCTION
The concept, the study trend and the research direction of the high performance concrete have not been well established yet because it was first introduced in Korea only 6 --- 7 years ago. And there has been no example that the high performance concrete is applicable to a concrete structure for a power plant. A fundamental study is, therefore, required for examination of its application to the concrete structure work in conformity with the actual work condition in Korea, the structural performance and the safety thereof, beginning with the study on selection of materials and design of mix proportion which are basic elements of the high performance concrete. In Korea, type-5 cement (anti-sulfate cement) is generally used for a nuclear power plant (NPP). However, recently, as admixtures called as the 4th concrete component have been rapidly developed and put to practical use, it is reported that the concrete in which type- ! cement is mixed with the admixture is effective in constructing a nuclear power plant. In Japan, there is an example that the high performance concrete was applied to the concrete structure for a nuclear power plant. Such development of admixtures has improved the workability and the engineering properties of the concrete one more step. That is to say, admixtures play an important role in constructing concrete structures requiring stricter quality control in the respects of durability, strength and safety than general structures, including a nuclear power plant, a dam, a prestressed concrete structure, a high-speed electric railway and the like. Among them, particularly, the concrete structure for the nuclear power plant requires a high shielding performance and a high earthquake-proof, and therefore it has a general characteristic that the structural section gets to be necessarily large and in parallel therewith, reinforcing bars get to be increased. The required performances of the concrete for construction of the nuclear power plant include a reduction of heat of hydration to minimize the temperature stress, a secured proper unit weight for shielding and an improvement of workability in a dense reinforcement area in addition to the general required performances of the ordinary concrete such as proper workability, air volume and bleeding amount under the condition before hardening, proper compressive strength, drying shrinkage, durability index after hardening.
Thus, this study is to develop the high performance concrete that meets the requirements for improvement of workability in a structural area where it is difficult to compact in the concrete work for the nuclear power plant, reduction of heat of hydration in the mass concrete and the engineering properties thereof and put it to practical use by examining the material properties and mixing properties of the high performance concrete and further analyzing examples that the high performance concrete was actually applied to the concrete structure for the nuclear power plant.
MAIN SUBJECT
Since the high performance concrete has a high fluidity, a high filling capability, and a high segregation resistance so that its good quality can be kept without any compaction, it improves the workability in executing the concrete work at a construction site, and it is, therefore, known to have many advantages even economically.
Hence, this study is to provide a basic data on mixing to be applicable to the actual structure for the nuclear power plant by analyzing all properties of the high performance concrete and deriving an optimum mix proportion. Such analysis and derivation is to be accomplished by categorizing a concrete mix into a mix to be applicable to the external wall dome of the containment building and a mix to be applicable to a dense reinforcement area, a wall and slab of 12in (30.48cm) or less depending upon different workability (W/B) thereof, setting the substitution ratio of the fly ash at 0%, 10%, 20% and 30%, and controlling the respective added quantities of the super plasticizer and the fluidizing agent.
High Performance Concrete Development Experiment
The high performance concrete requires a high fluidity to the extent that no segregation takes place therein, but it can not meet a high filling capability by a high fluidity thereof alone. Therefore, various considerations have to be made in order to meet both a good fluidity and a high segregation resistance in parallel so that a filling capability may be good. These required performances of the high performance concrete are interdependent, which is noteworthy in the mixing design of the high performance concrete.
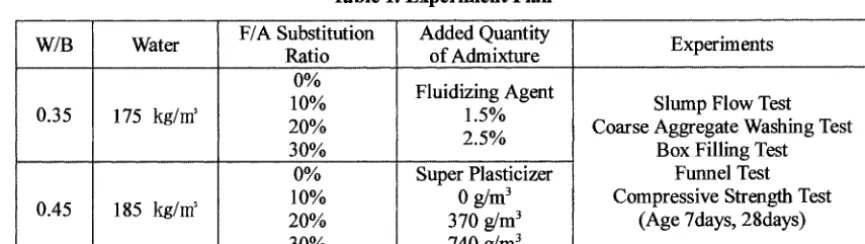
Table 1 shows the experiment plan for analyzing the interrelation of the performances of the high performance concrete and characteristics thereof. As a mix for this study, in case of the mix (W/B=0.35) to be applied to the external wall dome of the containment building, the substitution ratio of the fly ash is set at 0%, 10%, 20% and 30%, and two added quantities of the fluidizing agent are selected through a preliminary experiment, and thereby, an optimum substitution ratio of the fly ash and an optimum added quantity of the fluidizing agent is determined. And, in case of the mix (W/B=045) to be applied to a dense reinforcement area and a wall and slab of 12in or less, the substitution ratio of the fly ash is set at 0%, 10%, 20% and 30%, and three added quantities of the fluidizing agent are selected through a preliminary experiment, and an optimum substitution ratio of the fly ash and an optimum added quantity of the fluidizing agent is determined. The optimum mix proportion is derived on the basis of the above results.
Table 1. Experiment Plan
W/B
0.35
0.45
Water
175 kg/m ~
185 kg/m ~
F/A Substitution Ratio
...
0% 10% 20% 30%
oo
10% 20% 30%
Added Quantity of Admixture Fluidizing Agent
1.5%
2.5% Super Plasticizer
0 g/m 3 370 g/m 3 740 g/m 3
Experiments
, ,
Slump Flow Test Coarse Aggregate Washing Test
Box Filling Test Funnel Test Compressive Strength Test
(Age 7days, 28days)
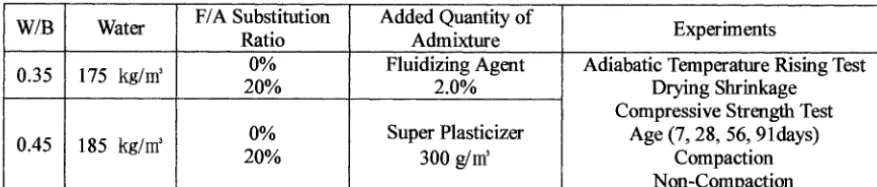
Comparative Examination of Durability and Time-dependent Deformation Characteristics
W/B
Table 2. Experiment Plan
0.35 175 kg/m ~
0.45
Water L . . .
20%
185 kg/m ~
F/A Substitution Ratio
0%
0%
20%
S p e c i m e n No. ...
Added Quantity of Admixture Fluidizing Agent
2.0% . . . .
Super Plasticizer 300 g/m ~
Experiments
Adiabatic Temperature Rising Test Drying Shrinkage
Compressive Strength Test Age (7, 28, 56, 91 days)
Compaction Non-Compaction EXPERIMENT RESULTS
High Performance Concrete Development Experiment Mix to be applied to dome
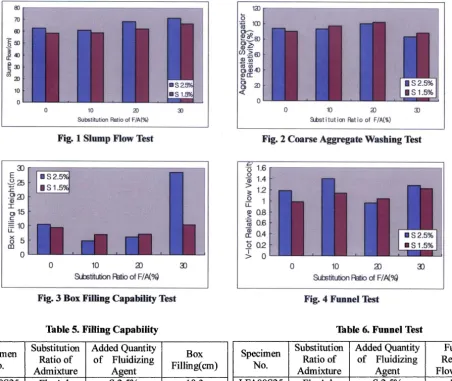
1) Slump Flow Test
Table 3 and Figure 1 show the fluidity test results of the high performance concrete.
LFA00S25 LFA00S 15 ... LFAlOS25 LFA 10S 15 LFA20S25 ... Li~A20S15 '
LFA30S25 LFA30S 15
Specimen No. LFA00s25
Substitution Ratio of Admixture , ,
Table 3. Slump Flow Test
Added Quantity of Slump Flow Fluidizing Agent 1 I i (~) J
S 2.5% 62.5
S 1.5% 58.2
S 2.5% 61.0 ,
Fly Ash 0% Fly Ash 10%
S 1.5% 59.0
S 2,5% 68.3
J S 1.5%
S 2.5%
s ~.5%
62.3
71.5 66.5 Fly Ash 20%
Fly Ash 30%
2) Coarse Aggregate Washing Test
Table 4 and Figure 2 show the segregation resistance test results of the high performance concrete.
Table 4. Coarse Aggregate Washing Test
Substitution Ratio of Admixture Fly Ash 0%
.... . LFA10S25
LFA 10S 15 LFA20S25 LFA20S15 ... LFA30S25
LFA30S 15 ...
Added Quantity of Fluidizing Agent
S 2.5% S 1,5%
20cm or less (%)
48
Fly Ash 10% Fly Ash 20%
S 2.5% . . .
S 1.5% S 2.5% S 1.5%
s 2.5%
39
45 47
38
47
LFA00S 15
38 58
over 20cm
(%)
47
36
43 37 48 48
36
Segregation ... Resistivity(%)
92 94 91
97
100 102 83 Fly Ash 30%
S 1,5%
41
883) Filling Capability Test
Table 5 and Figure 3 show the box filling capability test results of the high performance concrete. And Table 6 and Figure 4 show the funnel test results of the high performance concrete.
, >
8O 7O 6O
"!=o
20
0 10 20 30
Substitution Ratio of F/A(%)
Fig. 1 Slump Flow Test
" l o
100
i d).~_ 1oo.>_63
i m r r
<,, 0 10 29
Substitution Ratio of F/A(%)
Fig. 2 Coarse Aggregate Washing Test
E a3 ~i . . .
-~ 29
0
0 10 23 33
Substitution Ratio of F/A(%)
Fig. 3 Box Filling Capability Test
Table 5. Filling Capability
Substitution Specimen Ratio of
No.
Admixture LFA00S25 ' Fly Ash LFA00S15
LFA10S25 LFA 10S 15
LFA20s25
LFA20S 15 LFA30S25 LFA30S 15
0% Fly Ash
10% Fly Ash
20% Fly Ash
30%
Added Quantity of Fluidizing
Agent S 2.5% S 1'5% s 2,5%
s i.5%
S 2.5%
S 1.5%
S 2.5% s 1.5%
Box
Filling(cm)
10'3 913 4.8 6.9
611
7.2 28.5 10.3
/ ,
'~ 1.6 o '~ 1.4 >
~: 1.2 .__o 1
I I
m 0.8 .>_
_.~ o.6
rr 0.4 ~ O.2
i
> 0
0 10 23 33
Substitution Ratio of F/A(%)
Fig. 4 Funnel Test
Table 6. Funnel Test
Specimen No.
LFA00S25 LFA00S 15 LFA10S25 LFA10S15 LFA20S25 LFA20S15 LFA30S25 LFA30Si5
Substitution Ratio of Admixture
Fly Ash 0% Fly Ash
10% Fly Ash
20% Fly Ash
30%
Added Quantity of Fluidizing
Ag ent S 2.5% S 1.5% S 2.5%
Funnel Relative Flow Time
1.18 0.98
1.40
S 1.5% ... s 2 . 5 %
S 1.5%
... s 2.5%
, ,
S 1.5%
1.14 0 . 9 6
1.04 1.28 1.22 , ,
Table 7. Optimum Mix Design
win(%)
'35
S/A(%) 47
Unit Quantity(Kg/m 3) .. . .
. . ,
C [ F/A ] W G ] S [s.P(ml/m 3)
400 100 175 833 739 8333
Mix proportion to be applied to a dense reinforcement area, wall and slab of 12in or less
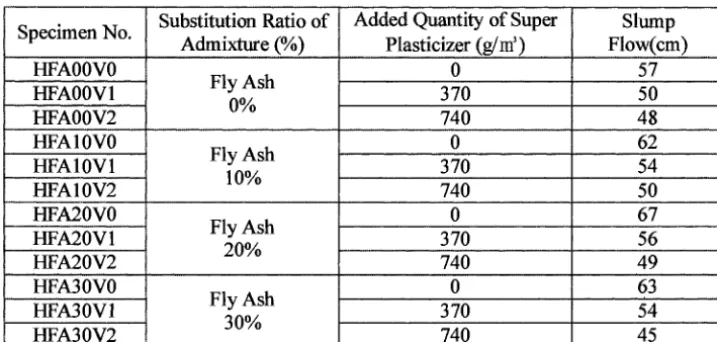
1) Slump Flow Test
Table 8 and Figure 5 show the fluidity test results of the high performance concrete.
2) Coarse Aggregate Washing Test
HFA00V1
,,
Substitution Ratio of Admixture (%)
Fly Ash 0% HFA00V2
HFA 10V0 HFA10V1 HFA10V2 .... r w n 2 0 v 0 .... HFA20V1
HFA20V2
. . . .
HFA30V0 HFA30VI HFA30V2
Table 8. Slump Flow Test
Added Quantity of Super Plasticizer (g/m s)
0
Fly Ash 10% Fly Ash
20% Fly Ash
30%
Slump
. . . .Flow(cm)
740 ,,
57
740
o
. . . .
62
370 50
48
50 370 ...54 ....
370
67 56
49
740 Specimen No.
HFA00V0
63
0
370 54
. . . .
740 45
Specimen No. HFA00V0
Table 9. Coarse Aggregate Washing Test
HFAOOV1
Substitution Ratio of Admixture (%)
. . . .
HFA00V2 HFA10V0 HFA10V1
.. .. .
HFA 10V2 HFA20V0 HFA20V 1 H ~ 0 V 2
Fly Ash
20cm or less
56
Over 20cm 49 Added Quantity of
Super Plasticizer (g/m 3)
. . . . ! . . . i
HFA30V0
HFA30V1 Fly Ash ...
r w A 3 0 V 2 3 0 % ,
. . .
370
0% . 740 53
0 55
Fly Ash 370 57
10% . . .
740 57
. . . . .
0 59
Fly Ash 370 5 3
20% 740 ' 51
0 64
370 ... 54
740 53
Segregation ....
Resistivity(%)
53 52
55 104
52 94
51 91
52 92
8 2 ...
48
87 98 ...
51 95
52 102
51 80
51 94
52 ... 98 3) Filling Capability Test
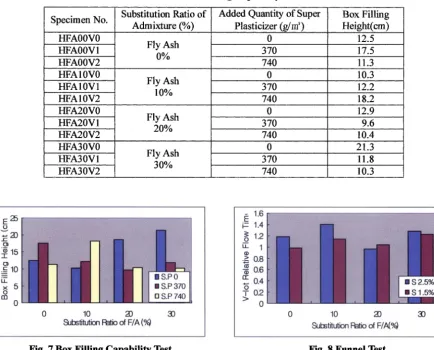
Table 10 and Figure 7 show the box filling capability test results of the high performance concrete. Table 11 and Figure 8 show the funnel test results of the high performance concrete. From the above results, it is thought that when the substitution ratio of the fly ash is 20% and the added quantity of the fluidizing agent is 300 g/m 3, such mix proportion is applicable to the dense reinforcement area and the wall and slab of 12in or less. Accordingly, an optimum mix proportion to be applied to the dense reinforcement area and the wall and slab of 12in or less is as in Table 12.
70
~o 6°
~40
33
0 10 29 33
Subslilulion Ratio of F/A (%)
Fig. 5 Slump Flow Test
r - . ,
110
-~ loo
O 9
"g 90
cc 80
t -
O
70
O9
0 10 20 30
Substitution Ratio of F/A (%)
t
Specimen No. HFA00V0 HFA00V 1 HFA00V2 HFA 10VO
... HFA10V1
HFA 10V2 HFA20V0
. . .
I-WA20Vl
HFA20V2
i-wA3ovo
HFA30V1
HFA30V2
Table 10. Box Filling Capability Test
Substitution Ratio of Admixture (%)
.... Fly Ash
0% Fly Ash
10%
Added Quantity of Super Plasticizer (g/m ~) ,
0
Box Filling Height(cm)
12.5
370 17.5
0 740
Fly Ash 20% Fly Ash
30%
370 . . . .
740
11.3 10.3
12.2
18.2 12.9
370 . . . 9.6 "
. .
740 0
10.4 21.3
" 370 ' 11.8 " '
740 10'3
E 2 5 o
Z ~
._c 10
H_
x 5
o m
o
0 l O 20
9ubstitution Ratio o f F / A (%)
33
Fig. 7 Box Filling Capability Test
- 1.6
E i-= 1.4
1.2 o u_ 1
O
.>-- 0.8
- i . . . ,
tl:l -~ 0.6 cc 0.4
4 - . '
o T O.2 >
o
10 29
S u b s t i t u t i o n Ratio of F/A(%)
Fig. 8 Funnel Test
33
Table 11. Funnel Test
Specimen No. LFA00S25
LFA00S15 LFA10S25 LFA10S15 LFA20825 LFA20S15 LFA30S25
LFA30S15
Substitution Ratio of Admixture Fly Ash 0% Fly Ash 10% Fly Ash 20% Fly Ash 30%
Added Quantity of Fluidizing Agent
s 2,5%
S 1.5%
s 2.s% s 15% s 2,5%
S 1.5%
S 2.5% , , S 1.5%
Funnel Relative Flow Time
.... 1.i8 0.98 1.40 ... 1.14 0.96
i .64 ...
1.28 1.22
Table 12. Optimum Mix Design
win(%)
45
S/A(%)
44
C ... i F / A
329 I 82
Unit Quantity(Kg/ n31
W G
717
Durability and Time-dependent Deformation Characteristic Experiment
Mix to be applied to Dome
1) Adiabatic Temperature Rising Test
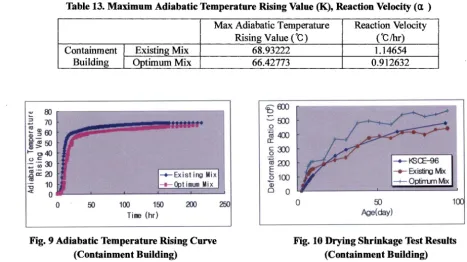
Table 13 and Figure 9 show the adiabatic temperature rising test results of the high performance concrete.
Table 13. Maximum Adiabatic Temperature Rising Value (K), Reaction Velocity (el)
Max Adiabatic Temperature Reaction Velocity Rising Value ( *(3 ) I (°C/hr)
Containment Existing Mix 68.93222 1.14654
Building Optimum Mix 66.42773 0.912632
8O 7O ~ = 6 0
~'~50
~ 4 0
0 ¢ "
z ~ 30 10 o
lix 1
• i + Opt i mum ~i x i~;ii [
0 50 100 150 200 250
Time (hr)
x - - 5OO .o ~zl]0
rr"
~-300 .o
~L:;O0 E
1oo
n 0 "
o 5O I00
Age(day)
Fig. 9 Adiabatic Temperature Rising Curve (Containment Building)
Fig. 10 Drying Shrinkage Test Results (Containment Building)
2) Drying Shrinkage
Figure 10 shows the drying shrinkage test results of the high performance concrete. 3) Compressive Strength
Figure 11 shows the compressive strength test results of the high performance concrete.
z ~ 1-.- E~r~ ~ x ( ~ o n ) [
~- 100 -It- Opln'unlvix(corrpaction) I
o 23 4o (clay ) 60 83 lOO
/k~e
Fig. 11 Compressive Strength Test Results (Containment Building)
> 7 0
~ 6 0
~30 ~20
._o
~ 10
~5 0
<
_ 4 _
0 50 100 150 200 250 33o
Time (hr)
Fig. 12 Adiabatic Temperature Rising Curve (Dense Reinforcement Area)
Mix to be applied to a dense reinforcement area, wall and slab of 12in or less
1) Adiabatic Temperature Rising Test
Table 14. Maximum Adiabatic Temperature Rising Value (K), Reaction Velocity (0~)
Dense Reinforcement Existing Mix
. . . Area . . . " ~timum,',M!X '
Max Adiabatic Temperature Rising Value (°C)
58'65797 59'50891
Reaction Velocity
( ° C / ~ )
1.07644 . ... ...
0.81413 . . . 2) Drying Shrinkage
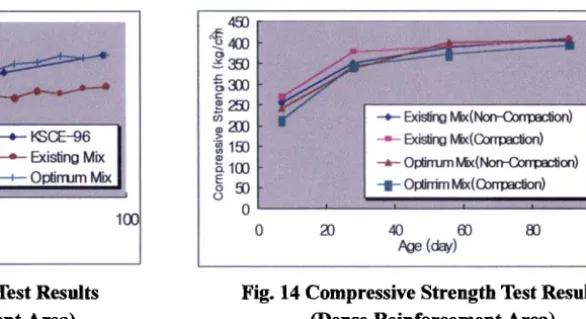
Figure 13 shows the drying shrinkage test results of the high performance concrete. 3) Compressive Strength
Figure 14 shows the compressive strength test results of the high performance concrete.
7 O 0
" - 6 0 0
o 500
m400
c - .o 300
t ~
~ 0
Existing Mix~:--F- Optin'um Mix
0 50 100
Age (day)
Fig. 13 Drying Shrinkage Test Results (Dense Reinforcement Area)
CONCLUSIONS
45O
~250
> a 150 o) a l 0 0 E o 50 O
0
~i~iil - I - Oplirrim Mix(Corrlmclion) llii~:
0 2O 4O 6O 8O IO0
Age (day)
Fig. 14 Compressive Strength Test Results (Dense Reinforcement Area)
This study has yielded the following conclusions;
1) In case of the mix to be applied to the containment building, when the substitution ratio of the fly ash was 20%, the best results was accomplished, and the 2.0% added quantity of the fluidizing agent was found to be an optimum added quantity.
2) In case of the mix to be applied to the dense reinforcement area, when the substitution ratio of the fly ash was 20%, the best results was accomplished, and the 300 g/m ~ added quantity of the super plasticizer was found to be an optimum added quantity to prevent segregation of aggregates.
3) In the durability and time-dependent deformation characteristic experiment, as a result of conducting the adiabatic temperature rising test and the compressive strength test, the optimum mix showed a better result than the existing mix. 4) The optimum mix derived from this study satisfies the basic performance of the high performance concrete as proposed in Korea. The durability of the high performance concrete based on the optimum mix is thought to be superior to that of the concrete used in the concrete structure for the existing power plant. It is, therefore, thought that the optimum mix derived from this study will be available as a basic data for putting the high performance concrete to practical use.
REFERENCES
1. Nicolas J. Carino, James R. Clifton, "High-Performance concrete; Research Needs to Enhance its Use", Concrete International, pp.70--- 76, 1991.